Cisco DCNM Programmable Report APIs

Template

In Cisco DCNM Release 11.4(1), the new template type “REPORT” is added with following two subtypes: UPGRADE and GENERIC. The template type is python and requires providing an implementation of method “generateReport”.

UPGRADE

UPGRADE templates are used for ISSU pre and post ISSU. These templates will be listed in ISSU wizard.

GENERIC

The GENERIC template can be used for any generic reporting purpose. For example, collecting inventory report.

Template Structure

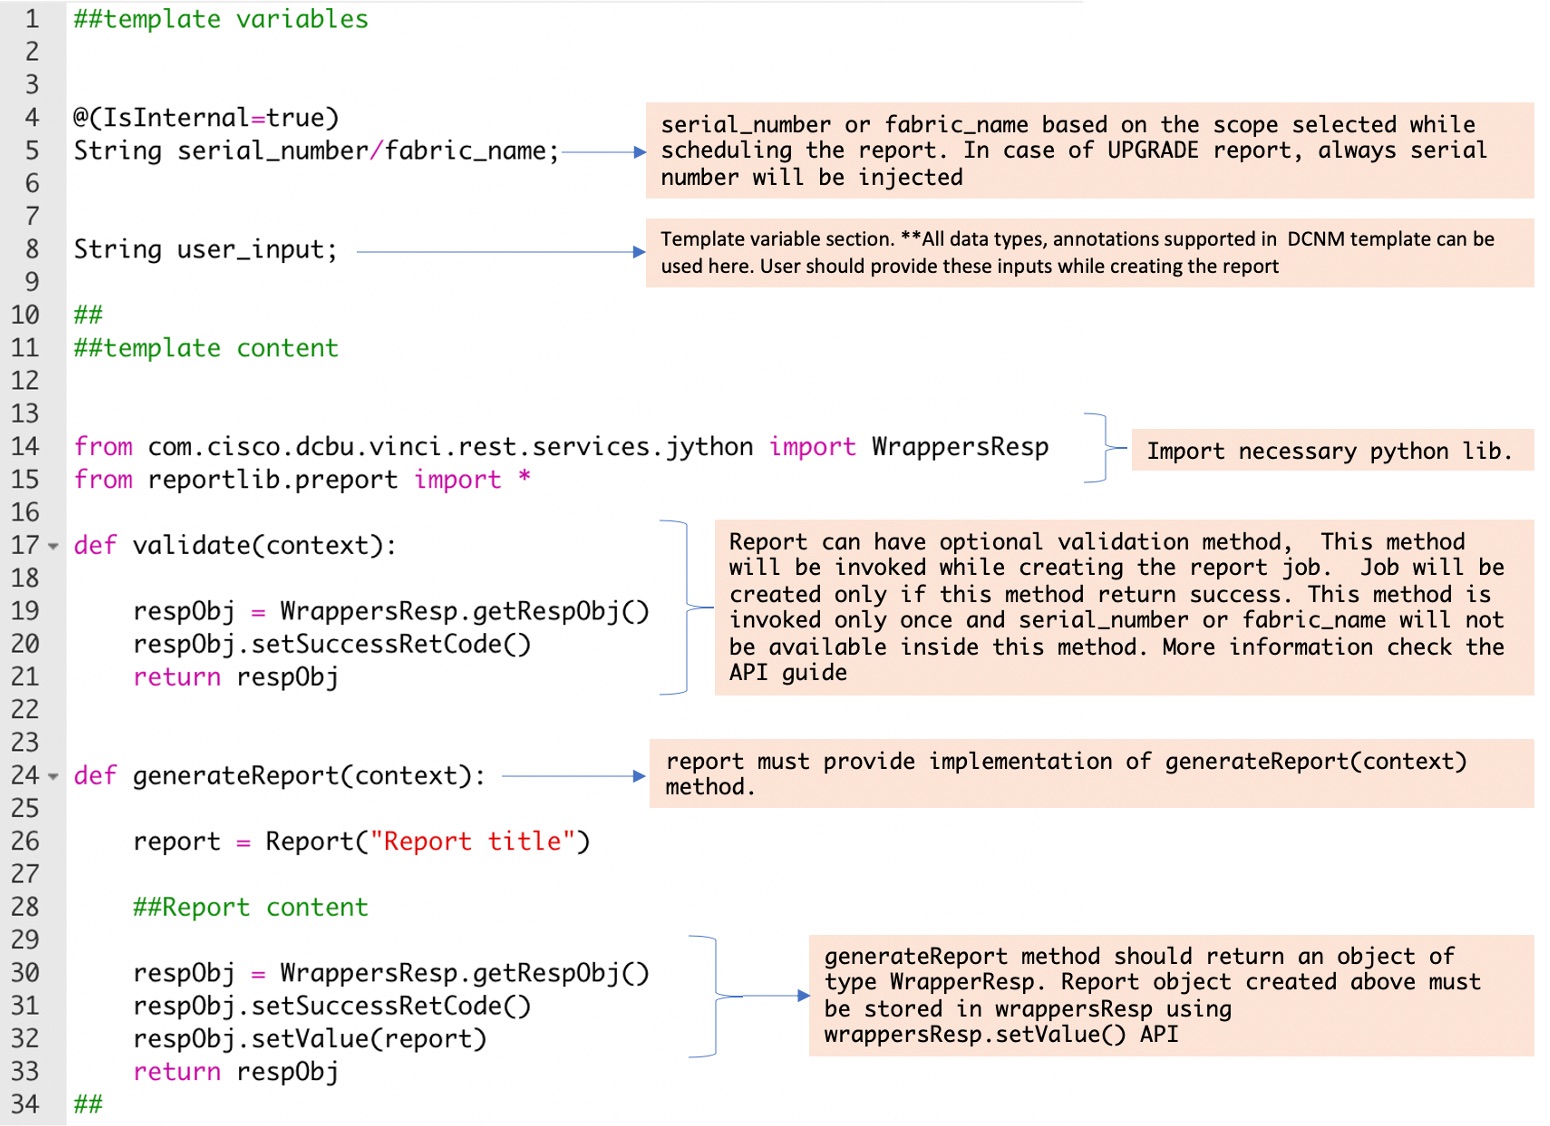
The following image shows an example template structure:

Template Functions

generateReport Method

The generateReport method is invoked while generating the report. All the report implementation logic should be provided. This method accepts context object. As mentioned above, this method should return WrappersResp object.

Validation Method

The Validation method is optional. If the template defines this method, report application calls this method to perform pre validation while creating the job. This method is called only when the job is created and invoked only once irrespective of device or fabrics selected.

If the validation is passed, this method should return WrappersResp with SuccessRetCode, and for failure FailureRetCode with error in error list.

For example:

Validation failed


def validate (context):
    respObj = WrappersResp.getRespObj()

    ## Validation logic here

    respObj.setFailureRetcode()
    respObj.addErrorReport(template_name,error)
    return respObj

Validation success


def validate (context):
    respObj = WrappersResp.getRespObj()

    ## Validation logic here

    respObj.setSuccessRetcode()
    return respObj

You can perform validation based on content of context parameter.

Context Parameter

Context parameter consists of following attributes:

  1. User name: Name of the user who created the job

  2. User role: Role of the user who created the job

  3. Job Id

  4. Recurrence: NOW, ONCE, DAILY, WEEKLY, MONTHLY, ONDEMAND, or PERIODIC

  5. Period: If the recurrence is periodic, then period will have frequency selected. For example, 10 MINUTES.

To read these values from context, see the APIs mentioned in Get Job Context Information.

Report Layout

A report contains the following components:

  1. Summary

    1. Key and values

    2. Messages – Inferences

  2. Details/Sections

    1. Key and values

    2. A JSON document – Cards

    3. Array of JSON Documents – Tables

  3. Command log

Summary View

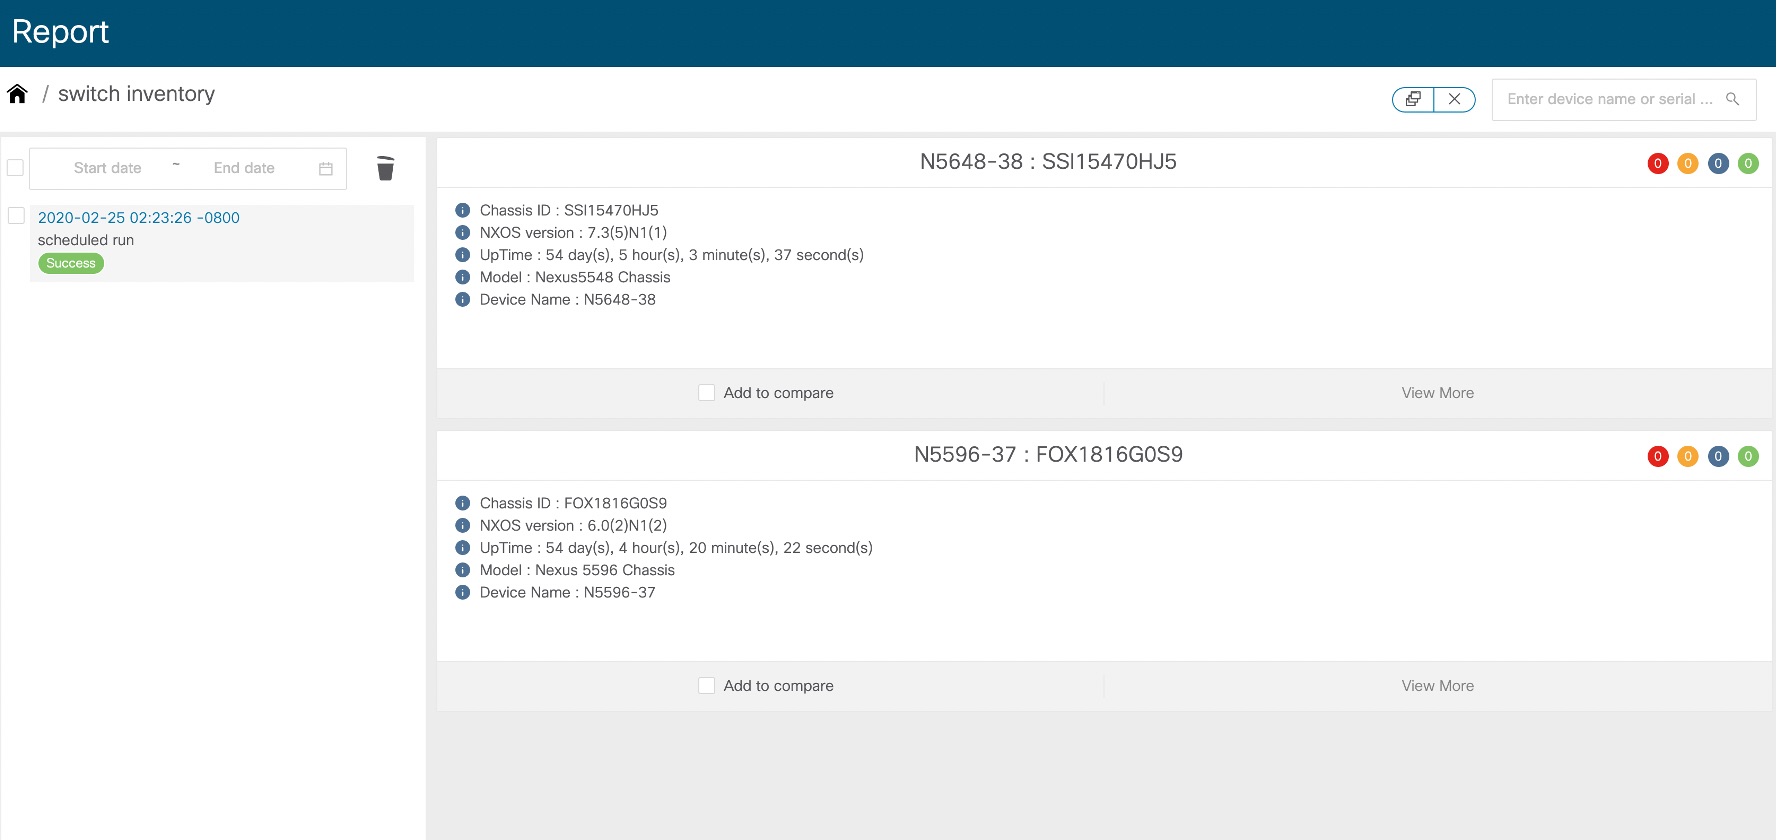
This view shows summary for each entity included in the report.

Detail View

The Detail view displays complete report JSON data along with summary. Report detail is logically grouped into sections. Each section is displayed separately with a collapsible widget.

Both summary and detail views provide counts of number of errors, warnings, info, success messages generated in the report.

Command Log

Command log contains all commands executed in the report, based on the API used to execute the commands.

Report Python Library

Reporting infrastructure provides an easy to use and light weight python library to generate the report JSON model. To use this API, you should add following import statement in the template:

from reportlib.preport import Report

Report APIs

Create Report Object

Every report should create a “Report” object as the first step.

report = Report (“Report title”)

Add Summary

Every report can have one summary and it’s a python dictionary. Summary can be added as follows:

summary = report.add_summary()
Adding Content to Summary

Key and values

summary [‘NXOS Version’] = ‘8.1(0)’

Messages – Inferences

summary.add_message (“Simple message”)

Note


In DCNM 11.4(1), DCNM does not support JSON object as value in summary. Following example is not supported.

summary[“info”] = {“key”:”value”,”key-2”:”value-2”}

Tables in Summary

table = summary.add_table(title,_id)
  • title: Table title

  • _id : Unique identifier for the table

Adding Rows to Table

table.append(value, _id)
  • value: A JSON object. Nested json not supported.

  • _id : Unique identifier for the table

For example:

table.append({'column1': 'value1',’column2’:’value2’},” FOX1816G0S9”)

Add Section

Section is a logical grouping of report contents. It’s up to the user to create these sections and add information to be displayed.

Section can be added as shown:

section = report.add_section (“Section title”,_id)
  • _id : Unique identifier for the table

  • section : It is a dictionary

Adding Content to a Section

Key and values

You can add simple key and value pair to section as shown below:

section[‘key’] = ‘value’

A JSON document – Cards

A single JSON document can be added as same as any key value pair. Nested JSON is not supported in 11.4(1)

section[‘key’] = {‘key’:’value’,’key-2’:’value’}

The JSON document is displayed in a card widget as shown:

Array of JSON Documents – Tables

The section.append API allows user to create a table and add rows to it with following restriction:

  1. All JSON document should have same set of keys

  2. Nested JSON is not supported

section.append(key, dictionary, _id)

_id: Unique identifier which uniquely identifies a row in a table. Duplicate _id resultx in Unique id violation error.

For example:

section.append('Switch Details', {'name': 'N5K'},'DSDAS244455')
section.append('Switch Details', {'name': 'N6K'}, 'CSDAS244456')
section.append('Switch Details', {'name': 'N7K'}, 'ASDAS244457')
Formatters

Formatter allows you to add additional formatting to values displayed in UI.

As shown, you can mark values as:

  1. ERROR

  2. SUCCESS

  3. WARNING

  4. INFO

When you add these markers to report, corresponding counts error, warning, success, info are automatically updated to be displayed in the UI.

Formatter.add_marker(value,marker)
  • value: Value to add marker.

  • marker: Marker.ERROR,Marker.SUCCESS,Marker.WARNING,Marker.INFO

For example:
Formatter.add_marker (“NXOS version”,Marker.INFO) 

Chart

Report supports adding chart in both summary and section.

Adding Chart to Summary

report = Report(“title”)
summary = report.add_summary()
summary.add_chart(ChartType, _id)
  • ChartType: ChartTypes.COLUMN_CHART, ChartTypes.PIE_CHART, ChartTypes.LINE_CHART.

  • _id: Unique ID for the chart.

Adding Chart to Section
report = Report(“title”)
section = report.add_section(“Section title”,_id)
section.add_chart(ChartType, _id)
  • ChartType: ChartTypes.COLUMN_CHART, ChartTypes.PIE_CHART, ChartTypes.LINE_CHART

  • _id: Unique ID for the chart

Pie Chart
Set and subtitle title
pie_chart.set_title("Chart title")
pie_chart.set_subtitle(“Sub title”)

Add value

pie_chart.add_value("key",value)
  • key: String key

  • value: Numeric value

Column Chart

Set and subtitle title

column_chart.set_title("Chart title")
column_chart.set_subtitle(“Sub title”)
Set X-Axis and Y-Axis title

column_chart.set_xAxis_title("X-Axis title")
column_chart.set_yAxis_title("y-Axis title")

Add Value

bar_chart.add_value("key",value,category)
  • key: String key

  • value: Numeric value

  • category: Bar chart divides the data into logical group called “category”. A given key should have value in each category.

For example, device count is a key and Fabric Names are categories. Chart should have Device count for each fabric that is, each category.

Line Chart

Set and Subtitle Title

line_chart.set_title("Chart title")
line_chart.set_subtitle(“Sub title”)
Set X-Axis and Y-Axis title

line_chart.set_xAxis_title("X-Axis title")
line_chart.set_yAxis_title("y-Axis title")

Add Value

line_chart.add_value("key",value,category) 
  • key: String key

  • value: Numeric value

  • category: Line chart divides the data into logical group called “category”. A given key should have value in each category.

For example, device count is a key and Fabric Names are categories. Chart should have Device count for each fabric, that is, each category.

Run CLIs on Device

Show Command
from reportlib.preport import show
cli_responses = show (serial_number ,*commands)
  • serial_number: Serial number of the device to run commands. In case of VDC serial number should be serial_number:vdc_name. You can pass list of serial number to execute the same set of commands on multiple devices.

  • *commands: Commands to run on device. It’s a var args. You can specify multiple commands.

Examples:

  • Executing command on single switch:

    cli_responses = show(“FOX1816G0S9”,'show version | xml', 'show inventory | xml', 'show license usage | xml')
  • Executing command on multiple switches:

    cli_responses = show( [“FOX1816G0S9”,”SSI15470HJ5”],'show version | xml', 'show inventory | xml', 'show license usage | xml')
Show Commands and Store Response
from reportlib.preport import show_and_store
cli_responses = show_and_store(report,serial_number,*commands)

report: Report Object created.

serial_number: Serial number of the device to run commands. In case of VDC, serial number should be serial_number:vdc_name. You can pass a list of serial number to execute the same set of commands on multiple devices

*commands: Commands to run on device. It’s a var args. You can specify multiple commands.

Examples:

  • Executing command on single switch:

    cli_responses = show_and_store(report, “FOX1816G0S9”, 'show version | xml', 'show inventory | xml', 'show license usage | xml')
  • Executing command on multiple switches:

    cli_responses = show_and_store(report, [“FOX1816G0S9”,”SSI15470HJ5”], 'show version | xml', 'show inventory | xml', 'show license usage | xml')

Caution: This API stores the response from the device in elasticsearch along with report. User should be cautious while using this API, since storing all response may increase storage drastically.

Return Value

The Return Value API will return list of responses, and each response is a dictionary with following structure:


{
	'status': 'success' | 'failed,
	'response':<response from device>,
	'command':<cli command>,
	'serial_number': <device serial number>
}

In case of multiple switches, the response still be a list of responses with entries for each switch.

[
{
	'status': 'success',
	'response':<response from device>,
	'command':’show version’,
	'serial_number': ‘FOX1816G0S9’
},
{
	'status': 'success',
	'response':<response from device>,
	'command':’show version’,
	'serial_number': ‘SSI15470HJ5
}
]

Get Job Context Information

Get Recurrence Selected While Scheduling the Job from APP
get_recurrence(context)

This API returns the recurrence selected while creating the job. Returns value can be NOW,ONCE,DAILY,WEEKLY,MONTHLY,ONDEMAND, and PERIODIC.

get_period

If job is scheduled as Periodic, then period information can be accessed using the API:

period = get_period(context) 
period.get_period() will return the period 
period.get_time_unit() will return time Unit (HOURS, MINUTES)

Analyze with Historical Reports

Get Previously Generated Reports

The “get_previous_reports()” method allows to get reports generated in the past. This can be used to perform analysis based on current data and historical data. This API will return the report in descending order of created time.

List of reports = get_previous_reports (context,entity,count)

This API returns a list of reports.

context: The object received as input from generateReport(context) method.

entity: serial_number or fabric name.

count: Number of reports to fetch.

Get Oldest Report
oldest_report = get_oldest_report(context,entity)

context: The object received as input from generateReport(context) method

entity: serial_number or fabric name

Both the above APIs return Report object with the following API to retrieve information:

  1. Get summary : report.get_summary()

  2. Get section : report.get_section(_id)

report.get_section(_id)

_id: Unique Identifier for the section.

XML Utilities

Get XML Tree
from reportlib.preport import getxmltree
xml_element_tree = getxmltree(xml_string,tag)

This API returns the XML tree under the given tag.

xml_string: XML response from device.

tag: XML tag. Complete XML under this tag will be returned as ElementTree.

xml_element_tree: This API returns xml.etree.ElementTree object.

Get XML Rows

If the CLI response has rows, you can get the array of rows by using the getxmlrows API.

from reportlib.preport import getxmlrows
rows = getxmlrows(xml_tree,tag_xpath)

xml_tree: xml.etree.ElementTree object

tag_xpath: xpath of the XML record. For more info, see https://docs.python.org/2/library/xml.etree.elementtree.html#xpath-support.

rows: Array of rows.

Get Node Value

XML node value can read using the getnodevalue API. This API should be used get the node value of primitive type.

from reportlib.preport import getnodevalue
value = getnodevalue(xml_tree,node_xpath)
Check Whether Node Exists
from reportlib.preport import has_tag
has_tag(xml_tree,tag)

This API returns true or false based on whether the given tag is present in XML tree.

WrapperResp

Every report should return an object of the type WrapperResp.

WrapperResp can be instantiated as:

respObj = WrappersResp.getRespObj()

The return code in WrapperResp indicates whether the report ran successfully or not.

  1. If all commands are run and required information is extracted, then report returns success respObj.setSuccessRetCode().

  2. In case of any exception like commands failure, then report returns failure respObj.setFailureRetCode().

  3. In case of an error, you can add the reason for error as respObj.addErrorReport(template_name,error_message).

The report object created in the Report section should be set to value of WrappersResp as shown:

respObj.setValue(report)

Logger

Logger allows you to log messages from report template. All information logged using the logger is logged to: “/usr/local/cisco/dcm/fm/logs/preport_jython.log”.

Logger.info(“message”)
Logger.debug(“message”)
Logger.error(“message”)
Logger.trace(“message”)
Logger.warn(“message”)