Catalog
The Catalog allows you to view all the applications that you have installed or enabled on the Cisco DCNM. Few applications are installed and are operational by default, when you install the Cisco DCNM.
The following applications appears based on the Cisco DCNM Deployments:
-
Health Monitor (2.1)
-
PTP Monitoring (1.1)
-
Kibana (2.0)
-
Programmable report (1.1.0)
-
Elastic Service (1.1)
-
Compliance (4.0.0)
-
Debug Tools (2.1)
-
IPAM Integrator (1.0)
-
Endpoint Locator (2.1)
-
Kubernetes Visualizer (1.1)
-
vmmplugin (4.1)
 Note |
The applications started by default, or also installed on the DCNM utilizes infrastructure services are operational, by default. |
You can install more applications from the App Center, via the Web UI.
For instructions about downloading, adding, starting, stopping, and deleting applications from the Cisco DCNM Web UI, see Installing and Deploying Applications.
Programmable Report
The Programmable Report application enables the generation of reports using Python 2.7 scripts. Report jobs are run to generate reports. Each report job can generate multiple reports. You can schedule the report to run for a specific device or fabric. These reports are analyzed to obtain detailed information about the devices.
The REPORT template type is used to support the Programmable Report feature. This template has two template subtypes- UPGRADE and GENERIC. For more information on the REPORT template, refer Report Template. A python SDK is provided to simplify report generation. This SDK is bundled with DCNM and provides APIs to generate reports. For more information on APIs, refer Report APIs.
RBAC support
-
An admin or a network operator can create a report..
-
A network operator can view reports created by other admins and operators.
-
A network operator cannot delete/edit/rerun any reports created by an admin and other network operators.
-
An admin can view and delete any report irrespective of the user creating them.
-
An admin cannot edit any report created by other user, including network operator, due to fabric and device association.
 Note |
A Jython template supports a maximum file size of 100k bytes. In case any report template exceeds this size, Jython execution may fail. |
To launch the Programmable Report app, on the Cisco DCNM Web UI, choose Applications. On the Catalog tab, click Programmable report to launch the application. The Report window is displayed. This window has two tabs, User Defined and Internal. The User Defined tab displays the report jobs which are created by a user. For information on creating a report job, refer Creating a Report Job. On any window, click the Home icon at the top left of the screen to return to this Report window. All operations such as creating, deleting, editing, re-running, displaying history, and downloading of report job information, are supported for the jobs displayed in this tab.

|
Field |
Description |
|---|---|
|
Title |
Specifies the title of the report job. |
|
User |
Specifies the user who has initiated the report generation. |
|
Recurrence |
Specifies the frequency at which the reports are generated. |
|
Scope |
Specifies the scope of the report. The report can be generated for a device or a fabric. |
|
Template |
Specifies the name of the template. |
|
Status |
Specifies the status of the report. The status messages are as follows- *Success - Report is generated successfully. *Scheduled - A report generating schedule is set. *Running - A report job is running. *Failed - Report execution failed for one or more selected switches/fabrics or an issue occurred during running of the report job. *Unknown - Job state could not be identified. |
|
Created At |
Specifies the time at which the report was created. |
|
Last Executed |
Specifies the time at which the report was last generated. |
|
Start Date |
Specifies the date at which the report generation is scheduled to start from. |
|
End Date |
Specifies the date at which the report generation is scheduled to end at. |
The Internal tab displays the report jobs that have been created by DCNM. For example, Pre and Post-ISSU report jobs that are created by the ISSU wizard are considered as internal jobs. However, you can only view report job information and history for the report jobs in this tab. You cannot delete a report job displayed under this tab as any deletion may affect the working of a DCNM feature that depends on this report.

You can also watch the video that demonstrates how to use the Programmable Report application in Cisco DCNM. See Programmable Report.
Creating a Report Job
To create a report job, perform the following steps:
Procedure
|
Step 1 |
Click Create Report icon. The Create Report window is displayed.  |
||||
|
Step 2 |
Enter a name for the report job in the Name field. |
||||
|
Step 3 |
Specify the frequency at which the report job should be run by selecting the required button next to Recurrence. For this
use-case, select Now. The Recurrence options are as given below: *Now - The report is generated now. *Once - The report is generated once at the specified time. *Daily - The report is generated daily at a specified time between the Start Date and End Date. *Weekly - The report is generated once a week at a specified time between the Start Date and End Date. *Monthly - The report is generated once a month at a specified time between the Start Date and End Date. *Periodic - The report is generated periodically in a time period between the specified Start Date and End Date. The interval of time between the reports can be specified in minutes or hour(s).
*Ondemand - The report is generated on demand. This report can only be generated by clicking the Rerun icon in the Report window.
|
||||
|
Step 4 |
Specify the devices or fabrics on which the report job should be run to generate the report. |
||||
|
Step 5 |
Click Next. Select a template from the Template drop-down list in the Create Report window. Each report template has a device or fabric tag associated with it. The following pre-defined templates are available: Device scope- *switch_inventory Fabric scope- *fabric_nve_vni_counter *fabric_resources *sfp_report In addition to the templates listed above, any other templates that have been created by you will also be listed here. For more information on default templates and creating customized templates, refer Template Library. Templates are listed based on the associated tags. If you select the Device scope, the templates with the device tag are listed in the drop-down list. If you select the Fabric scope, the templates with the fabric tag are listed in the drop-down list. 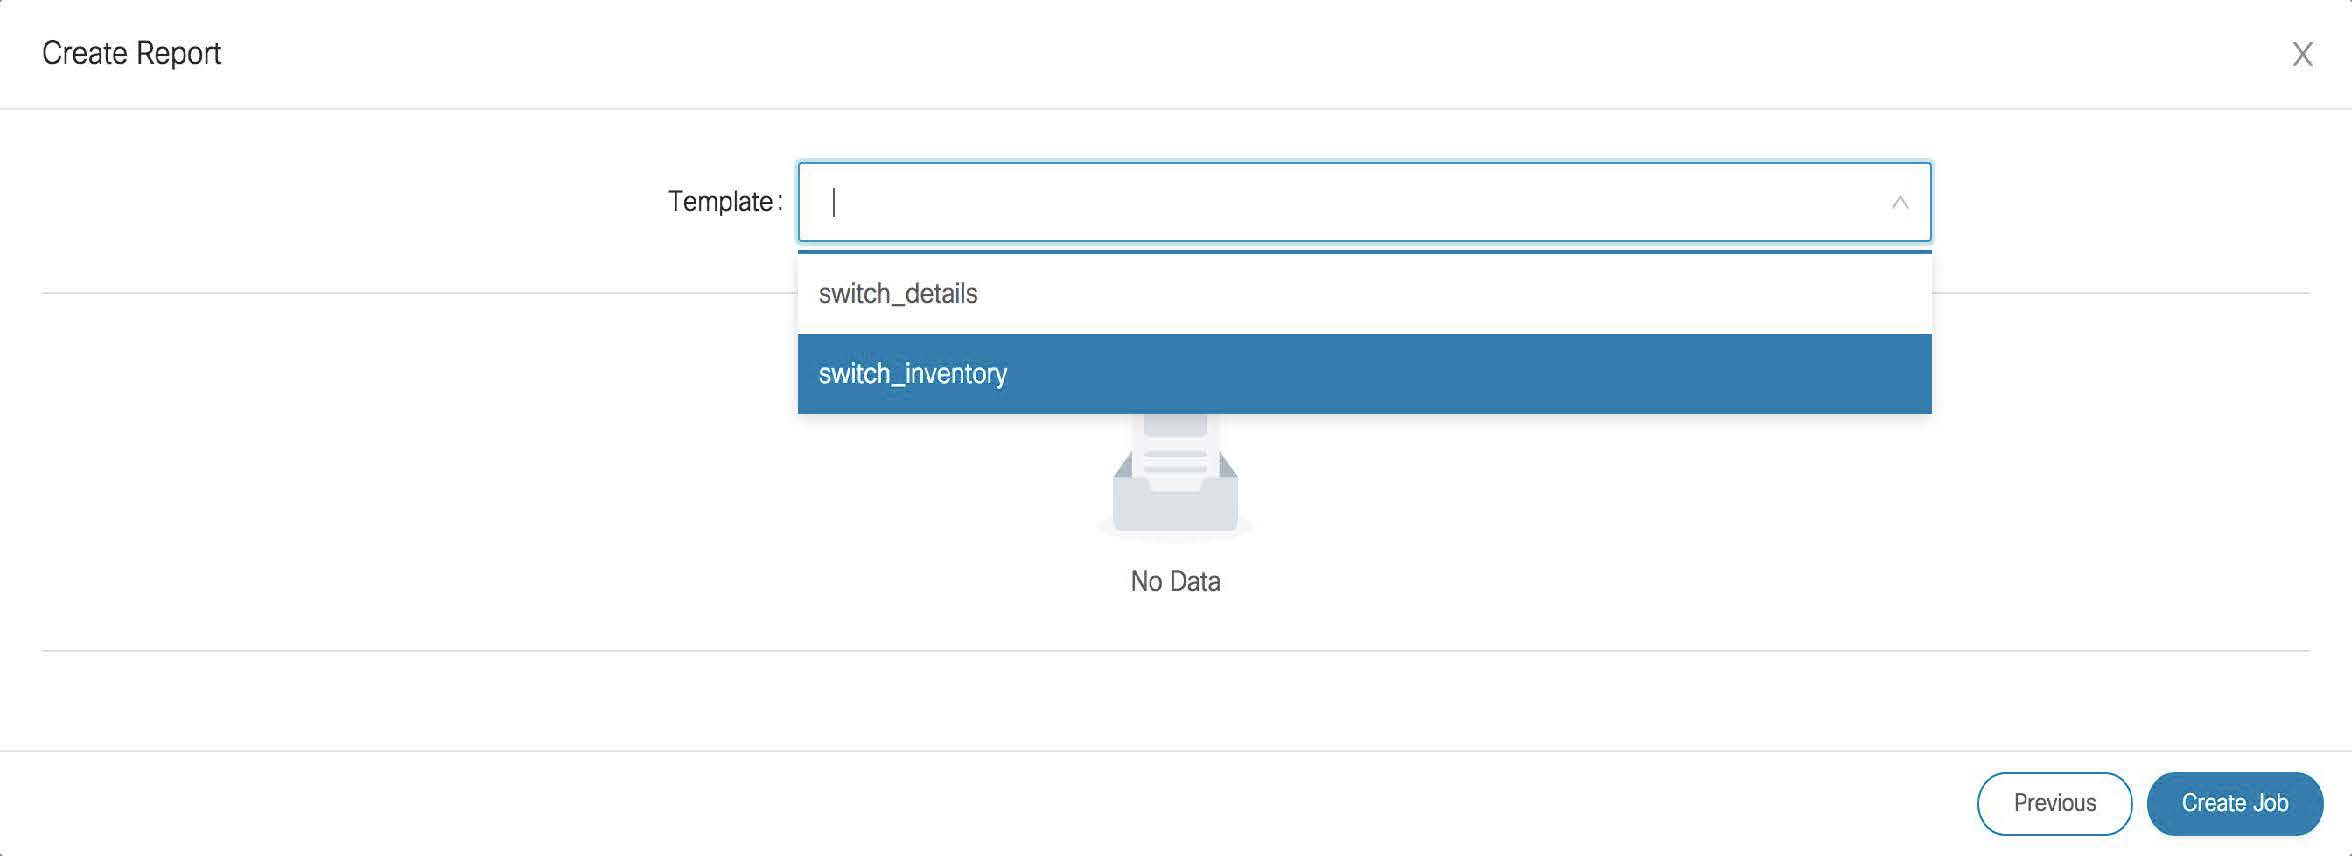 |
||||
|
Step 6 |
Click Create Job. A pop-up comes up stating that the Job report has been created successfully. Click the Refresh icon in case the newly created job report is not displayed in the list. When you hover over the Status column for the new report, the status is Running which indicates that a report is currently being generated. The status will change to a green tick indicating Success after the report has been successfully generated. |
Viewing a Report Job
Click a report title from the list of displayed report jobs to view the required information.

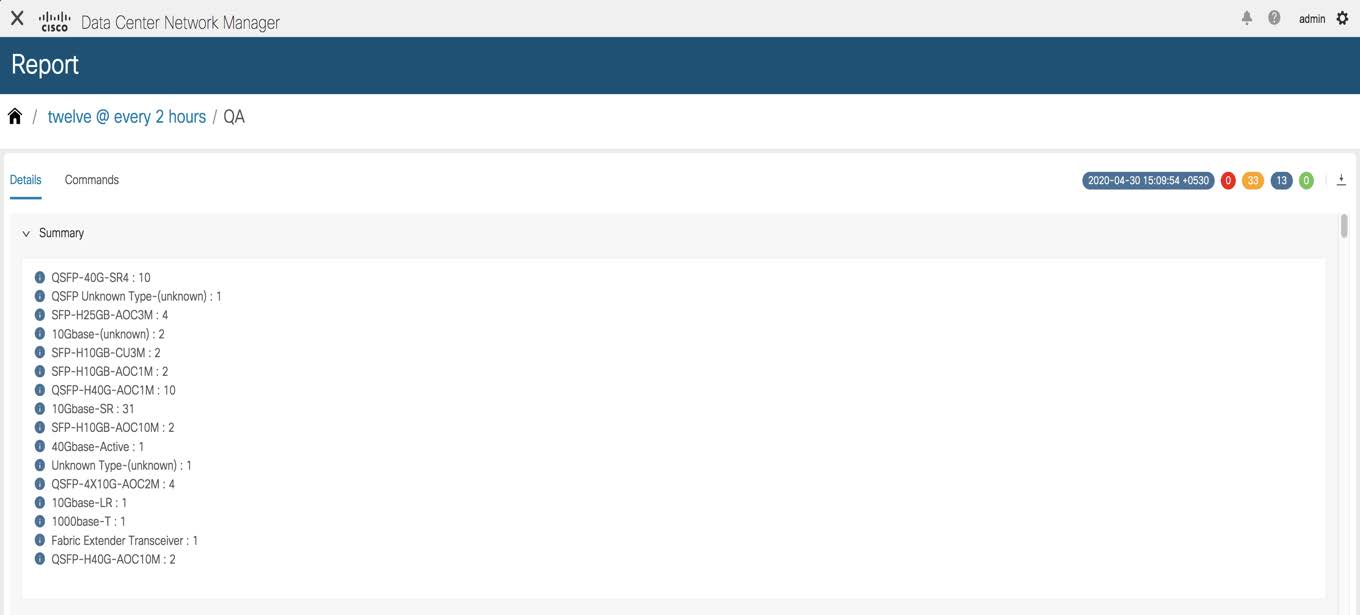
The Report window is displayed. The number of errors, warnings, info, and success messages that are color coded and displayed in this window depends on the report details. Errors are displayed in red, Warnings in yellow, Info in blue and Success in green. The summary is not considered for the generation of these numbers.

Reports can be generated for multiple devices. You can also see a timeline on the left of the window indicating the time at which a report was generated. You can click an item in this timeline to display the report that was generated at that moment. You can also display the reports that are generated in a specific time-frame by selecting a Start date and End date.
Click View Details to display detailed information.
The Details tab displays a report summary along with other relevant information based on the type of report template.
The report detail is logically grouped into sections. Each section is displayed separately with a collapsible widget. The number of errors, warnings, info, and success messages generated in the report is color-coded and is displayed on the top right part of the window.
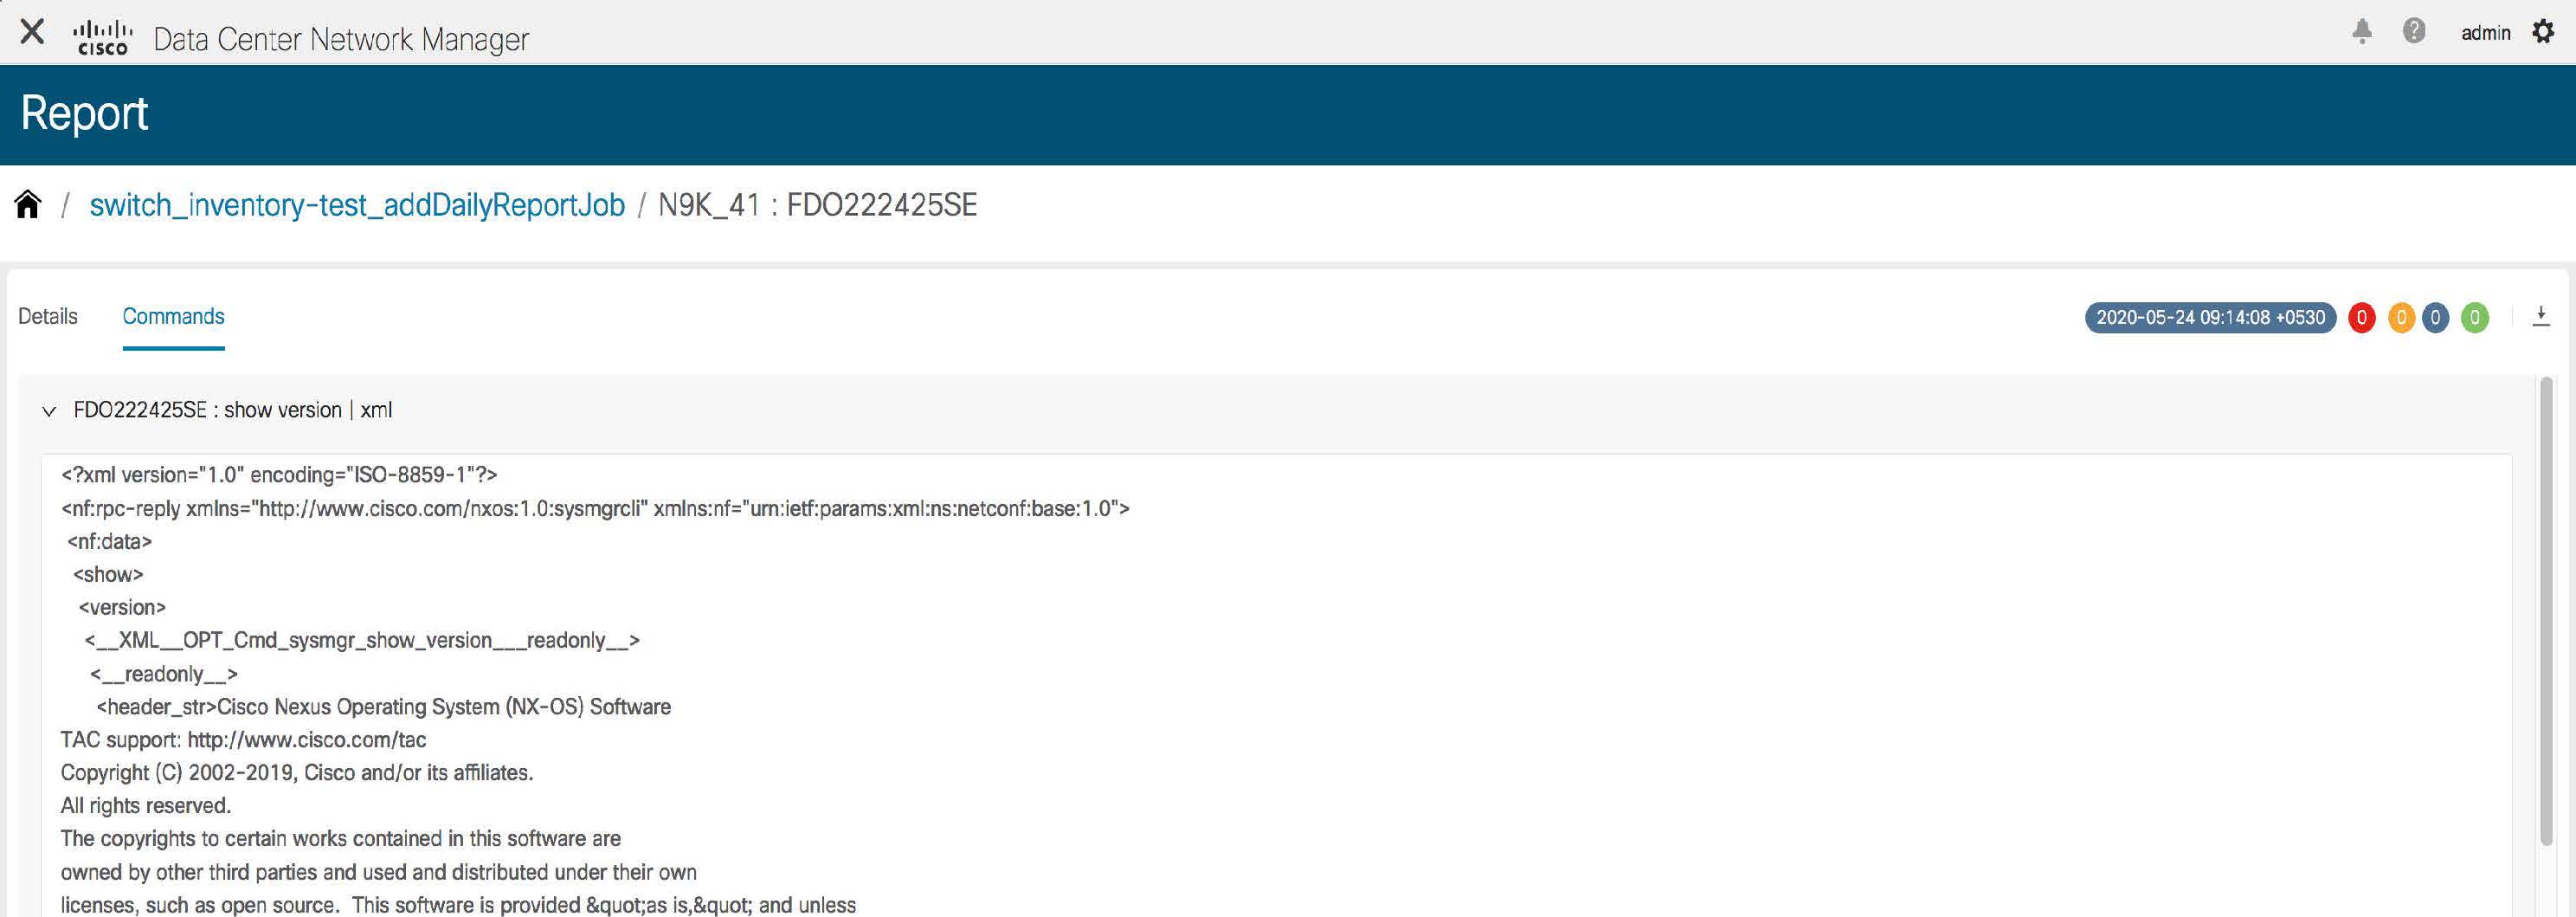
Click the Commands tab to display the commands that have been executed to generate the report. The commands are displayed based on the templates and the API that is used to run the commands on the device. For example, in the switch_inventory template, the show version, show inventory and show license usage commands are run to retrieve information. Note that the commands are displayed only if the show_and_store API is used to run the commands on the device.

Downloading Report Information
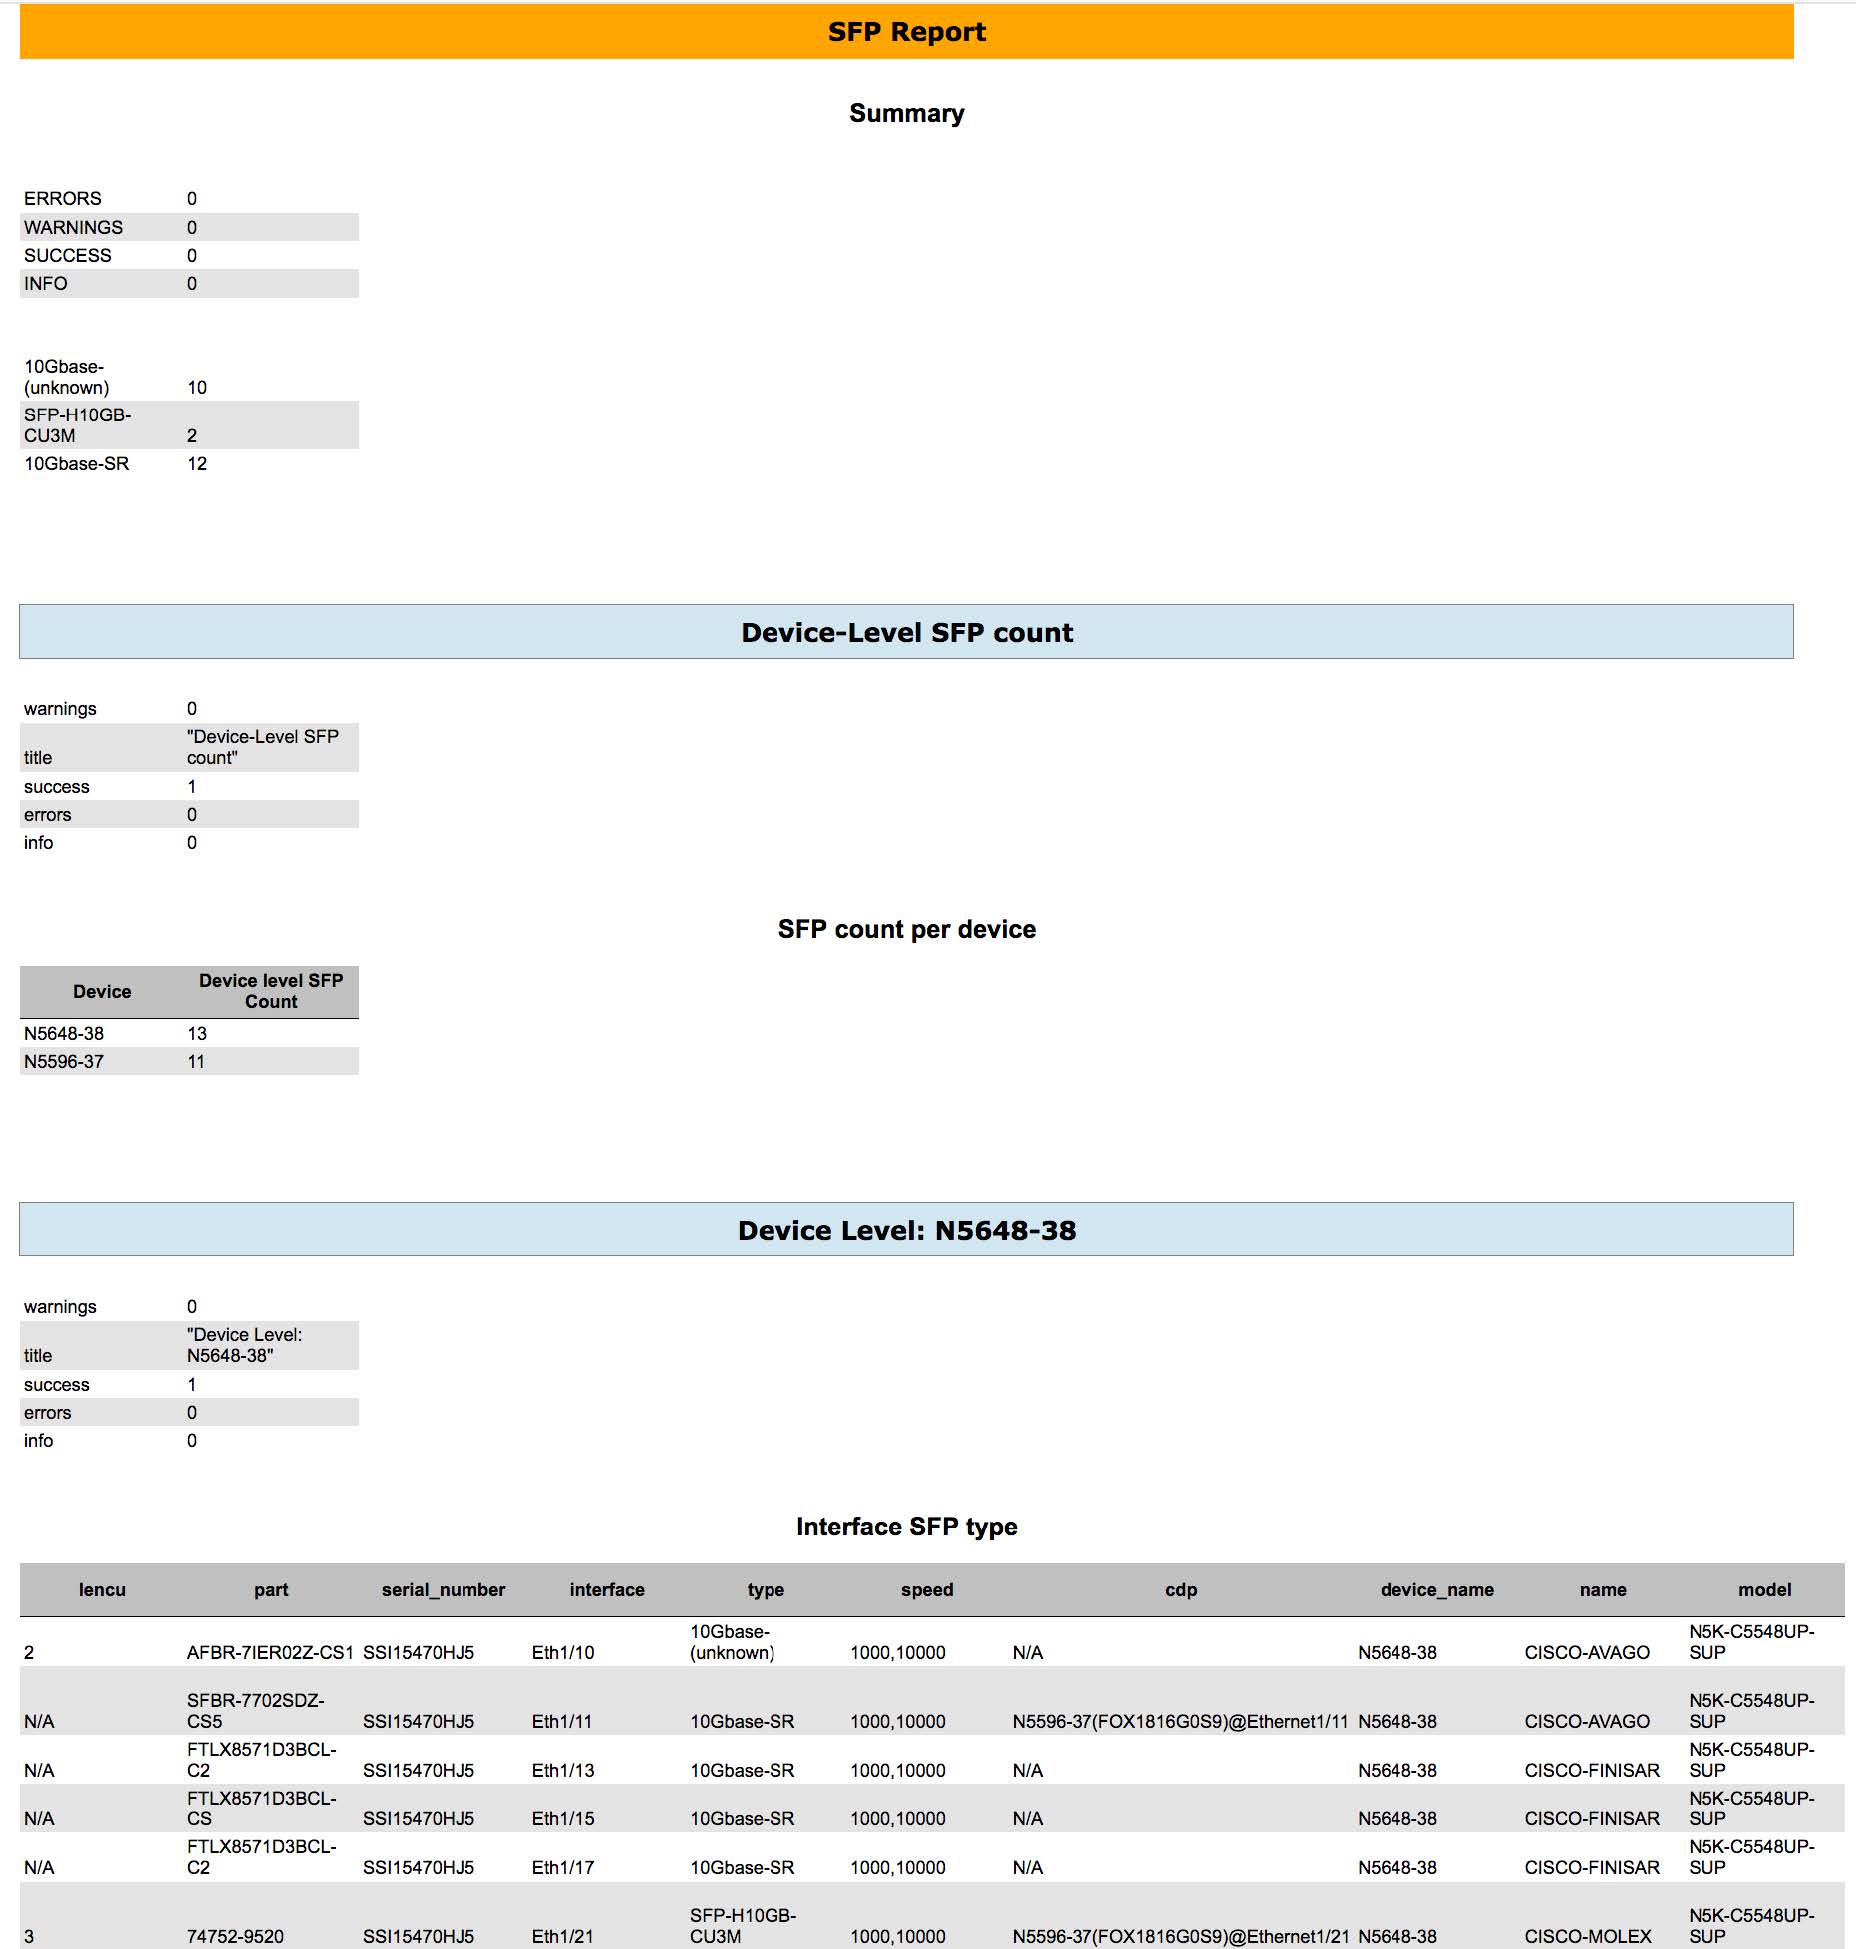
To download report information, click the Export Report icon in the Details tab. To download the commands along with the outputs, click the Export Report icon in the Commands tab.

Detailed information about the report is then displayed in a separate window.
Deleting a Report
To delete a report, select a report on the report timeline that has to be deleted and click the Delete
![]() icon.
icon.

A pop-up window is displayed asking for confirmation to delete the report. Click Yes to delete the report.
Comparing Reports
You can compare any two reports that have been generated from the same report job.
To compare reports, perform the following steps:
Procedure
|
Step 1 |
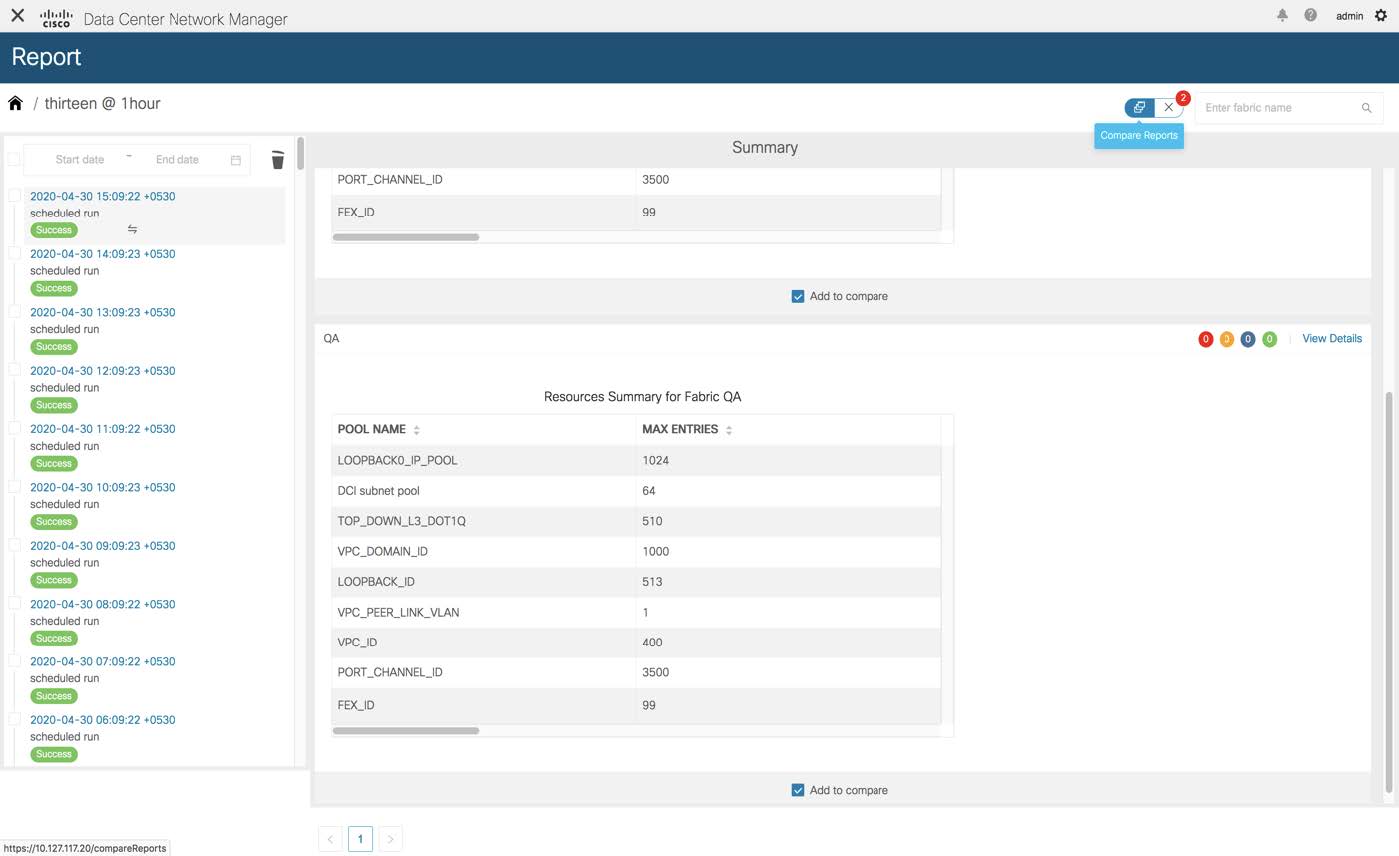
Select the Add to compare checkboxes in a Report window. The number of reports that have been selected for comparison is indicated by the red colored number icon next to
the X at the top right of the window. |
|
Step 2 |
Click Compare Reports icon at the top right of the window. |
|
Step 3 |
The Compare Reports window is displayed with a side-by-side comparison. |
Deleting a Report Job
To delete a report job, select the checkbox next to the report job that has to be deleted and click the Delete Report icon.

Deleting a report job also deletes all the reports that have been generated by that report job.
Editing a Report Job
To edit a report job, perform the following steps:
Procedure
|
Step 1 |
Select the checkbox next to the report that has to be edited and click the Edit Report icon. Note that only one job can be edited at a time. |
|
Step 2 |
The Create Report window is displayed. You can edit the Start Date & Time, End Date & Time, Period, and Device or Fabric selected. After editing
the required parameters, click Next. |
|
Step 3 |
Click Update Job. A pop-up window is displayed indicating that the report job has been updated successfully. |
Rerunning a Report Job
On the Report window, select the checkbox next to the report that has to be generated again and click the Rerun Report icon to run a report job again. A pop-up window is displayed indicating that the report job has been run again successfully.
You can use the re-run option to generate a report before the scheduled execution time. In case of an Ondemand job, you need to click the Rerun Report icon to generate the report.
Displaying Report Job History
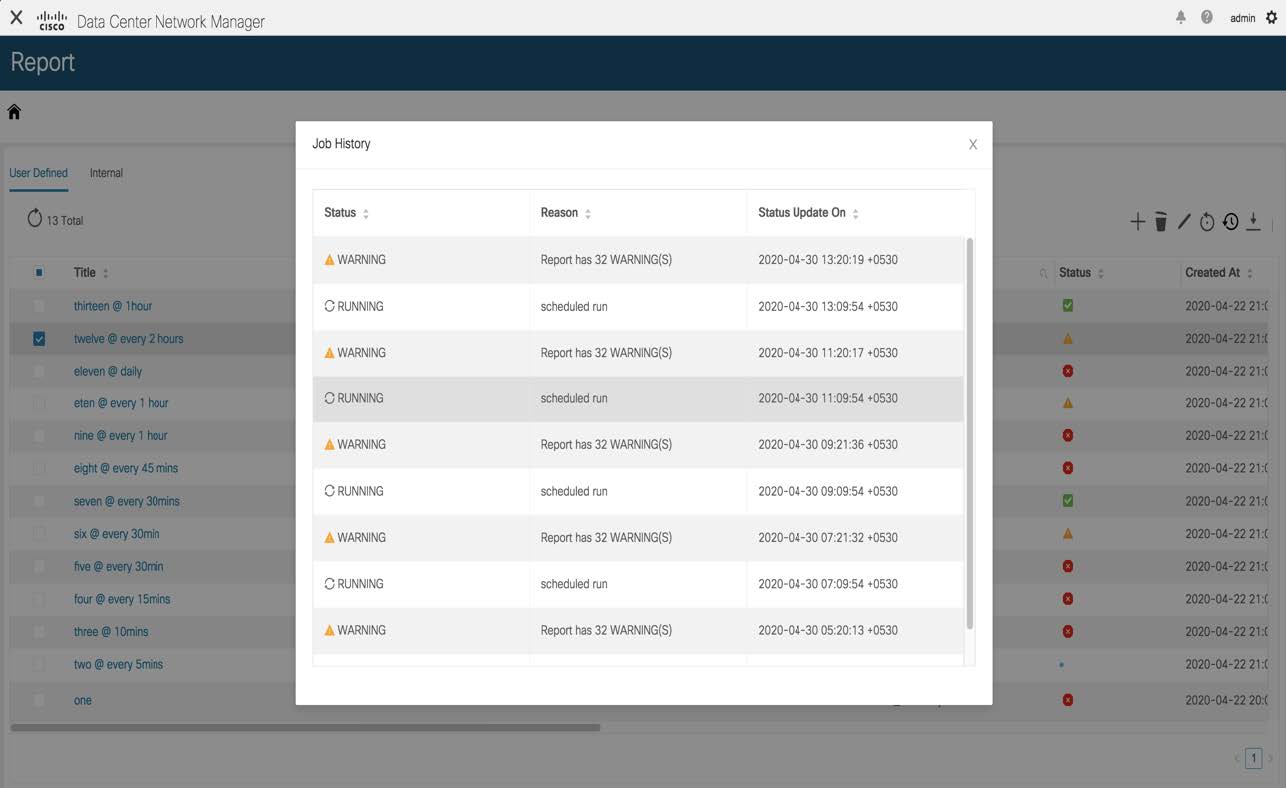
To display report job history, select the checkbox next to the report job for which the history has to be displayed, and click
the History icon. The Job History window is displayed. You can view the last 100 entries per report job.
Downloading Report Job Information
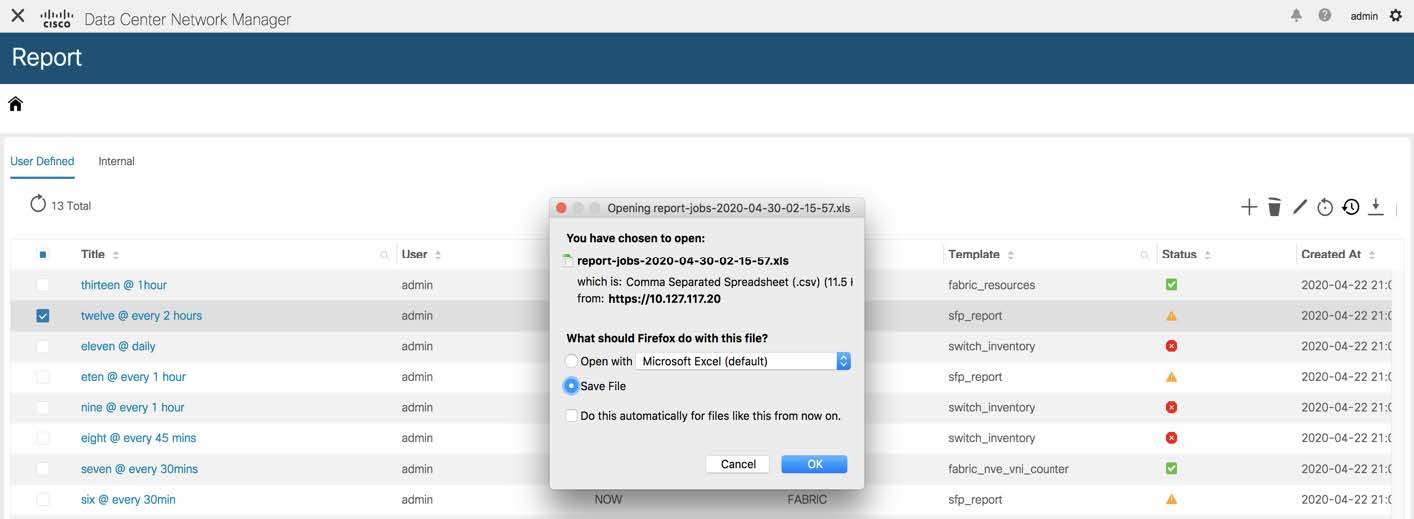
To download report job information as a CSV file, click the Download icon, select the location to which the CSV file should be downloaded to, and click OK. A CSV file with information about the report job is downloaded.
Report Purging
Purging reports leads to creation of space for new reports. A separate report index is created for each report job as each report job can have a different recurrence interval. So, the number of reports that are generated in a given period of time may be different for different report jobs. Separate report indexes help in purging the reports easily. Each report index has a maximum size limit of 100MB and a maximum report count of 500. If the limits are exceeded, the older reports are deleted to make space for new reports.
At any instant, only 70% of the maximum threshold value is retained. For example, consider a scenario in which the maximum report index size is 100MB. On purging, only reports that take up to 70MB space on an average are retained. This provides space for new reports that are generated. The maximum report count of 500 also has a threshold value of 70%.
-
To modify the limits and the threshold percentage values, use the following REST API:
URL: appcenter/Cisco/preport/integrated/admin/reportconfig
METHOD: POST
You can configure one or more threshold attributes and values.
{
<threshold attributes>: <value>
}
The <threshold attributes> are given below-
MAX_REPORT_SIZE: Maximum size of the report index in KB
MAX_USAGE_PERCENTAGE: Maximum percentage of “MAX_REPORT_SIZE” to retain
MAX_NUMBER_OF_REPORTS: Maximum number of reports
MAX_NUMBER_OF_REPORTS_PERCENTAGE: Maximum percentage of
“MAX_NUMBER_OF_REPORTS” to retain
MAX_HISTORY_SIZE: Maximum size of history in KB
MAX_HISTORY_PERCENTAGE: Maximum Percentage of “MAX_HISTORY_SIZE” to retain
MAX_NUMBER_OF_HISTORY: Maximum number of historical reports to retain
MAX_NUMBER_OF_HISTORY_PERCENTAGE: Maximum percentage of
“MAX_NUMBER_OF_HISTORY” to retain
Enter integers for the <value> attribute.
-
*To retrieve the currently configured limits, use the following API:
URL: appcenter/Cisco/preport/integrated/admin/reportconfig
METHOD: GET
-
To retrieve current utilization statistics, use the following API:
URL: appcenter/Cisco/preport/integrated /admin/index/stats
METHOD: GET
-
Reports are purged once a day at 12 AM. You can also initiate a purge. To initiate a purge, use the following-
REST API:
URL: appcenter/Cisco/preport/integrated/admin/purge/report
METHOD: POST
-
Report execution history is stored in a single index for all the jobs and purged at even hours. The maximum index limit for report execution history is 1000 and the maximum size allowed is 500MB. To change these limits, use the following REST API:
URL: appcenter/Cisco/preport/integrated/admin/reportconfig
METHOD: POST
-
To initiate a purge of the report execution history, use the following REST API:
URL: appcenter/Cisco/preport/integrated/admin/purge/history
METHOD: POST
-
To initiate a purge of both reports and report execution history, use the following REST API:
URL: appcenter/Cisco/preport/integrated/admin/purge
METHOD: POST




 Feedback