Client History

Details and History of a Device

Cisco Spaces: Detect and Locate aggregates and displays various devices in your network. These devices include clients, tags, BLE tags, and interferers.

This article is structured to cover these main aspects:

  • accessing and understanding the device details window
  • exploring device history and location tracking, and
  • delving into insights about your device.

Through detailed device data and insights, you learn how to effectively manage your devices. You can interpret historical location data, and utilize insights for informed decision-making within your network.
Device Detail Window

Click the device to view details. The displayed window has these three tabs:
Figure 1. Details of a Device in Overview, History, and Accuracy Test Tabs

Procedure


You can access this window with details of a device in any of the following ways:

  • Global search: Search for a device from the dashboard and click the device from the search results. See the Global Search article.
  • Device toolbar:  From the toolbar on top of the dashboard, choose the device type of this device. This opens a table of devices, and you can choose a device to open the details.
  • Floor map: Find the specific device on the map and click to view details.

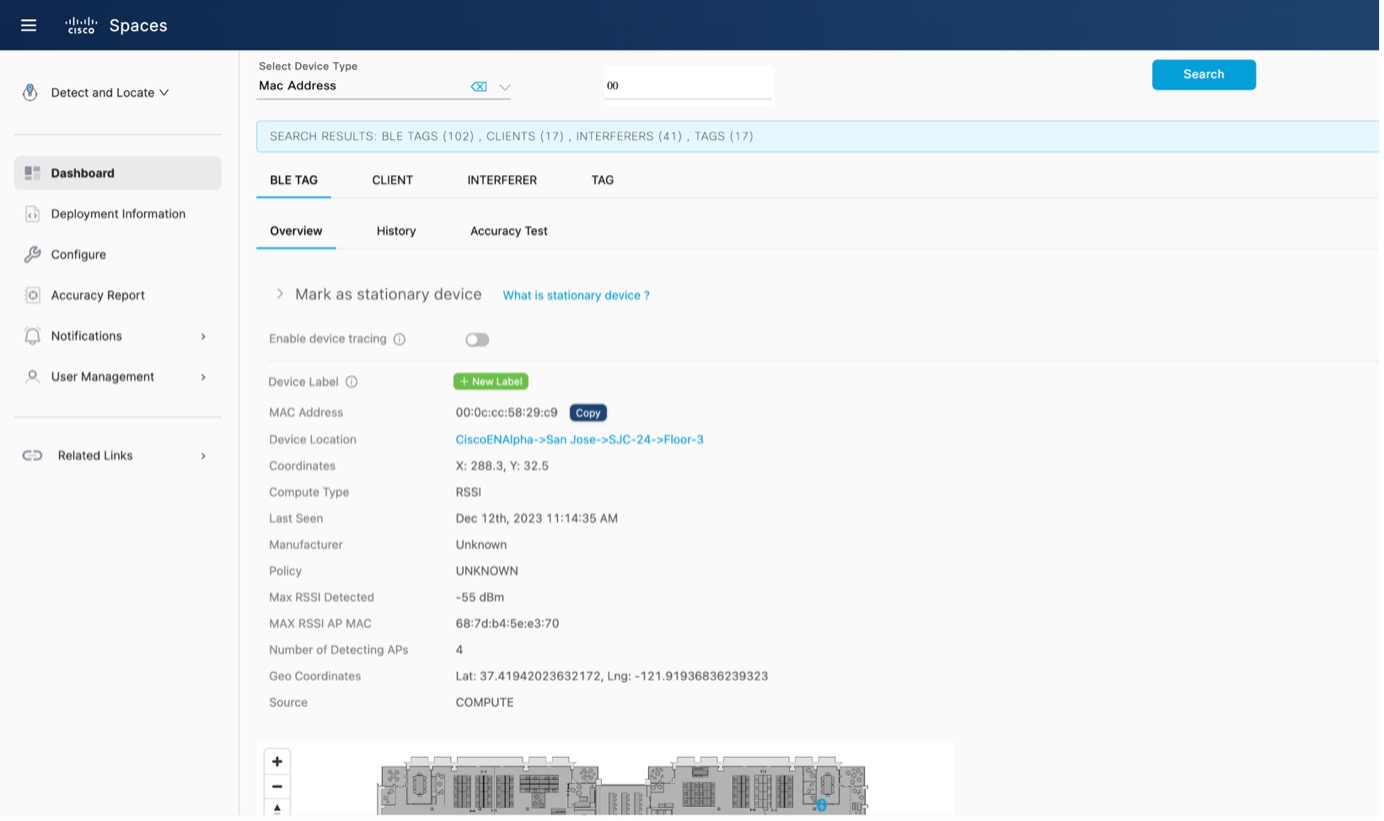
Overview Tab

The Overview tab provides details of the device. You can access this tab from the device's detail window.

Figure 2. Overview Tab

You can do the following on the Overview tab:

  • Mark as stationary device: Expand this arrow to mark the device as stationary.

  • Enable device tracing: Toggle this button to initiate MAC debugging for this device.

  • Device Label:  Add, edit, or delete the device label.

  • Device Location: Click this link to navigate to the device’s location on the map.

History Tab

Devices With Location History Records

Detect and Locate provides location history records for only four device types:

  • Clients

  • Tags

  • BLE tags, and

  • Rogue clients.

Four Device Location History Representations

This section demonstrates the various ways in which a device's location history is represented in Detect and Locate.

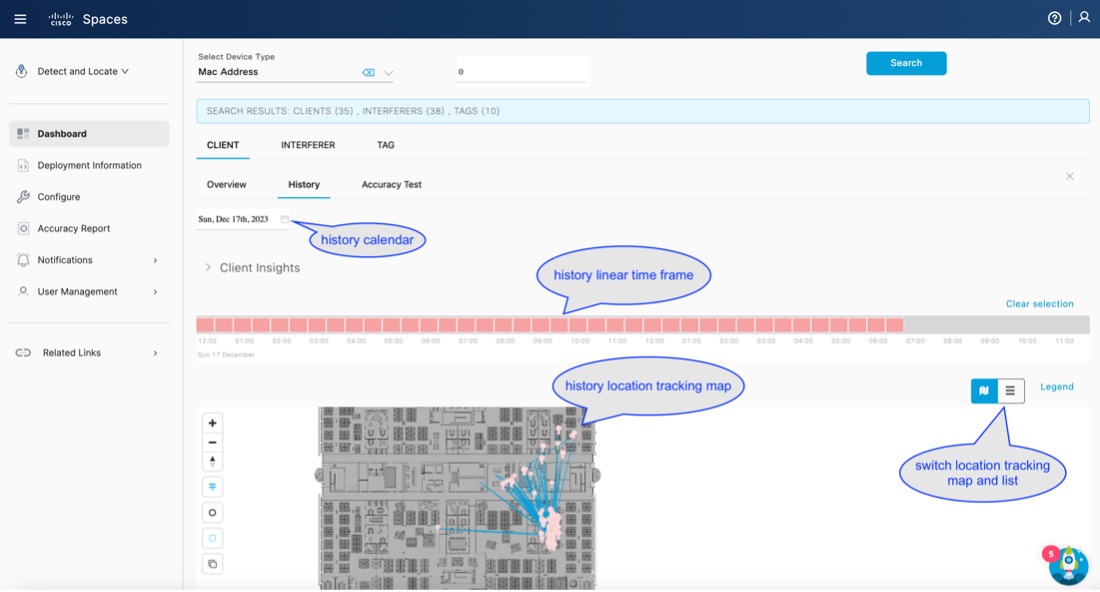
To view the location history of a device, click the device and in the device details window, select the History tab. Here you can see insights related to this device and the device's locations plotted over the preceding twenty-four hours (if the device was detected during this period). The location history of a client is represented in the following different forms:

  • Linear Time Frame: is a graphical representation of a client's location history. The linear time frame consists of color-coded blocks on a bar that indicate the device's activity status over the last 24 hours.

  • Map or List: are two methods of displaying changes in a device's location, either visually on a map or in a table form with coordinates and event times.

  • Calendar:  allows users to select a day from the past 30 days to view the device's location history. Only the data for that specific day are updated on the linear time frame and the map or list.

  • Client Insights: are a summary of key data points of a device's location history, including first-seen time, last-seen time, total number of location changes, and total active time.

Each of these device history representations is described in detail in this article.

Linear Time Frame

The linear time frame is a graphical representation of a device's location history. You can observe the linear time frame from the History tab of a device's details window.

The linear time frame is a long bar indicating a device's activity status over the last 24 hours. This bar is subdivided into one-hour blocks that are color coded to indicate activity.

Figure 3. Linear Time Frame

The colour codes of these one-hour blocks are

  • Green, indicating that the device was associated with the network

  • Red, indicating that the device was only probing and not associated with the network, and

  • Grey, indicating that the device was not detected.

You can zoom in and out of the linear time frame.

When you click on a particular block, you select the hour. You can observe that the map or list (below this linear time frame) is updated to represent the device's movements for the hour. You can learn more about this from Maps and Lists.

Maps and Lists

Maps and lists are graphical representations of a device's location history and are found in the History tab of a device's details. Clicking a block in the linear time frame of the History tab updates the map or list. You can click the map or list icons on the right to choose between the two:

  • Maps: have pink dots to represent the device's location on the map, and blue lines to indicate the path traversed by the device.

    Figure 4. Map Showing a Device's Location History
  • List: is a table including the device's location details such as X-Y coordinates and the corresponding time of detection seen in the Event Time column.

    Figure 5. List Showing a Device's Location History
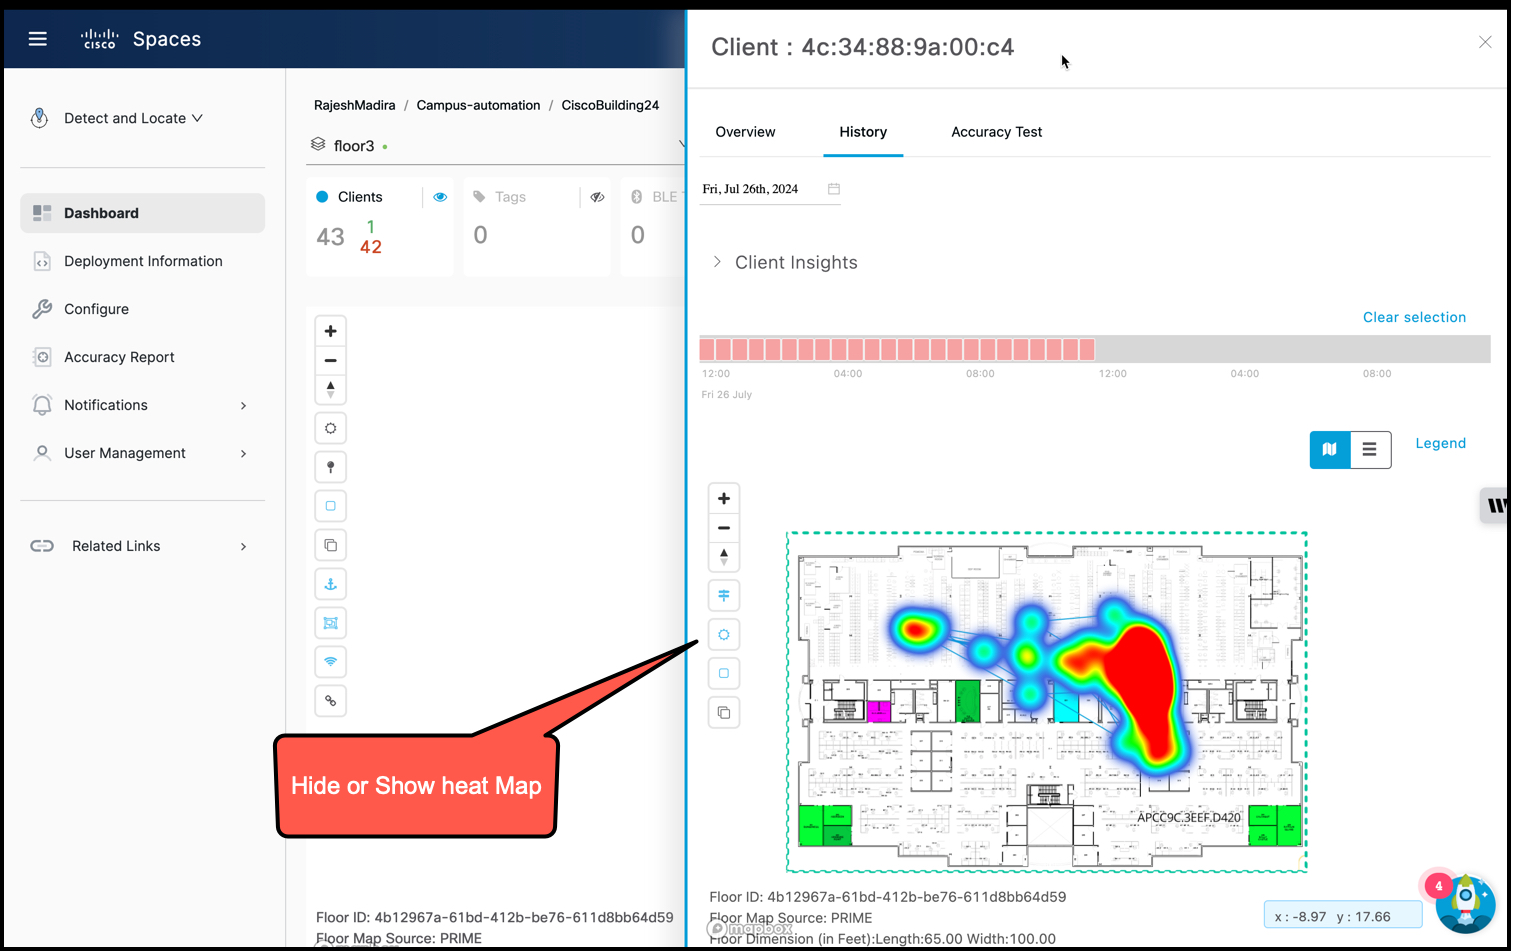
Heat Map

A heat map is a visual representation that plots the location chirps of a device and highlights the areas where the device has traveled.

A heat map helps you identify suspicious activity or track missing equipment by providing you exact locations.

Figure 6. Heatmap of a Device
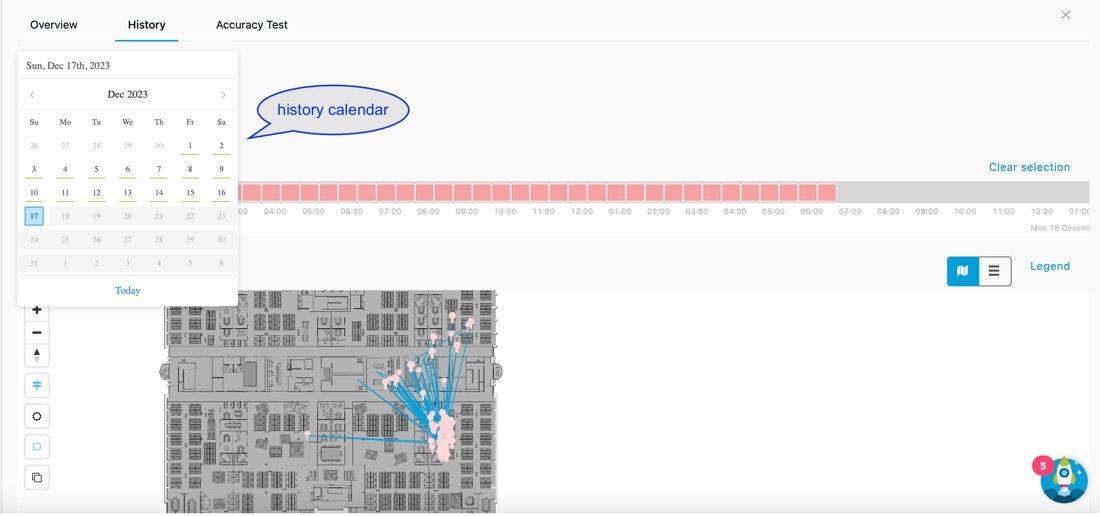
Calendar

A 30-day calendar helps you observe the location history of a device for the preceding 30 days.

Figure 7. Calendar Showing 30-Day Location History of a Device

You can open this calendar by clicking the calendar icon at the top left of the History tab of a device's details window.

Choose a specific date on the calendar, and observe how the following are updated to represent the device's location data for that particular date:

  • Linear time frame, and

  • Maps or lists.

The calendar contains data for 30 days before the current date only. Visual indicators used to reflect the availability of historical records are

  • dates with a green line underneath which have active history records, and

  • dates without a green line which lack history records for that day.

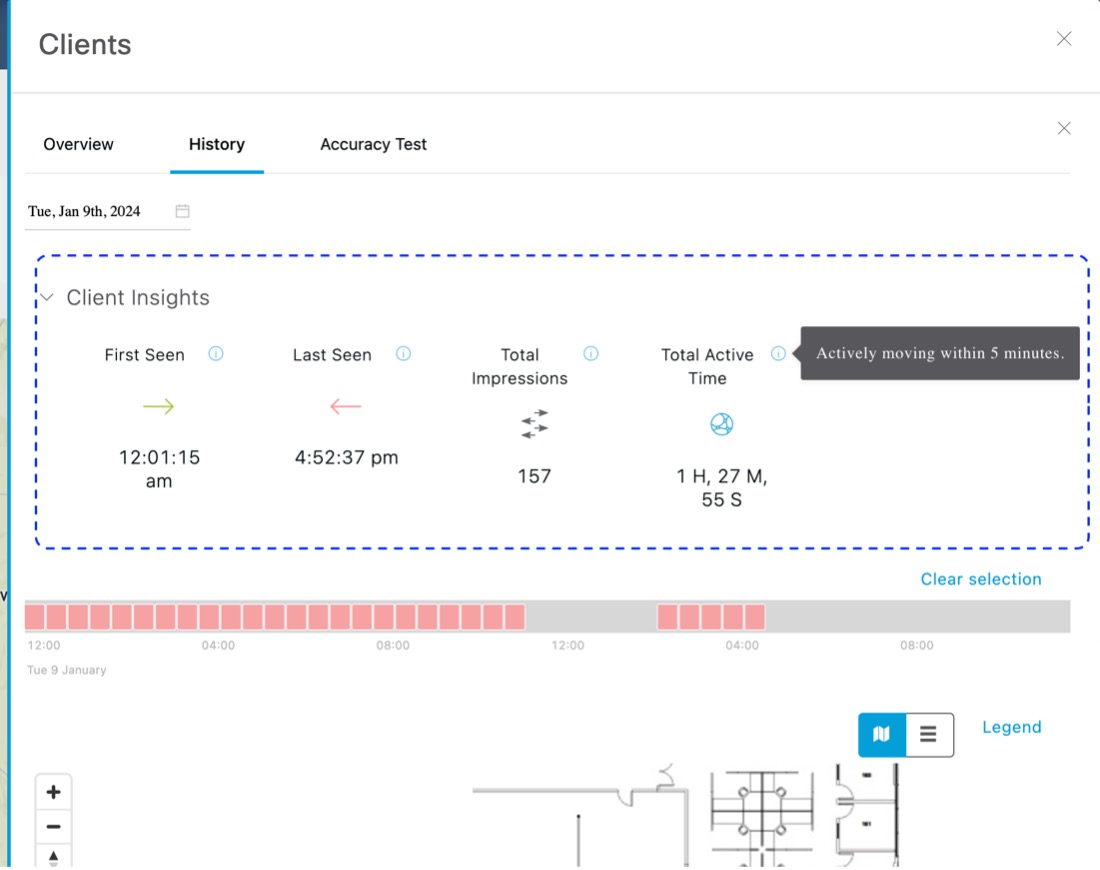
Client Insights

Client insights are a summary of key data points of a device's location history:

Figure 8. Client Insights: Key Data Points of a Device's Location History
  • First Seen: is the time and date when the wireless controller first detected the device within a specific period.

    Note


    • If the client stays connected for over a week, the First Seen time is when the client was first detected that week. For example, assume the day is Friday, and the client was first detected last Monday at 8:00 am, after which the client stayed connected the entire week. The First Seen as checked on Friday, would show as Monday, 8:00 AM.

    • If the client connects and disconnects over the week, the First Seen would be the first time the client connected on the last day of connection. For example, assume the day is Friday, and the client connected at 8:00 am on Monday, Wednesday, and Friday. The First Seen as checked on Friday would show as Friday, 8:00 AM.


  • Last Seen: is the time and date of the device's most recent appearance in the records.

  • Total Impressions: is the number of times the device's location has changed.

  • Total Active Time: is the duration that the device has been moving actively within the last five minutes.