New Features in Cisco Catalyst IW Access Points, Release 17.12.1

The following URWB features are introduced in the release 17.12.1:

Enabling and Disabling Wired Interface

This feature allows wire interfaces to be disabled. It is not possible to disable both wire interfaces at the same time. Enable the wired interface configuration using CLI.

Enabling or disabling wired interface using CLI

To enable or disable specific wired interface, use the following CLI command:
Device# configure wired <0-1>
                 disabled disable wired interface
                 enabled enable wired interface
Example:
Device# configure wired 0 disabled
         Device# configure wired 1 enabled
         Device# write
         Device# reload

Error handling configuration

The following CLI commands shows the error when both interfaces are configured as disable mode:
Device # configure wired 0 disabled
         Device# configure wired 1 disabled
         ERROR: Interface wired0 is disabled, cannot disable both interfaces

Verifying enabling and disabling wired interface using CLI

To verify enable or disable state of wired interface, use the following show command:

Device# #show wired <0-1> config

Example:

Device# show wired 0 config
         WIRED0 status: enabled
Device# show wired 1 config
         WIRED1 status: disabled

Configuring Maximum Transmission Unit Settings

The maximum frame size that can be transported across the URWB network can be configured. This setting must be configured on every access point in the URWB network.

Configuring MTU setting using CLI

The following CLI command used for changing MTU value for wired interfaces:

Device# configure wired mtu
         <1530-1600> Unsigned integer set wired mtu
Example:
Device# configure wired mtu 1600 
Device# write
Device# reload

Verifying MTU setting using CLI

To verify the MTU value for wired interfaces, use the following show command:

Device# show wired mtu
Example:
Device# show wired mtu
         Configured MTU: 1600

Configuring Fluidity Coloring

Fluidity Colouring enables wayside or outside devices (Fluidity infrastructure devices) to be given certain colour codes to enhance or drive the handoff process and with the standard configuration handoff decision is made based on RSSI (Received Signal Strength Indication).

Typical use case: When a train is travelling one side of the track in one direction (metro line with single tunnel for both track directions) and does not need to connect to the Access Point located on the opposite side of the tunnel, so mark the access point on each side with a different colour to prevent occasional handovers to infrastructure units on the opposite track.

Fluidity Coloring Logic

The following image explains the Fluidity coloring logic and painter is a key role for wayside or outside device (Fluidity infrastructure device):

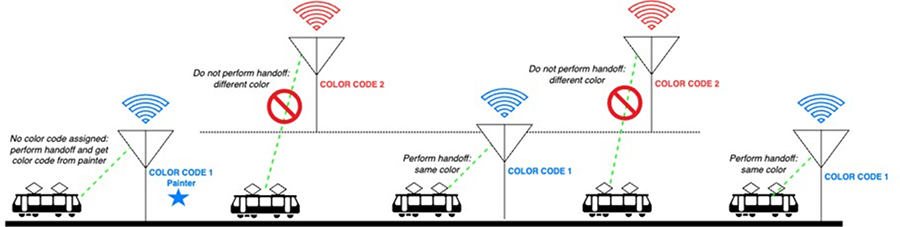
The process of Fluidity coloring as follows:
  • According to the colour code, painter notifies the Fluidity vehicle device which Fluidity infrastructure devices are suitable for the handoff.

  • The Fluidity vehicle device ignores the colour settings and continues to use the standard handoff mechanism (based on RSSI level) until it detects a painter.

  • The moment the Fluidity vehicle device completes the handoff on a Fluidity infrastructure device with the painter configuration, it starts only considering Fluidity infrastructure devices with the same colour code or other painters Fluidity infrastructure devices.

  • Multiple Fluidity infrastructure devices acting as painters are allowed.

The following table explains the Fluidity color role and its corresponding options:

Table 1. Fluidity Coloring Role

Fluidity Coloring Role

Options

Wayside painter (Fluidity infstrastructure device)

Only one color code can be assigned to a Fluidity infstrastructure device configured as a painter

Wayside standard (Fluidity infstrastructure device)

A non-painter Fluidity infstrastructure device can be configured with multiple color codes

Fluidity vehicle

Only one color can be assigned to Fluidity vehicle device

Configuring Fluidity Coloring using CLI

To configure a fluidity color mode, use the following CLI command:
Device# configure fluidity color mode
                 Disabled: disable coloring
                 Enabled: enable coloring
Device# configure fluidity color value
WORD quoted list of colors from 1 to 7 or "p X" for painter (e.g. "1 2 6","4", "p 1"). "clear" to reset
Example (painter):
Device# configure fluidity color mode enabled
Device# configure fluidity color value "p 1"
Device# write
Device# reload
Example (non-painter):
Device# configure fluidity color mode enabled
Device# configure fluidity color value "3 4 5"
Device# write
Devie# reload
Example (clear):
Device# configure fluidity color value clear
Device# write
Device# reload

Verifying Fluidity Coloring using CLI

To verify a fluidity color mode, use the following CLI command:
Device# #show fluidity config
Example (painter):
Device# show fluidity config
                 ...
                 Color: enabled, current: p 1
                 ...
Example (non-painter):
Device# show fluidity config
                 ...
                 Color: enabled, current: 3 4 5
                 ...
Example (clear):
Device# show fluidity config
                 ...
                 Color: enabled, current: 0
                 ...

Configuring Fluidity Coloring RSSI Threshold

The Fluidity vehicle device temporarily ignore the Fluidity colouring settings if there is a coverage hole and the current RSSI is less than the configured RSSI threshold. In this case, the Fluidity vehicle device keep it's Fluidity colouring settings and ignores them until it receives a handoff from a Fluidity infrastructure device that has the current colour code. The Fluidity vehicle device reset it's Fluidity colouring settings to the default value (no colour) after four consecutive handoffs on a Fluidity infrastructure device with colour codes different from the present value.

Configuring Fluidity Coloring RSSI Threshold using CLI

Device# configure fluidity color rssi-threshold
         <0-96> COLOR_RSSI_THRESHOLD

Example:

Device# configure fluidity color rssi-threshold 55
Device# write
Device# reload

Verifying Fluidity Coloring RSSI Threshold using CLI

Device# show fluidity config

Example:

Device# show fluidity config
                 ...
                 Color: enabled, current: 0
                 Color min RSSI threshold: 55

Configuring IW Monitor Management

The URWB release 17.12.1 introduces support for IW Monitor. It is a stand-alone on-premise monitoring application supporting the following features:

Table 2. IW Monitor features support in release 17.12.1

Feature

Description

IW Monitor log for RADIUS (Remote Authentication Dial-In User Service)

Radius authentication attempts by mobile units are logged to IW Monitor

IW Monitor log CLI SSH access

SSH connections attempts are logged to IW Monitor

IW Monitor log Web UI access

Web UI logins are logged to IW Monitor

IW Monitor log ethernet link change

Physical link changes of LAN ports are buffered and logged to IW Monitor

IW Monitor log configuration change

Changes applied to the unit configuration through CLI or Web UI are logged to Monitor

The on-premises IW Monitor supports the following primary capabilities:
  • Dashboard to monitor network status.

  • Topology view of the network.

  • Real time and history charts for wireless KPIS (Key Performance Indicators).

  • Real time performance monitoring.

  • Process the telemetry data sent by IW devices.

  • Network events logging.

Release 17.12.1 provides following support for IW Monitor dashboard:
  • Attach and detach functions.

  • Telemetry protocol support.

  • CLI and Web UI management.

Detaching IW Monitor Management using CLI

IW Monitor doesn't require any configuration, and access points are added to the IW Monitor. Use the following CLI to detach the device from the IW Monitor server and troubleshoot the connection.

Device# configure monitor
         detach : detach MONITOR action

Example:

Device# configure monitor detach

Verifying IW Monitor Management using CLI

To verify a monitor management, use the following show command:

Device# show monitor
Example:
Device# show monitor
IW MONITOR: enabled
Status: Connected

Configuring IW Monitor Management using Web UI

The following image shows the IW MONITOR option is activated or enabled in the Cisco URWB IW9165E or IW9167E Configurator window to configure a IW Monitor management:

After enabling IW-MONITOR option, you can see IW-MONITOR connection info as shown in the following image:

Configuring URWB Telemetry Protocol

The URWB Telemetry Protocol allows for custom external monitoring of real-time wireless performance. Third-party and custom applications can be written to use this data. Pre-defined structured UDP packets sent at regular intervals contain various network metrics. Each access point exports data for its radios.

Each access point exports data for its radios. This data can be interpreted live by the receiving application or captured and processed later.

For more information about the protocol format, contact Cisco Support to request URWB Telemetry Protocol reference document..

The telemetry UDP packet contains the following information:
  • Signal strength of packet.

  • Packet throughput and migration rate.

  • Number of transmission and retransmission.

  • Modulation rate.

  • Details of packet loss.

  • Operating frequency of each radio.

  • Information about the events that recording the network.

Configuration of URWB Telemetry Protocol Using CLI

By default, the telemetry data is disabled. To generate the telemetry packet, use the following CLI command:

To set the IP address and UDP port of the receiver, use the following CLI command (Multicast addresses are supported):

Device# configure telemetry server <dest IP [port]>
To enable or disable the URWB Telemetry Protocol transmission to the configured receiver, use the following CLI command (multicast addresses are supported):
Device# configure telemetry server <dest IP [port]>
To enable or disable raw UDP telemetry transmission to the configured server, use the following CLI command:
Device# configure telemetry export [ enable | disable ]
Example:
Device# configure telemetry export enable
Device # configure telemetry server 10.115.11.56 1234
Device # write
Device # reload

Note


  • Make sure the IP address is configured before executing the export enable CLI command. If not, the command rejects with an error please configure the telemetry server IP first.

  • The IP server is simultaneously set to 0.0.0.0 (the port value is unchanged) when you execute the export disable CLI command.


To verify telemetry configuration, use the following CLI command:
Device# show telemetry config
Telemetry export: enabled, current (live): disabled
Telemetry server: 10.115.11.56 1234, current (live): 0.0.0.0 30000

Live Configuration of URWB Telemetry Protocol Using CLI

Device# configure telemetry live
Export : enable/disable telemetry export
Server : set telemetry server IP address (and port)

Server configuration is mandatory before you enable the live telemetry export.

Example:
Device# configure telemetry live export enable
Error: please configure the telemetry server IP first
Example (telemetry export after server configuration):
Device# configure telemetry live server 10.115.11.56 1234
Device # configure telemetry live export enable
Device # show telemetry config
Telemetry export: enabled, current (live): enabled
Telemetry server: 10.115.11.56 1234, current (live): 10.115.11.56 1234

Note


The command immediately affects the current configuration when the live modifier is specified. If live modifier is not used, only the configuration file is changed.