Traffic Flow Monitoring

Traffic Flow Monitoring

Table 1. Feature History

Feature Name

Release Information

Description

Flexible NetFlow Support for IPv6 and Cache Size Modification

Cisco IOS XE Catalyst SD-WAN Release 17.4.1a

Cisco vManage Release 20.4.1

This feature enables export of packets to an external collector over an IPv6 transport on Cisco IOS XE Catalyst SD-WAN devices and provides the visibility of IPv6 network traffic. If you want to monitor IPv4 and IPv6 traffic together, this feature enables you to modify the cache size on the data plane. Cisco Flexible NetFlow (FNF) is a technology that provides customized visibility into network traffic. In Cisco Catalyst SD-WAN, FNF enables exporting data to Cisco SD-WAN Manager which makes it easy for the customers to monitor and improve their network.

Log Packets Dropped by Implicit ACL

Cisco IOS XE Catalyst SD-WAN Release 17.5.1a

Cisco vManage Release 20.5.1

You can now enable or disable logging of dropped packets in case of a link failure. You can also configure how often the packet flows are logged.

Flexible NetFlow Enhancement

Cisco IOS XE Catalyst SD-WAN Release 17.6.1a

Cisco vManage Release 20.6.1

This feature enhances Flexible NetFlow to collect type of service (ToS), sampler ID, and remarked DSCP values in NetFlow records. This enhancement provides the flexibility to define flow record fields to customize flow records by defining flow record fields. The ToS and remarked DSCP fields are supported only on IPv4 records. However, the sampler ID field is supported for both IPv4 and IPv6 records.

Flexible NetFlow for VPN0 Interface

Cisco IOS XE Catalyst SD-WAN Release 17.7.1a

Cisco vManage Release 20.7.1

This feature supports NetFlow on VPN0 interfaces.

Flexible NetFlow acts as a security tool, enables export of data to Cisco SD-WAN Manager, detects attacks on devices, and monitors traffic.

Flexible NetFlow Export Spreading

Cisco IOS XE Catalyst SD-WAN Release 17.9.1a

Cisco Catalyst SD-WAN Control Components Release 20.9.x

Cisco vManage Release 20.9.1

This feature enables export spreading to prevent export storms that occur when a burst of packets are sent to external collector. The export of the previous interval is spread during the current interval to prevent export storms. When NetFlow packets are sent over a low-bandwidth circuit, the export spreading functionality is enabled to avoid packet drops.

Flexible NetFlow Export of BFD Metrics

Cisco IOS XE Catalyst SD-WAN Release 17.10.1a

Cisco Catalyst SD-WAN Control Components Release 20.10.1

With this feature, you can export Bidirectional Forwarding Detection (BFD) metrics to an external collector for generating BFD metrics of loss, latency, and jitter. This feature provides enhanced monitoring and faster collection of network state data.

After you enable export of BFD metrics, configure an export interval for exporting the BFD metrics.

Real-Time Device Options for Monitoring Cflowd and SAIE Flows

Cisco IOS XE Catalyst SD-WAN Release 17.10.1a

Cisco vManage Release 20.10.1

With this feature, you can apply filters for monitoring specific Cflowd and Cisco Catalyst SD-WAN Application Intelligence Engine (SAIE) applications or application families running within a VPN on the selected Cisco IOS XE Catalyst SD-WAN device.

Real-time device options for monitoring Cflowd and SAIE flows are available on Cisco vEdge devices. This release provides support for real-time device options for monitoring Cflowd and SAIE applications on Cisco IOS XE Catalyst SD-WAN devices.

Enhancements to Flexible NetFlow for Cisco SD-WAN Analytics

Cisco IOS XE Catalyst SD-WAN Release 17.12.1a

Cisco Catalyst SD-WAN Manager Release 20.12.1

This feature introduces logging enhancements to Cisco Flexible NetFlow for IPv4 and IPv6 flow records in Cisco SD-WAN Analytics.

The output of the show flow record command has been enhanced for these records.

Flow Telemetry Enhancement When Using Loopbacks as TLOCs.

Cisco IOS XE Catalyst SD-WAN Release 17.12.1a

Cisco Catalyst SD-WAN Manager Release 20.12.1

When you configure a loopback interface as an ingress or egress transport interface, this feature enables you to collect loopback instead of physical interface in FNF records. This feature is supported for IPv4 and IPv6.

Updated the show command show sdwan control local-properties wan-interface-list to display the binding relationship between the loopback and physical interfaces.

A new column Bind Interface is added to the existing option, Monitor > Devices > Real Time (choose the device option, Control WAN Interface Information) in Cisco SD-WAN Manager to display the binding relationship between the loopback and physical interfaces.

Configure a Maximum FNF Record Rate for Aggregated Traffic Data

Cisco IOS XE Catalyst SD-WAN Release 17.14.1a

Cisco Catalyst SD-WAN Control Components Release 20.14.1

For a device, you can configure a maximum rate (records per minute) for sending Flexible NetFlow (FNF) records of aggregated traffic data. This can reduce the performance demands on a device, and may be helpful when there is a large number of applications producing network traffic.

Information About Traffic Flow Monitoring

The following sections describe traffic flow monitoring.

Traffic Flow Monitoring with Cflowd Overview

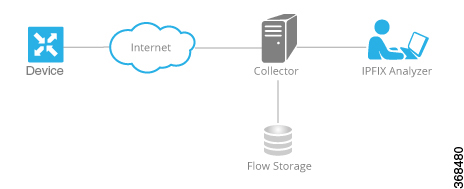
Cflowd is a flow analysis tool, used for analyzing Flexible NetFlow (FNF) traffic data. It monitors traffic flowing through Cisco IOS XE Catalyst SD-WAN devices in the overlay network and exports flow information to a collector, where it can be processed by an IP Flow Information Export (IPFIX) analyzer. For a traffic flow, Cflowd periodically sends template reports to flow collector. These reports contain information about the flows and the data is extracted from the payload of these reports.

You can create a Cflowd template that defines the location of Cflowd collectors, how often sets of sampled flows are sent to the collectors, and how often the template is sent to the collectors (on Cisco SD-WAN Controllers and on Cisco SD-WAN Manager). You can configure a maximum of four Cflowd collectors per Cisco IOS XE Catalyst SD-WAN device. To have a Cflowd template take effect, apply it with the appropriate data policy.

You must configure at least one Cflowd template, but it need not contain any parameters. With no parameters, the data flow cache on the nodes is managed using default settings, and no flow export occurs.

Cflowd traffic flow monitoring is equivalent to FNF.

The Cflowd software implements Cflowd version 10, as specified in RFC 7011 and RFC 7012. Cflowd version 10 is also called the IP Flow Information Export (IPFIX) protocol.

Cflowd performs 1:1 sampling. Information about all flows is aggregated in the Cflowd records; flows are not sampled. Cisco IOS XE Catalyst SD-WAN devices do not cache any of the records that are exported to a collector.


Note


NetFlow on Secure Internet Gateway (SIG) tunnels is not supported on Cisco IOS XE Catalyst SD-WAN devices.


Cflowd and SNMP Comparison

Cflowd monitors service side traffic. Cflowd mainly monitors traffic from LAN to WAN, WAN to LAN, LAN to LAN and DIA. If you use Cflowd and SNMP to monitor traffic of LAN interface (input or output), then packets and bytes should be similar. The difference of bytes in SNMP starts from L2 header, but Cflowd starts from L3 header. However, if we use Cflowd and SNMP to monitor traffic of WAN interface (input or output), then packets or bytes are unlikely to be the same. All the traffic of WAN interfaces is not service side traffic. For example, Cflowd does not monitor BFD traffic, but SNMP does. The packets or bytes of Cflowd and SNMP traffic are not the same.

IPFIX Information Elements for Cisco IOS XE Catalyst SD-WAN Devices

The Cisco Catalyst SD-WAN Cflowd software exports the following IP Flow Information Export (IPFIX) information elements to the Cflowd collector. Fields vary depending on the release that you are on. Common fields are exported to Cisco SD-WAN Manager and external exporters. Feature fields are exported only to Cisco SD-WAN Manager.

Before Cisco IOS XE Catalyst SD-WAN Release 17.2.1r, Flexible NetFlow exports all fields to external collectors and Cisco SD-WAN Manager. Starting from Cisco IOS XE Catalyst SD-WAN Release 17.2.1r, FNF exports the elements (that are marked yes) in the following table to both external collectors and Cisco SD-WAN Manager. Other fields like drop cause id are for specific features and these fields are exported only to Cisco SD-WAN Manager, but not to an external collector.

Information Element

Element ID

Exported to External Collector

Description

Data Type

Data Type Semantics

Units or Range

sourceIPv4Address

8

Yes

IPv4 source address in the IP packet header.

ipv4Address (4 bytes)

default

sourceIPv6Address

27

Yes

IPv6 source address in the IP packet header.

ipv6Address (16 bytes)

default

destinationIPv4Address

12

Yes

IPv4 destination address in the IP packet header.

IPv4Address (4 bytes)

default

destinationIPv6Address

28

Yes

IPv6 destination address in the IP packet header.

ipv6Address (16 bytes)

default

ingressInterface

10

Yes

Index of the IP interface where packets of this flow are being received.

unsigned32 (4 bytes)

identifier

ipDiffServCodePoint

195

Yes

Value of a Differentiated Services Code Point (DSCP) encoded in the Differentiated Services field. This field spans the most significant 6 bits of the IPv4 TOS field.

unsigned8 (1 byte)

identifier

0 through 63

protocolIdentifier

4

Yes

Value of the protocol number in the Protocol field of the IP packet header. The protocol number identifies the IP packet payload type. Protocol numbers are defined in the IANA Protocol Numbers registry.

unsigned8 (1 byte)

identifier

sourceTransportPort

7

Yes

Source port identifier in the transport header. For the transport protocols UDP, TCP, and SCTP, this is the destination port number given in the respective header. For GRE and IPsec flows, the value of this field is 0.

unsigned16 (2 bytes)

identifier

destinationTransportPort

11

Yes

Destination port identifier in the transport header. For the transport protocols UDP, TCP, and SCTP, this is the destination port number given in the respective header.

unsigned16 (2 bytes)

identifier

tcpControlBits

6

Yes

TCP control bits observed for the packets of this flow. This information is encoded as a bit field; each TCP control bit has a bit in this set. The bit is set to 1 if any observed packet of this flow has the corresponding TCP control bit set to 1. Otherwise, the bit is set to 0. For values of this field, see the IANA IPFIX web page.

unsigned8 (1 byte)

identifier

flowEndReason

136

Yes

Reason for the flow termination. For values of this field, see the IANA IPFIX web page.

unsigned8 (1 byte)

identifier

ingressoverlaysessionid

12432

Yes

A 32-bit identifier for input overlay session id.

unsigned32 (4 bytes)

identifier

VPN Identifier

Enterprise specific

Yes

Cisco IOS XE Catalyst SD-WAN device VPN identifier. The device uses the enterprise ID for VIP_IANA_ENUM or 41916, and the VPN element ID is 4321.

unsigned32 (4 bytes)

identifier

0 through 65535

connection id long

12441

Yes

A 64-bit identifier for a connection between client and server.

Unsigned64 (8 bytes)

identifier

application id

95

Yes

A 32 bit identifier for an application name

unsigned32 (4 bytes)

identifier

egressInterface

14

Yes

Index of the IP interface where packets of this flow are being sent.

unsigned32 (4 bytes)

default

egressoverlaysessionid

12433

Yes

A 32-bit identifier for output overlay session id.

unsigned32 (4 bytes)

identifier

sdwan qos-queue-id

12446

No

Queue index for QoS.

unsigned8 (1 byte)

identifier

drop cause id

12442

No

A 16-bit identifier for a drop cause name.

unsigned16 (2 bytes)

identifier

counter bytes sdwan dropped long

12443

No

Total number of dropped octets in incoming packets for this flow at the observation point since initialization or re-initialization of the metering process for the observation point.

The count includes the IP heads and the IP payload.

unsigned64 (8 bytes)

totalCounter

Octets

sdwan sla-not-met

12444

No

A Boolean to indicate if required SLA is met or not.

unsigned8 (1 byte)

identifier

sdwan preferred-color-not-met

12445

No

A Boolean to indicate if preferred color is met or not.

unsigned8 (1 byte)

identifier

counter packets sdwan dropped long

42329

No

Total number of dropped packets in incoming packets for this flow at the observation point since initialization or re-initialization of the metering process for the observation point.

unsigned64 (8 bytes)

totalCounter

Packets

octetDeltaCount

1

Yes

Number of octets since the previous report in incoming packets for this flow at the observation point. This number includes IP headers and IP payload.

unsigned64 (8 bytes)

deltaCounter

Octets

packetDeltaCount

2

Yes

Number of incoming packets since the previous report for this flow at this observation point.

unsigned64 (8 bytes)

deltaCounter

Packets

flowStartMilliseconds

152

Yes

Absolute timestamp of the first packet of this flow.

dateTime-MilliSeconds (8 bytes)

flowEndMilliseconds

153

Yes

Absolute timestamp of the last packet of this flow.

dateTime-MilliSeconds (8 bytes)

ip tos

5

Yes

The Type of Service field in the IP header.

unsigned8 (1 byte)

identifier

8 bits

dscp output

98

Yes

Value of a DSCP encoded in the Differentiated Services field. This field spans the most significant 6 bits of the IPv4 TOS field.

unsigned8 (1 byte)

identifier

0 through 63

flow sampler

48

Yes

A set of properties that are defined in a Netflow sampler map that are applied to at least one physical interface

unsigned8 (1 byte)

identifier

bfd avg latency

45296

Yes

Calculation of the Bidirectional Forwarding Detection (BFD) average latency for each tunnel

unsigned64 (8 bytes)

identifier

bfd avg loss

45295

Yes

Calculation of the BFD average loss for each tunnel

unsigned64 (8 bytes)

identifier

bfd avg jitter

45297

Yes

Calculation of the BFD average jitter for each tunnel

unsigned64 (8 bytes)

identifier

bfd rx cnt

45299

Yes

Count of received BFD packets

unsigned64 (8 bytes)

deltaCounter

bfd tx cnt

45300

Yes

Count of transmitted BFD packets

unsigned64 (8 bytes)

deltaCounter

bfd rx octets

45304

Yes

Count of received BFD octets

unsigned64 (8 bytes)

deltaCounter

bfd tx octets

45305

Yes

Count of transmitted BFD octets

unsigned64 (8 bytes)

deltaCounter

application_CATEGORY

12232

Yes

Application category name, first level categorization for each application tag

varibale length

identifier

application_SUB_CATEGORY

12233

Yes

Application sub category name, second level categorization for each application tag

varibale length

identifier

applicaiton_GROUP

12234

Yes

Application group name, groups multiple app tags that belong to the same application

varibale length

identifier

application traffic-class

12243

Yes

Application traffic-class according to SRND model

varibale length

identifier

application business-relevance

12244

Yes

Application business-relevance

varibale length

identifier

Flexible Netflow for VPN0 Interface

From Cisco IOS XE Catalyst SD-WAN Release 17.7.1a, you can enable FNF for bidirectional traffic visibility on a VPN0 interface of a Cisco IOS XE Catalyst SD-WAN device.

Netflow provides statistics on packets flowing through the device and helps to identify the tunnel or service VPNs. Flexible Netflow on VPN0 provides visibility for all the traffic (both ingress and egress) hitting VPN0 on Cisco IOS XE SD-WAN devices.

A profile is a predefined set of traffic that you can enable or disable for a context. You can create an Easy Performance Monitor (ezPM) profile that provides an express method of provisioning monitors. This new mechanism adds functionality and does not affect the existing methods for provisioning monitors. As part of this feature, you can create sdwan-fnf profile to monitor traffic passing through netflow VPN0 configuration.

A context represents a performance monitor policy map that is attached to an interface in ingress and egress directions. A context contains the information about the traffic-monitor that has to be enabled. When a context is attached to an interface, two policy-maps are created, one each in ingress and egress directions. Depending on the direction specified in the traffic monitor, the policy-maps are attached in that direction and the traffic is monitored. You can modify the context to override pre-defined directions.

You can create multiple contexts based on a single profile with different traffic monitors, different exporters, and different parameters for every selected traffic monitor. An ezPM context can be attached to multiple interfaces. Only one context can be attached to an interface.

Table 2. Flexible Netflow Components

Cisco Catalyst SD-WAN Flexible Netflow

Cisco SD-WAN Flexible Netflow VPN0 from Cisco vManage Release 20.7.1

Configuration

Localized Policy: app-visibility or flow-visibility

Centralized policy: cflowd policy

Supported on both Cisco SD-WAN Manager feature template and CLI template/

Define Flexible Netflow VPN0 monitor using command performance monitor context xxx profile sdwan-fnf and attach on VPN0 interface.

Supported on CLI template and add-on CLI feature template in Cisco SD-WAN Manager.

Interface

Cisco Catalyst SD-WAN tunnel interface and service VPN interface

VPN0 interface except Cisco Catalyst SD-WAN tunnel and VPN interface

Flow Records

Fixed records by default.

Supports dynamic monitoring for records such as, FEC, packet duplication, SSL proxy and so on. Also supports collecting type of service (ToS), sampler ID and remarked DSCP values for centralized policies.

Fixed records. You cannot modify or add new fields.

Flow Direction

Supports only ingress flows

Supports both ingress and egress by default.

NBAR for APP

Network-based Application recognition (NBAR) is enabled only when app-visibility is defined.

NBAR is enabled by default.

Exporter

JSON file to Cisco SD-WAN Manager and IPFIX to external collector

Can’t export to Cisco SD-WAN Manager

IPFIX to external collectors

Limitations of Flexible Netflow on VPN0 Interface

  • Flexible Netflow on VPN0 is not supported on Cisco Catalyst SD-WAN tunnel and Cisco Catalyst SD-WAN VPN interfaces.

  • The FNF record for VPN0 traffic is a fixed record and cannot be modified.

  • Cisco Catalyst SD-WAN VPN0 flow entries are reported to external collectors defined in CLI configuration and not to Cisco SD-WAN Manager.

  • Cisco Catalyst SD-WAN BFD and Cisco Catalyst SD-WAN control connections such as OMP, Netconf, and SSH are encapsulated by Datagram Transport Layer Security (DTLS) or Transport Layer Security (TLS) tunnels. FNF reports on only the DTLS traffic and not the encapsulated protocol packets.

  • When FNF is configured for a VPN0 WAN interface,

    • For ingress flows (WAN > Cisco Catalyst SD-WAN-tunnel > LAN) - the output interface is reported as NULL.

    • For egress flows (LAN > Cisco Catalyst SD-WAN-tunnel > WAN) - input interface is reported as WAN interface (Cisco Catalyst SD-WAN underlay tunnels).

  • VPN0 monitor supports only IPv4 and IPv6 protocols.

  • For routing protocols, such as OSPF, BGP, only egress traffic is supported. Ingress OSPF and BGP traffic is treated as high priority packets.

  • FNF records only the original DSCP values when the packets are sent to the external collector. FNF supports only ingress flows.

Flexible NetFlow Export Spreading

Minimum releases: Cisco IOS XE Catalyst SD-WAN Release 17.9.1a and Cisco vManage Release 20.9.1

Enable Flexible NetFlow export spreading on Cisco IOS XE Catalyst SD-WAN devices. The export-spreading feature spreads out the export of records in the monitor cache over a time interval to improve collector performance. In the case of a synchronized cache, all network devices export records in the monitor cache at the same time. If multiple network devices are configured with the same monitor interval and synchronized cache, the collector may receive all records from all devices at the same time, which can impact the collector performance. Set the time interval for export spreading to spread out the export over a time interval.

To ensure that the collector performance is not affected, export records at a specified time interval, spreading the exporting of records evenly over the cache timeout.

Configure FNF exports using option and data templates. Use the options templates to configure system level attributes. Use the data templates to configure flow records and corresponding data.

When you enable export-spread, configure the following three spread intervals:

  • app-tables: application-table, application-attributes option template

  • tloc-tables: tunnel-tloc-table option template

    The bfd-metric-table introduced in Cisco IOS XE Catalyst SD-WAN Release 17.10.1a and Cisco vManage Release 20.10.1 belongs to the tloc-table category.

  • other-tables: other option templates

The following is an example of how a spreading interval works.

  • When an app-table is configured with ten application-attributes or application-table, the option template packets are sent in ten seconds for all the attributes evenly.

  • The default interval is one second. So, with export-spreading, one large traffic burst of ten seconds is spread into ten smaller bursts of one second each.

Flexible NetFlow option template packets are sent as a burst regularly as set by the timeout option. With export spread interval, instead of sending the option template packets as bursts, the packets are spread across the timeout and export-spread interval.

In Cisco vManage Release 20.8.1 and earlier releases, after every 60 secs option template packets are sent as a burst. For example, if there are 1000 packets, it enqueues all the 1000 packets at the end of 60 secs which causes packet drops.

When you configure export spreading, if there are 1000 packets to be sent at the end of 60 secs, then 100 packets are sent in 10 secs at the rate of 100 packets and avoids the export bursts. If no export spread is specified, the default behavior is immediate export.

When you upgrade from a previous version which doesn’t support export spreading, the default value for spreading in a Cflowd template is disabled.

Flexible NetFlow Export of BFD Metrics

Minimum releases: Cisco IOS XE Catalyst SD-WAN Release 17.10.1a and Cisco Catalyst SD-WAN Control Components Release 20.10.1

With the Flexible Netflow (FNF) export of BFD metrics feature, you can export BFD telemetry data to an external FNF collector to analyze the average jitter, average latency, and loss per tunnel. Jitter and latency are measured in units of microseconds. Loss is measured in units of one hundredth of one percent, 0.01%. This feature provides enhanced monitoring and faster collection of network state data.

A new option template, bfd-metric-table, is added for export of BFD metrics.

Configure export of BFD metrics on Cisco IOS XE Catalyst SD-WAN devices using a Cisco SD-WAN Manager feature template or using the CLI from a Cisco SD-WAN Controller. For more information on configuring export of BFD metrics using Cisco SD-WAN Manager feature templates, see Configure Cflowd Monitoring Policy. For more information on configuring export of BFD metrics using the CLI, see Configure Flexible Netflow with Export of BFD Metrics Using the CLI.

How the Export of BFD Metrics Works

Minimum releases: Cisco IOS XE Catalyst SD-WAN Release 17.10.1a and Cisco Catalyst SD-WAN Control Components Release 20.10.1

A Cisco IOS XE Catalyst SD-WAN device is responsible for sending IP Flow Information Export (IPFIX) packets to an external collector. After you configure the BFD export interval on the Cisco SD-WAN Controllers or on Cisco SD-WAN Manager, the Forwarding Table Manager (FTM) generates the source metrics.

  • Example 1:

    If you reboot a Cisco IOS XE Catalyst SD-WAN device, the device exports the BFD metrics according to the BFD export interval that you configured. At this point, the FTM does not have any data for exporting. As a consequence, all of the fields, except for the TLOC TABLE OVERLAY SESSION ID field, contain the following invalid value:

    0xFFFFFFFF

    Example 2:

  • The FTM interval for sending data is greater than the BFD export interval. In this situation, data may end up getting exported twice, while the FTM sends data only once. Consequently, there is no new data received from the FTM. The BFD metrics and timestamps are the same as for the last packet.

    For an example of BFD telemetry data that is sent to an external collector, see Configuration Examples for Flexible Netflow Export of BFD Metrics.

Cflowd Traffic Flow Monitoring with SAIE Flows

Minimum releases: Cisco IOS XE Catalyst SD-WAN Release 17.10.1a and Cisco vManage Release 20.10.1

With this feature, you can choose two Cisco SD-WAN Manager real-time device options for monitoring both Cflowd flows and SAIE flows.

For more information on SAIE flows, see the SD-WAN Application Intelligence Engine Flow chapter.

With this feature, you can apply filters for displaying specific applications or application families running within a VPN on the selected Cisco IOS XE Catalyst SD-WAN device.

For more information on the device-filtering options for Cflowd and SAIE flows, see the Devices and Controllers chapter in the Cisco Catalyst SD-WAN Monitor and Maintain Configuration Guide.

Benefits of Cflowd Traffic Flow Monitoring with SAIE Flows

  • Provides increased visibility of the network traffic, enabling network operators to analyze network usage and improve network performance

  • Provides real-time monitoring of Cisco IOS XE Catalyst SD-WAN devices

  • Provides parity with Cisco SD-WAN Manager real-time device options on Cisco IOS XE Catalyst SD-WAN devices

Prerequisites for Cflowd Traffic Flow Monitoring with SAIE Flows

Minimum releases: Cisco IOS XE Catalyst SD-WAN Release 17.10.1a and Cisco vManage Release 20.10.1

Configure application and flow visibility prior to viewing the Cflowd with SAIE flow device options.

For more information on configuring application flow visibility, see Configure Global Application Visibility.

For more information on configuring global flow visibility, see Configure Global Flow Visibility.

Restrictions for Cflowd Traffic Flow Monitoring with SAIE Flows

Minimum releases: Cisco IOS XE Catalyst SD-WAN Release 17.10.1a and Cisco vManage Release 20.10.1

  • Cisco SD-WAN Manager can only display 4001 Cflowd records at a time.

  • If two different users attempt to access the same query from the same device at the same time, the Cisco IOS XE Catalyst SD-WAN device processes only the first request. The second user must resend their request because the first request gets timed out.

  • Search filters for Cflowd with SAIE are matched against the fetched 4001 Cflowd flow records.

  • Enter the full name of the application or the application family for the search filter to return a valid result.

    For example, if you want to search for the netbios-dgm application, and you enter netbios for Application or Application Family, you won't receive the correct result.

Information About Configuring a Maximum FNF Record Rate for Aggregated Data

Minimum supported releases: Cisco IOS XE Catalyst SD-WAN Release 17.14.1a, Cisco Catalyst SD-WAN Control Components Release 20.14.1

Raw and Aggregated Traffic Flow Data

When traffic flow visibility is enabled (see Configure Global Flow Visibility), devices in the network send raw and aggregated traffic flow data to Cisco SD-WAN Manager.

To aggregate flow data, routers use 4-tuples of flow data (containing VPN ID, application name, ingress interface of the flow, and egress interface of the flow) as a key for consolidating the raw data of multiple flows. The router consolidates each flow for which the 4-tuple is identical into a single aggregated FNF record.

Cisco SD-WAN Manager uses the aggregated data to provide a high-level view of network traffic flow information. The aggregated data shows the network applications that are producing traffic, but is less granular than the full traffic flow data. It does not provide source and destination addresses, or source and destination ports for traffic flows.

For a detailed view of traffic flows, use functions such as On Demand Troubleshooting. For information about On Demand Troubleshooting, see On-Demand Troubleshooting.

Maximum FNF Record Rate

You can configure a maximum rate (records per minute) of aggregated traffic data FNF records that a device can send to reduce the performance demands (CPU and memory) on the device. This may be helpful when there is a large number of applications producing network traffic. For information about configuring this, see Configure the Maximum FNF Record Rate for Aggregated Data, Using CLI Commands.

Restrictions for Traffic Flow Monitoring

The following sections describe notes, limitations, and restrictions related to traffic flow monitoring.

Restrictions for Enabling Collect Loopback in Flow Telemetry When Using Loopbacks as TLOCs

  • Supports configuration only through the Cisco Catalyst SD-WAN Controller CLI or Cisco SD-WAN Manager CLI-template. Feature template is not supported for this release.

  • Collect loopback in FNF VPN0 interfaces is not supported.

  • Collect loopback in the Decidated Internet Acccess (DIA) scenario, is not supported.

  • Multi-tenant scenario is not supported.

Configure Traffic Flow Monitoring

The following sections provide information about configuring traffic flow monitoring.

Configure Traffic Flow Monitoring on Cisco IOS XE Catalyst SD-WAN Devices

Cflowd traffic flow monitoring uses Flexible NetFlow (FNF) to export traffic data. Perform the following steps to configure Cflowd monitoring:

Configure Global Flow Visibility

Enable Cflowd visibility globally on all Cisco IOS XE Catalyst SD-WAN devices so that you can perform traffic flowing monitoring on traffic coming to the router from all VPNs in the LAN.

  1. From the Cisco SD-WAN Manager menu, choose Configuration > Policies.

  2. Click Localized Policy.

  3. Click Add Policy.

  4. Click Next to advance through the wizard pages until you reach Policy Overview and then the Policy Settings page.

  5. Enter Policy Name and Policy Description.

  6. Check the Netflow check box to enable flow visibility for IPv4 traffic.

  7. Check the Netflow IPv6 check box to enable flow visibility for IPv6 traffic.


    Note


    Enable flow visibility for IPv4 and IPv6 traffic before configuring Cflowd traffic flows with SAIE visibility.

    For more information on monitoring Cflowd and SAIE flows, see the Devices and Controllers chapter of the Cisco Catalyst SD-WAN Monitor and Maintain Configuration Guide.


  8. Check Implicit ACL Logging to configure your Cisco IOS XE Catalyst SD-WAN device to log dropped packets in the traffic.

    With this configuration, you have visibility of the packets dropped by implicit access control lists (ACL) in case of a link failure in the system.

  9. Enter Log Frequency.

    Log frequency determines how often packet flows are logged. Maximum value is 2147483647. It is rounded down to the nearest power of 2. For example, for 1000, the logging frequency is 512. Thus, every 512th packet in the flow is logged.

  10. Enter FNF IPv4 Max Cache Entries to configure FNF cache size for IPv4 traffic.

    For example, enter 100 to configure FNF cache for IPv4/IPv6 traffic as shown in the following example.

  11. Enter FNF IPv6 Max Cache Entries to configure FNF cache size for IPv6 traffic.

    For example, enter 100 to configure FNF cache for IPv4/IPv6 traffic as shown in the following example.


    Note


    The minimum cache size value is 16. The maximum of total cache size (IPv4 cache + IPv6 cache) should not exceed the limit for each platform. If cache size is not defined and the platform is not in the list, then default maximum cache entries is 200k.


The maximum cache entries is the maximum concurrent flows that Cflowd can monitor. The maximum cache entries vary on different platforms. For more information, contact Cisco Support.

The following example shows the flow-visibility configuration for both IPv4 and IPv6:

policy
    flow-visibility 
    implicit-acl-logging
    log-frequency 1000
    flow-visibility-ipv6
    ip visibility cache entries 100
    ipv6 visibility cache entries 100

While running policy flow-visibility or app-visibility to enable the FNF monitor, you may see the following warning message displaying a GLOBAL memory allocation failure. This log is triggered by enabling FNF monitoring (policy flow-visibility or app-visibility) with a large cache size.

Jul  4 01:45:00.255: %CPPEXMEM-3-NOMEM: F0/0: cpp_cp_svr: QFP: 0, GLOBAL memory allocation of 90120448 bytes by FNF failed
Jul  4 01:45:00.258: %CPPEXMEM-3-TOPUSER: F0/0: cpp_cp_svr: QFP: 0, Top User: CPR STILE EXMEM GRAPH, Allocations: 877, Type: GLOBAL
Jul  4 01:45:00.258: %CPPEXMEM-3-TOPUSER: F0/0: cpp_cp_svr: QFP: 0, Top User: SBC, Bytes Allocated: 53850112, Type: GLOBAL

The warning message does not necessarily indicate a flow monitor application failure. The warning message can indicate internal steps that FNF uses for applying memory from the External Memory Manager (EXMEM) infrastructure.

Use the show platform hardware qfp active classification feature-manager exmem-usage command to display the EXMEM memory usage for various clients.

Device# show platform hardware qfp active active classification feature-manager exmem-usage

EXMEM Usage Information

Total exmem used by CACE: 39668

Client       Id   Total VMR     Total Usage   Total%   Alloc     Free 
---------------------------------------------------------------------------
acl          0      11           2456          6         88       84         
qos          2     205          31512         79          7        5          
fw           4       8            892          2          2        1          
obj-group   39      82           4808         12          5        2          
To ensure that the FNF monitor is enabled successfully, use the show flow monitor monitor-name command to check the status (allocated or not allocated) of a flow monitor.
Device# show flow monitor sdwan_flow_monitor
Flow Monitor sdwan_flow_monitor:
  Description:       monitor flows for vManage and external collectors
  Flow Record:       sdwan_flow_record-003
  Flow Exporter:     sdwan_flow_exporter_1
                     sdwan_flow_exporter_0
  Cache:
    Type:                 normal (Platform cache)
    Status:               allocated
    Size:                 250000 entries
    Inactive Timeout:     10 secs
    Active Timeout:       60 secs

    Trans end aging:   off
SUCCESS
   Status:            allocated
FAILURE
   Status:            not allocated

Configure Global Application Visibility

Enable Cflowd visibility globally on all Cisco IOS XE Catalyst SD-WAN devices so that you can perform traffic flowing monitoring on traffic coming to the router from all VPNs in the LAN.

The app-visibility enables nbar to see each application of the flows coming to the router from all VPNs in the LAN. If app-visibility or app-visibility-ipv6 is defined, then nbar is enabled globally for both IPv4 and IPv6 flows.

  1. From the Cisco SD-WAN Manager menu, choose Configuration > Policies.

  2. Click Localized Policy.

  3. Click Add Policy.

  4. Click Next to advance through the wizard pages until you reach Policy Overview and then the Policy Settings page.

  5. Enter Policy Name and Policy Description.

  6. Check the Application check box to enable application visibility for IPv4 traffic.

  7. Check the Application IPv6 check box to enable application visibility for IPv6 traffic.


    Note


    Enable application visibility for IPv4 and IPv6 traffic before configuring Cflowd traffic flows with SAIE visibility.

    For more information on monitoring Cflowd and SAIE flows, see the Devices and Controllers chapter of the Cisco Catalyst SD-WAN Monitor and Maintain Configuration Guide.


  8. Enter FNF IPv4 Max Cache Entries to configure FNF cache size for IPv4 traffic.

    For example, enter 100 to configure FNF cache size for IPv4 traffic as shown in the following example.

  9. Enter FNF IPv6 Max Cache Entries to configure FNF cache size for IPv6 traffic.

    For example, enter 100 to configure FNF cache size for IPv6 traffic as shown in the following example.

The following example shows the application visibility configuration for both IPv4 and IPv6:

policy
 app-visibility 
  
 
 app-visibility-ipv6  
 ip visibility cache entries 100
 ipv6 visibility cache entries 100
!

Note


The policy app-visibility command also enables global flow visibility by enabling nbar to get the application name.


Note


If you configure Cflowd global flow-visibility, but you do not configure Cflowd app-visibility, the exported application to Cisco SD-WAN Manager returns a result of unknown. The same application exported to an external collector using the IPFIX analyzer may contain an incorrect application name.

If you want to retain the application name, define Cflowd app-visibility to avoid this issue.


Configure Cflowd Monitoring Policy

To configure a policy for Cflowd traffic flow monitoring, use the Cisco SD-WAN Manager policy configuration wizard. The wizard consists of four sequential pages that guide you through the process of creating and editing policy components:

  1. Create Applications or Groups of Interest: Create lists that group related items together and that you call in the match or action components of a policy.

  2. Configure Topology: Create the network structure to which the policy applies.

  3. Configure Traffic Rules: Create the match and action conditions of a policy.

  4. Apply Policies to Sites and VPNs: Associate a policy with sites and VPNs in the overlay network.

In the first three policy configuration wizard pages, create policy components or blocks. In the last page, apply policy blocks to sites and VPNs in the overlay network. For the Cflowd policy to take effect, activate the policy.

  1. From the Cisco SD-WAN Manager menu, choose Configuration > Policies.

  2. Click Custom Options.

  3. Under Centralized Policy, click Traffic Policy.

  4. Click Cflowd.

  5. Click Add Policy and then click Create New.

  6. Enter the Name and Description for the policy.

  7. In the Cflowd Template section, enter Active Flow Timeout.

  8. In the Inactive Flow Timeout field, enter the timeout range.

  9. In the Flow Refresh field, enter the range.

  10. In the Sampling Interval field, enter the sample duration.

  11. In the Protocol drop-down list, choose an option from the drop-down list.

    Starting from Cisco IOS XE Catalyst SD-WAN Release 17.6.1a and Cisco vManage Release 20.6.1, the Advanced Settings field displays when you choose IPv4 or Both from the options.

  12. Under the Advanced Settings, do the following to collect additional IPv4 flow records:

    • Check the TOS check box.

    • Check the Re-marked DSCP check box.

  13. Under the Collector List, click New Collector. You can configure up to four collectors.

    1. In the VPN ID field, enter the number of the VPN in which the collector is located.

    2. In the IP Address field, enter the IP address of the collector.

    3. In the Port field, enter the collector port number.

    4. In the Transport Protocol drop-down list, choose the transport type to use to reach the collector.

    5. In the Source Interface field, enter the name of the interface to use to send flows to the collector.

    6. In the Export Spreading field, click the Enable or Disable radio button.

      Starting from Cisco IOS XE Catalyst SD-WAN Release 17.9.1a and Cisco vManage Release 20.9.1, the Export Spreading field is available to prevent export storms that occur due to the creation of a synchronized cache. The export of the previous interval is spread during the current interval to prevent export storms.

    7. In the BFD Metrics Exporting field, click the Enable or Disable radio button.

      Starting from Cisco IOS XE Catalyst SD-WAN Release 17.10.1a and Cisco vManage Release 20.10.1, the BFD Metrics Exporting field is available for collecting BFD metrics of loss, jitter, and latency.

    8. In the Exporting Interval field, enter the interval in seconds for sending BFD metrics.

      Starting from Cisco IOS XE Catalyst SD-WAN Release 17.10.1a and Cisco vManage Release 20.10.1, the Exporting Interval field is available for specifying the export interval for BFD metrics.

      Once you enable BFD metrics exporting, you can see the Exporting Interval field.

      The Exporting Interval field controls the intervals by which BFD metrics are sent.

      The default BFD export interval is 600 seconds.

    Field

    Description

    Cflowd Policy Name

    Enter a name for the Cflowd policy.

    Description

    Enter a description for the Cflowd policy.

    Active Flow Timeout

    Enter an active flow timeout value. The range is 30 to 3600 seconds.

    Active flow timeout is the time interval Netflow records are exported for long lived flows.

    Inactive Flow Timeout

    Enter an inactive flow timeout value. The range is 1 to 3600 seconds.

    Inactive flow timeout is the time interval that flows are not active for a period of time (For example, 15 seconds) that is exported from the flow cache.

    Flow Refresh

    Enter the interval for sending Cflowd records to an extremal collector. The range is 60 through 86400 seconds.

    Sampling Interval

    Enter the sample duration. The range is 1 through 65536 seconds.

    Sampling interval is the time duration taken to collect one of the sample in packets.

    Protocol

    Choose the traffic protocol type from the drop-down list. The options are: IPv4, IPv6, or Both.

    The default protocol is IPv4.

    TOS

    Check the TOS check box.

    This indicates the type of field in the IPv4 header.

    Re-marked DSCP

    Check the Re-marked DSCP check box.

    This indicates the traffic output specified by the remarked data policy.

    VPN ID

    Enter the VPN ID. The range is 0 through 65536.

    IP Address

    Enter the IP address of the collector.

    Port

    Enter the port number of the collector. The range is from 1024 through 65535.

    Transport Protocol

    Choose the transport type from the drop-down list to reach the collector.

    The options are: TCP or UDP.

    Source Interface

    Choose the source interface from the drop-down list.

    Export Spreading

    Click the Enable or Disable radio button to configure export spreading.

    The default is Disable.

    BFD Metrics Exporting

    Click the Enable or Disable radio button to configure export of Bidirectional Forwarding Detection (BFD) metrics.

    The default is Disable.

    Exporting Interval

    Enter the export interval in seconds for sending the BFD metrics to an external collector. Enter an integer value.

    This field is displayed only if you enable BFD metrics export.

    The default BFD export interval is 600 seconds.

  14. Click Save Cflowd Policy.

View Cflowd Information

To view Cflowd information, use the following commands on the Cisco IOS XE Catalyst SD-WAN device.

  • show sdwan app-fwd cflowd collector

  • show sdwan app-fwd cflowd flow-count

  • show sdwan app-fwd cflowd flows [vpn vpn-id] format table

  • show sdwan app-fwd cflowd statistics

  • show sdwan app-fwd cflowd template [name template-name]

  • show sdwan app-fwd cflowd flows format table


Note


Starting from Cisco IOS XE Catalyst SD-WAN Release 17.15.1a, the preceding show commands retrieve up to 4000 flow records for each monitor (IPv4 and IPv6) from the cflowd database. The flow records exceeding 4000 are not shown.


The following sample output displays Cflowd information:

Device# show sdwan app-fwd cflowd flows 
Generating output, this might take time, please wait ...
app-fwd cflowd flows vpn 1 src-ip 10.2.2.11 dest-ip 10.20.24.17 src-port 0 dest-port 2048 dscp 63 ip-proto 1
 tcp-cntrl-bits           0
 icmp-opcode              2048
 total-pkts               6
 total-bytes              600
 start-time               "Fri May 14 02:57:23 2021"
 egress-intf-name         GigabitEthernet5
 ingress-intf-name        GigabitEthernet1
 application              unknown
 family                   network-service
 drop-cause               "No Drop"
 drop-octets              0
 drop-packets             0
 sla-not-met              0
 color-not-met            0
 queue-id                 2
 tos                      255
 dscp-output              63
 sampler-id               3
 fec-d-pkts               0
 fec-r-pkts               0
 pkt-dup-d-pkts-orig      0
 pkt-dup-d-pkts-dup       0
 pkt-dup-r-pkts           0
 pkt-cxp-d-pkts           0
 traffic-category         0

For more information on Cflowd flows, see the show sdwan app-fwd cflowd flows command page.

Configure Cflowd Traffic Flow Monitoring Using the CLI

From the CLI on the Cisco SD-WAN Controller that is controlling the Cisco IOS XE Catalyst SD-WAN device:

  1. Configure a Cflowd template to specify flow visibility and flow sampling parameters:

    vSmart(config)# policy cflowd-template template-name
     vSmart(config-cflowd-template)#  flow-active-timeout seconds 
     vSmart(config-cflowd-template)#  flow-inactive-timeout seconds
     vSmart(config-cflowd-template)#  flow-sampling-interval number 
     vSmart(config-cflowd-template)#  template-refresh seconds
     vSmart(config-cflowd-template)#  protocol ipv4|ipv6|Both
     

    Note


    On Cisco IOS XE Catalyst SD-WAN devices, a flow-active-timeout is fixed as 60 seconds. If a flow-inactive-timeout is fixed as 10 seconds. The flow-active-timeout and flow-inactive-timeout value that is configured on Cisco SD-WAN Controller or Cisco SD-WAN Manager do not take effect on Cisco IOS XE Catalyst SD-WAN devices.


  2. To collect TOS, DSCP output and TLOC loopback in flow monitor:

    Starting Cisco Catalyst SD-WAN Manager Release 20.12.1, when you configure a loopback interface as an ingress or egress transport interface, this feature enables you to collect loopback instead of physical interface in FNF records. This feature is supported for IPv4 and IPv6.

    
    vSmart(config-cflowd-template)# customized-ipv4-record-fields
    vsmart(config-customized-ipv4-record-fields)# collect-tos
    vsmart(config-customized-ipv4-record-fields)# collect-dscp-output
    vSmart(config-cflowd-template)#  collect-tloc-loopback
    
  3. Configure a flow collector:

    vSmart(config-cflowd-template)# collector vpn vpn-id address 
    ip-address port port-number transport transport-type 
    source-interface interface-name
    export-spread 
    enable 
    app-tables app-tables
    tloc-tables tloc-tables 
    other-tablesother-tables
    

    Note


    You can configure app-tables, tloc-tables, and other-tables options only using Cisco SD-WAN Controllers.


    Note


    Cisco IOS XE Catalyst SD-WAN devices only support UDP collector. Irrespective of the transport protocol that is configured, UDP is the default collector for Cisco IOS XE Catalyst SD-WAN devices.


  4. Configure a data policy that defines traffic match parameters and that includes the action cflowd:

    vSmart(config)# policy data-policy policy-name
    vSmart(config-data-policy)# sequence number
    vSmart(config-sequence)# match match-parameters
    vSmart(config-sequence)# action cflowd
    
  5. Create lists of sites in the overlay network that contain the Cisco IOS XE Catalyst SD-WAN devices to which you want to apply the traffic flow monitoring policy. To include multiple site in the list, configure multiple vpn vpn-id commands.

    vSmart(config)# policy lists
    vSmart(config-lists)# vpn-list list-name
    vSmart(config-vpn-list)# vpn vpn-id
    
  6. Apply the data policy to the sites in the overlay network that contain the Cisco IOS XE Catalyst SD-WAN devices:

    vSmart(config)# apply-policy site-list list-name
    vSmart(config-site-list)# data-policy policy-name
    vSmart(config-site-list)# cflowd-template template-name
    

Configure Flexible Netflow on VPN0 Interface

You can enable FNF on a VPN0 interface using a CLI template or the CLI add-on template. The ezPM profile helps in creating a new profile to carry all the Netflow VPN0 monitor configuration. On selecting a profile and specifying a few parameters, ezPM provides the remaining provisioning information. A profile is a pre-defined set of traffic monitors that can be enabled or disabled for a context. You can configure Easy Performance Monitor (ezPM) and enable FNF as follows.

Device# config-transaction
Device(config)# performance monitor context <monitor_name> profile <sdwan-fnf> traffic-monitor <all> [ipv4/ipv6] 
Device(config-perf-mon)# exporter destination <destination address> source <source interface> transport udp vrf <vrf-name> port <port-number> dscp <dscp>


The following example shows how to configure a performance monitor context using the sdwan-fnf profile. This configuration enables monitoring of traffic metrics. Here, 10.1.1.1 is the IP address of the third-party collector, GigabitEthernet5 is the source interface, and 4739 is the listening port of the third-party collector.

Device# config-transaction
Device(config)# performance monitor context <monitor_name> profile sdwan-fnf traffic-monitor all [ipv4/ipv6] 
Device(config-perf-mon)# exporter destination <10.1.1.1> source <GigabitEthernet5> transport udp vrf <vrf1> port <4739> dscp <1>


Configure Flexible NetFlow with Export of BFD Metrics Using the CLI

Minimum releases: Cisco IOS XE Catalyst SD-WAN Release 17.10.1a and Cisco Catalyst SD-WAN Control Components Release 20.10.1

From the CLI on the Cisco SD-WAN Controller that is controlling the Cisco IOS XE Catalyst SD-WAN device, enter the following commands depending on if you want to enable or disable the export of BFD metrics using a data policy:

  1. Enable the export of BFD metrics.

    policy
     cflowd-template template-name
       collector vpn vpn-id address ip-address port port transport transport
         source-interface interface
         bfd-metrics-export 
         export-interval export-interval

    The default BFD export interval is 600 seconds. BFD export interval is independent of a Cflowd template refresh. The BFD export interval only controls the interval for sending data from the bfd-metrics-export table. For the tunnel-tloc table, the BFD export interval uses the minimum value between the BFD export interval and the Cflowd template refresh as the interval to send data.

  2. Disable the export of BFD metrics.

    policy
     cflowd-template template-name
       collector vpn vpn-id address ip-address port port transport transport
       source-interface interface
       no bfd-metrics-export

Here is a complete configuration example for enabling BFD metrics export.

policy
 cflowd-template fnf
  template-refresh 600
  collector vpn 0 address 10.0.100.1 port 4739 transport transport_udp
   bfd-metrics-export
    export-interval 30
   !
  !
 !
 lists
  site-list 500
   site-id 500
  !
 !
!
apply-policy
 site-list 500
  cflowd-template fnf
 !
!

Configuration Examples for Flexible NetFlow Export of BFD Metrics

Minimum releases: Cisco IOS XE Catalyst SD-WAN Release 17.10.1a and Cisco Catalyst SD-WAN Control Components Release 20.10.1

The following example shows a centralized policy configuration with export of BFD metrics enabled:

Device# show sdwan policy from-vsmart 
from-vsmart cflowd-template fnf
 flow-active-timeout    600
 flow-inactive-timeout  60
 template-refresh       600
 flow-sampling-interval 1
 protocol               ipv4
 customized-ipv4-record-fields
  no collect-tos
  no collect-dscp-output
 collector vpn 0 address 10.0.100.1 port 4739 transport transport_udp
  bfd-metrics-export
   export-interval 600 

The following example shows FNF BFD telemetry data with average jitter, average latency, and loss metrics:

{ 'Data_Template': 'Data_Flow',
  'ObservationDomainId': 6,
  'Version': 10,
  'arrive_time': 1658807309.2496994,
  'dfs_tfs_length': 200,
  'export_dfs_tfs_templates_list_dict': { 'FlowSequence': 3354,
                                          'Flowset_id': '258',
                                          'Flowset_length': 200,
                                          'Length': 286,
                                          'ObservationDomainId': 6,
                                          'TimeStamp': 1658807269,
                                          'Version': 10,
                                          'flow': [ { 'bfd_avg_jitter': 1000,
                                                      'bfd_avg_latency': 1000,
                                                      'bfd_loss': 15,
                                                      'bfd_pfr_update_ts': 1658806692155,
                                                      'bfd_rx_cnt': 0,
                                                      'bfd_tx_cnt': 0,
                                                      'ipDiffServCodePoint': 48,
                                                      'tloc_table_overlay_session_id': 10},
                                                      …
                                                  ]},
 'flow_length': 4,
  'flow_time': 1658807269,
  'flowset_id': '258',
  'header': { 'FlowSequence': 3354,
              'Length': 286,
              'ObservationDomainId': 6,
              'TimeStamp': 1658807269,
              'Version': 10},
  'host': '10.0.100.15',
  'ipfix_length': 286,
  'packet_number': 2,
  'template_id': '258'}

Apply and Enable Cflowd Policy

For a centralized data policy to take effect, you must apply it to a list of sites in the overlay network:

vSmart(config)# apply-policy site-list list-name data-policy policy-name

To activate the Cflowd template, associate it with the data policy:

vSmart(config)# apply-policy cflowd-template template-name

For all data-policy policies that you apply with apply-policy commands, the site IDs across all the site lists must be unique. That is, the site lists must not contain overlapping site IDs. An example of overlapping site IDs are those in the two site lists site-list 1 site-id 1-100 and site-list 2 site-id 70-130. Here, sites 70 through 100 are in both lists. If you apply these two site lists to two different data-policy policies, the attempt to commit the configuration on the Cisco Catalyst SD-WAN Controller would fail.

The same type of restriction also applies to the following types of policies:

  • Application-aware routing policy (app-route-policy)

  • Centralized control policy (control-policy)

  • Centralized data policy (data-policy)

You can, however, have overlapping site IDs for site lists that you apply for different types of policy. For example, the sites lists for control-policy and data-policy policies can have overlapping site IDs. So for the two example site lists above, site-list 1 site-id 1-100 and site-list 2 site-id 70-130, you could apply one to a control policy and the other to a data policy.

After you successfully activate the configuration by issuing a commit command, the Cisco Catalyst SD-WAN Controller pushes the data policy to the Cisco IOS XE Catalyst SD-WAN devices located in the specified sites. To view the policy as configured on the Cisco Catalyst SD-WAN Controller, use the show running-config command in the Cisco Catalyst SD-WAN Controller. To view the policy that has been pushed to the device, use the show policy from-vsmart command on the device.

To display the centralized data policy as configured on the Cisco Catalyst SD-WAN Controller, use the show running-config command:

vSmart# show running-config policy 
vSmart# show running-config apply-policy

To display the centralized data policy that has been pushed to the Cisco IOS XE Catalyst SD-WAN device, issue the show omp data-policy command on the device:

Device# show sdwan policy from-vsmart 

Enable Cflowd Visibility on Cisco IOS XE Catalyst SD-WAN devices

You can enable Cflowd visibility directly on Cisco IOS XE Catalyst SD-WAN devices, without configuring a data policy, so that you can perform traffic-flow monitoring on traffic coming to the router from all VPNs in the LAN. To do this, configure Cflowd visiblity on the device:

Device(config)# policy flow-visibility 

To monitor the applications, use the show app cflowd flows and show app cflowd statistics commands on the device.

Cflowd Traffic Flow Monitoring Configuration Examples

This topic shows a complete example of configuring traffic flow monitoring.

Configuration Steps

Enable Cflowd traffic monitoring with a centralized data policy, so all configuration is done on a Cisco Catalyst SD-WAN Controller. The following example procedure monitors all TCP traffic, sending it to a single collector:

  1. Create a Cflowd template to define the location of the collector and to modify Cflowd timers.
    vsmart(config)# policy cflowd-template test-cflowd-template
    vsmart(config-cflowd-template-test-cflowd-template)# collector vpn 1 address 172.16.155.15 port 13322 transport transport_udp
    vsmart(config-cflowd-template-test-cflowd-template)# flow-inactive-timeout 60
    vsmart(config-cflowd-template-test-cflowd-template)# template-refresh 90
  2. Create a list of VPNs whose traffic you want to monitor.
    
    vsmart(config)# policy lists vpn-list vpn_1 vpn 1
  3. Create a list of sites to apply the data policy to.
    vsmart(config)# policy lists site-list cflowd-sites site-id 400,500,600
  4. Configure the data policy.
    vsmart(config)# policy data-policy test-cflowd-policy
    vsmart(config-data-policy-test-cflowd-policy)# vpn-list vpn_1
    vsmart(config-vpn-list-vpn_1)# sequence 1
    vsmart(config-sequence-1)# match protocol 6
    vsmart(config-match)# exit
    vsmart(config-sequence-1)# action accept cflowd
    vsmart(config-action)# exit
    vsmart(config-sequence-1)# exit
    vsmart(config-vpn-list-vpn_1)# default-action accept
  5. Apply the policy and the Cflowd template to sites in the overlay network.
    vsmart(config)# apply-policy site-list cflowd-sites data-policy test-cflowd-policyDevice(config-site-list-cflowd-sites)# cflowd-template test-cflowd-template
  6. Activate the data policy.
    vsmart(config-site-list-cflowd-sites)# validate
    Validation complete
    vsmart(config-site-list-cflowd-sites)# commit
    Commit complete.
    vsmart(config-site-list-cflowd-sites)# exit configuration-mode

Example Configuration

Here is a complete example of a Cflowd configuration:

vsmart(config)# show configuration
apply-policy
 site-list cflowd-sites
  data-policy     test-cflowd-policy
  cflowd-template test-cflowd-template
 !
!
policy
 data-policy test-cflowd-policy
  vpn-list vpn_1
   sequence 1
    match
     protocol 6
    !
    action accept
     cflowd
    !
   !
   default-action accept
  !
 !
 cflowd-template test-cflowd-template
  flow-inactive-timeout 60
  template-refresh      90
  collector vpn 1 address 192.168.0.1 protocol ipv4 port 13322 transport transport_udp
 !
 lists
  vpn-list vpn_1
   vpn 1
  !
  site-list cflowd-sites
   site-id 400,500,600
  !
 !
!

The following sample output from the show sdwan run policy command displays the configuration for IPv4 and IPv6 application visibility and flow visibility for Cflowd with SAIE flows:

Device# show sdwan run policy
policy
 app-visibility
 app-visibility-ipv6
 flow-visibility
 flow-visibility-ipv6

Verify Cflowd Configuration

To verify the Cflowd configuration after activating it on the Cisco Catalyst SD-WAN Controller, use the show running-config policy and show running-config apply-policy commands.

The following is a sample output from the show sdwan policy from-vsmart cflowd-template command:

Device# show sdwan policy from-vsmart cflowd-template 
from-vsmart cflowd-template test-cflowd-template
 flow-active-timeout   30
 flow-inactive-timeout 60
 template-refresh      90
 flow-sampling-interval 1
 protocol ipv4/ipv6/both 
 customized-ipv4-record-fields
  collect-tos
  collect-dscp-output

collector vpn 1 address 192.0.2.1 protocol ipv4 port 13322 transport transport_udp

The following is a sample output from the show sdwan policy from-vsmart command:

Device# show sdwan policy from-vsmart 
from-vsmart data-policy test-cflowd-policy
 vpn-list vpn_1
  sequence 1
   match
    protocol 6
   action accept
    cflowd
  default-action accept
from-vsmart cflowd-template test-cflowd-template
 flow-active-timeout   30
 flow-inactive-timeout 60
 protocol ipv4/ipv6/both
 template-refresh      90  
 customized-ipv4-record-fields
   collect-tos
   collect-dscp-output
 collector vpn 1 address 192.0.2.1 port 13322 transport transport_udp
from-vsmart lists vpn-list vpn_1
 vpn 1

Starting from Cisco IOS XE Catalyst SD-WAN Release 17.12.1a, the cflowd commands have been enhanced for both IPv4 and IPv6 flow records.

The following is the sample output from the show flow record command where it has been enhanced by the addition of a new field collect connection initiator which specifies the direction of flow.

Device# show flow record sdwan_flow_record-xxx 

IPv4 flow record:

flow record sdwan_flow_record-1666223692122679:
  Description:        flow and application visibility records
  No. of users:       1
  Total field space:  102 bytes
  Fields:
    match ipv4 protocol
    match ipv4 source address
    match ipv4 destination address
    match transport source-port
    match transport destination-port
    match routing vrf service
    collect ipv4 dscp
    collect transport tcp flags
    collect interface input
    collect interface output
    collect counter bytes long
    collect counter packets long
    collect timestamp absolute first
    collect timestamp absolute last
    collect application name
    collect flow end-reason
    collect connection initiator
    collect overlay session id input
    collect overlay session id output
    collect connection id long
    collect drop cause id
    collect counter bytes sdwan dropped long
    collect sdwan sla-not-met
    collect sdwan preferred-color-not-met
    collect sdwan qos-queue-id
collect counter packets sdwan dropped long

IPv6 flow format:

flow record sdwan_flow_record_ipv6-1667963213662363:
  Description:        flow and application visibility records
  No. of users:       1
  Total field space:  125 bytes
  Fields:
    match ipv6 protocol
    match ipv6 source address
    match ipv6 destination address
    match transport source-port
    match transport destination-port
    match routing vrf service
    collect ipv6 dscp
    collect transport tcp flags
    collect interface input
    collect interface output
    collect counter bytes long
    collect counter packets long
    collect timestamp absolute first
    collect timestamp absolute last
    collect application name
    collect flow end-reason
    collect connection initiator
    collect overlay session id input
    collect overlay session id output
    collect connection id long
    collect drop cause id
    collect counter bytes sdwan dropped long
    collect sdwan sla-not-met
    collect sdwan preferred-color-not-met
    collect sdwan qos-queue-id
    collect counter packets sdwan dropped long

The following is the enhanced sample output from the show flow monitor monitor-name cache command where a new field connection initiator indicating flow direction has been added in the output. The connection initiator field can have one of these values - initiator for client to server traffic flow, reverse for server to client and unknown when the direction of traffic flow is not known.

Device# show flow monitor sdwan_flow_monitor cache
Cache type: Normal (Platform cache)
Cache size: 128000
Current entries: 4
High Watermark: 5
Flows added: 6
Flows aged: 2
- Inactive timeout ( 10 secs) 2
IPV4 SOURCE ADDRESS: 10.20.24.110
IPV4 DESTINATION ADDRESS: 10.20.25.110
TRNS SOURCE PORT: 40254
TRNS DESTINATION PORT: 443
IP VPN ID: 1
IP PROTOCOL: 6
tcp flags: 0x02
interface input: Gi5
interface output: Gi1
counter bytes long: 3966871
counter packets long: 52886
timestamp abs first: 02:07:45.739
timestamp abs last: 02:08:01.840
flow end reason: Not determined
connection initiator: Initiator
interface overlay session id input: 0
interface overlay session id output: 4
connection connection id long: 0xD8F051F000203A22

Check the Flows

On the Cisco IOS XE Catalyst SD-WAN devices affected by the Cflowd data policy, various commands let you check the status of the Cflowd flows.


Device# show sdwan app-fwd cflowd statistics 

      data_packets             :      0 
      template_packets         :      0 
      total-packets            :      0 
      flow-refresh             :      123 
      flow-ageout              :      117 
      flow-end-detected        :      0 
      flow-end-forced          :      0 

FNF IPv6 Configuration Example for IPv6 traffic

The following example shows the centralized policy configuration with Cflowd for IPv6 traffic:

policy
 data-policy _vpn_1_accept_cflowd_vpn_1
  vpn-list vpn_1
   sequence 102
    match
     source-ipv6      2001:DB8:0:/32
     destination-ipv6 2001:DB8:1:/32
    !
    action accept
     count  cflowd_ipv6_1187157291
     cflowd
    !
   !
   default-action accept
  !
 !
 cflowd-template cflowd_server
  flow-active-timeout   60
  flow-inactive-timeout 30
  protocol              ipv6   
 !
 lists
  vpn-list vpn_1
   vpn 1
  site-list vedge1
   site-id 500
  !

apply-policy
 site-list vedge1
  data-policy _vpn_1_accept_cflowd_vpn_1 all
  cflowd-template cflowd_server

FNF Export Spread Configuration Example

The following example shows the configuration for export spreading:

Device# show sdwan policy from-vsmart
from-vsmart cflowd-template cflowd
 flow-active-timeout    600
 flow-inactive-timeout  60
 template-refresh       60
 flow-sampling-interval 1
 protocol               ipv4
 customized-ipv4-record-fields
  no collect-tos
  no collect-dscp-output
 collector vpn 0 address 10.0.100.1 port 4739 transport transport_udp
  export-spread
   app-tables   20
   tloc-tables  10
   other-tables 5

Configure the Maximum FNF Record Rate for Aggregated Data, Using CLI Commands

Minimum supported releases: Cisco IOS XE Catalyst SD-WAN Release 17.14.1a, Cisco Catalyst SD-WAN Control Components Release 20.14.1

Before You Begin

For more information about using CLI templates, see CLI Add-On Feature Templates and CLI Templates. By default, CLI templates execute commands in global configuration mode.

Configure the Maximum FNF Record Rate

Configure the maximum rate (FNF records per minute) for a device to send aggregated traffic data to Cisco SD-WAN Manager.

policy app-agg-node max-records-per-minute

Example

The following configures a device to send a maximum of 1000 FNF records per minute of aggregated traffic data.

policy app-agg-node 1000

Example

The following restores a device to the default value of sending a maximum of 10000 FNF records per minute of aggregated traffic data.

no policy app-agg-node

Verify Traffic Flow Monitoring

The following sections provide information about verifying traffic flow monitoring.

Verify Collect Loopback

You can verify the ingress and egress interface output using the following command.

show sdwan app-fwd cflowd flows

The following is a sample output from the show sdwan app-fwd cflowd flows using the flows keyword.

Device#show sdwan app-fwd cflowd flows 
app-fwd cflowd flows vpn 1 src-ip 10.10.15.12 dest-ip 10.20.15.12 src-port 0 dest-port 0 dscp 0 ip-proto 1
 tcp-cntrl-bits           24
 icmp-opcode              0
 total-pkts               5
 total-bytes              500
 start-time               "Tue Jun 27 09:21:09 2023"
 egress-intf-name         Loopback1
 ingress-intf-name        GigabitEthernet5
 application              ping
 family                   network-service
 drop-cause               "No Drop"
 drop-octets              0
 drop-packets             0
 sla-not-met              0
 color-not-met            0
 queue-id                 2
 initiator                2
 tos                      0
 dscp-output              0
 sampler-id               0
 fec-d-pkts               0
 fec-r-pkts               0
 pkt-dup-d-pkts-orig      0
 pkt-dup-d-pkts-dup       0
 pkt-dup-r-pkts           0
 pkt-cxp-d-pkts           0
 category                 0
 service-area             0
 cxp-path-type            0
 region-id                0
 ssl-read-bytes           0
 ssl-written-bytes        0
 ssl-en-read-bytes        0
 ssl-en-written-bytes     0
 ssl-de-read-bytes        0
 ssl-de-written-bytes     0
 ssl-service-type         0
 ssl-traffic-type         0
 ssl-policy-action        0
 appqoe-action            0
 appqoe-sn-ip             0.0.0.0
 appqoe-pass-reason       0
 appqoe-dre-input-bytes   0
 appqoe-dre-input-packets 0
 appqoe-flags             0

You can verify the ingress and egress interface output using the following command.

show sdwan app-fwd cflowd table

The following is a sample output from the show sdwan app-fwd cflowd table using the table keyword.

show sdwan app-fwd cflowd flows table
PKT    PKT    PKT   PKT                                                    SSL             SSL                                                                APPQOE  APPQOE           
                                                                                  TCP                                                                                                                                                        SLA  COLOR                                          FEC   FEC   DUP D  DUP D  DUP   CXP                      CXP           SSL    SSL      EN     SSL EN   DE     SSL DE   SSL      SSL      SSL                      APPQOE  DRE     DRE              
                                                       SRC    DEST         IP     CNTRL  ICMP    TOTAL  TOTAL                             EGRESS INTF       INGRESS INTF                                                    DROP    DROP     NOT  NOT    QUEUE                  DSCP    SAMPLER  D     R     PKTS   PKTS   R     D               SERVICE  PATH  REGION  READ   WRITTEN  READ   WRITTEN  READ   WRITTEN  SERVICE  TRAFFIC  POLICY  APPQOE  APPQOE   PASS    INPUT   INPUT    APPQOE  
VPN  SRC IP                   DEST IP                  PORT   PORT   DSCP  PROTO  BITS   OPCODE  PKTS   BYTES   START TIME                NAME              NAME              APPLICATION  FAMILY              DROP CAUSE   OCTETS  PACKETS  MET  MET    ID     INITIATOR  TOS  OUTPUT  ID       PKTS  PKTS  ORIG   DUP    PKTS  PKTS  CATEGORY  AREA     TYPE  ID      BYTES  BYTES    BYTES  BYTES    BYTES  BYTES    TYPE     TYPE     ACTION  ACTION  SN IP    REASON  BYTES   PACKETS  FLAGS   
----------------
1    10.10.15.11              10.20.20.10              0      0      0     1      24     0       5      500     Tue Jun 27 09:21:06 2023  Loopback1         GigabitEthernet5  ping         network-service     No Drop      0       0        0    0      2      2          0    0       0        0     0     0      0      0     0     0         0        0     0       0      0        0      0        0      0        0        0        0       0       0.0.0.0  0       0       0        0       
0    10.0.5.5                 10.0.15.10                58048  22     4     6      24     0       41     1752    Tue Jun 27 09:21:06 2023  internal0/0/rp:0  GigabitEthernet9  unknown      network-service     No Drop      0       0        0    0      2      0          0    0       0        0     0     0      0      0     0     0         0        0     0       0      0        0      0        0      0        0        0        0       0       0.0.0.0  0       0       0        0       
1    10.10.15.11              10.20.20.10              0      2048   0     1      24     2048    5      500     Tue Jun 27 09:21:06 2023  GigabitEthernet5  Loopback1         ping         network-service     No Drop      0       0        0    0      2      2          0    0       0        0     0     0      0      0     0     0         0        0     0       0      0        0      0        0      0        0        0        0       0       0.0.0.0  0       0       0        0       
1    10.10.15.11              10.5.10.15               0      2048   0     1      31     2048    20     960     Tue Jun 27 09:21:06 2023  Null              GigabitEthernet5  ping         network-service     Ipv4NoRoute  960     20       0    0      2      2          0    0       0        0     0     0      0      0     0     0         0        0     0       0      0        0      0        0      0        0        0        0       0       0.0.0.0  0       0       0        0       
1    10.10.15.11              10.20.20.10              50920  4739   0     17     31     0       473    524768  Tue Jun 27 09:21:06 2023  GigabitEthernet5  internal0/0/rp:0  ipfix        network-management  No Drop      0       0        0    0      2      1          0    0       0        0     0     0      0      0     0     0         0        0     0       0      0        0      0        0      0        0        0        0       0       0.0.0.0  0       0       0        0       
0    10.0.5.10                10.0.5.10                 22     58048  48    6      24     0       39     3020    Tue Jun 27 09:21:05 2023  GigabitEthernet9  internal0/0/rp:0  ssh          terminal            No Drop      0       0        0    0      2      2          0    0       0        0     0     0      0      0     0     0         0        0     0       0      0        0      0        0      0        0        0        0       0       0.0.0.0  0       0       0        0       
1    10.10.15.11              10.20.20.10              0      771    48    1      31     771     8      4192    Tue Jun 27 09:21:05 2023  internal0/0/rp:0  GigabitEthernet5  icmp         network-service     No Drop      0       0        0    0      2      2          0    0       0        0     0     0      0      0     0     0         0        0     0       0      0        0      0        0      0        0        0        0       0       0.0.0.0  0       0       0        0       
1    fe40::6044:ff:feb7:c2db  ff01::1:ff00:10          0      34560  0     58     0      34560   6      432     Tue Jun 27 09:20:41 2023  internal0/0/rp:0  GigabitEthernet5  ipv6-icmp    network-service     No Drop      0       0        0    0      0      2          0    0       0        0     0     0      0      0     0     0         0        0     0       0      0        0      0        0      0        0        0        0       0       0.0.0.0  0       0       0        0       
1    10:20:20::10             fe40::6024:ff:feb6:c1db  0      34816  56    58     0      34816   4      288     Tue Jun 27 09:20:41 2023  GigabitEthernet5  internal0/0/rp:0  ipv6-icmp    network-service     No Drop      0       0        0    0      2      2          0    0       0        0     0     0      0      0     0     0         0        0     0       0      0        0      0        0      0        0        0        0       0       0.0.0.0  0       0       0        0       

Verify Interface Binding on the Device

You can verify the interface binding on the device using the following command.

show sdwan control local-properties wan-interface-list

The following is a sample output from the show sdwan control local-properties wan-interface-list using the wan-interface-list keyword.

The command displays:

  • The physical interface bound to the loopback WAN interface in bind mode.

  • Unbind for loopback WAN interface in unbind mode.

  • N/A for any other cases.

Device#show sdwan control local-properties wan-interface-list
 NAT TYPE: E -- indicates End-point independent mapping
           A -- indicates Address-port dependent mapping
           N -- indicates Not learned
           Note: Requires minimum two vbonds to learn the NAT type

                         PUBLIC          PUBLIC PRIVATE         PRIVATE                                 PRIVATE                              
MAX   RESTRICT/           LAST         SPI TIME    NAT  VM          BIND
INTERFACE                IPv4            PORT   IPv4            IPv6                                    PORT    VS/VM COLOR            STATE 
CNTRL CONTROL/     LR/LB  CONNECTION   REMAINING   TYPE CON REG     INTERFACE
                                                                                                                                                   STUN                                              PRF IDs
-----------------------------------------------------------------------------------------------------------------------------------------------------------------------------------------------------------------------------------------
GigabitEthernet1              10.0.10.10      12346  10.0.10.10      ::                                      12346    2/1  lte              up     2      no/yes/no   No/No  0:20:20:27   0:01:14:20  N    5  Default N/A                           
GigabitEthernet4              10.0.10.10      12346  10.0.10.10      ::                                      12346    2/0  blue             up     2      no/yes/no   No/No  0:20:20:27   0:01:14:20  N    5  Default N/A                           
Loopback1                     1.1.1.1         12366  1.1.1.1         ::                                      12366    2/0  custom1          up     2      no/yes/no   No/No  0:20:20:27   0:01:14:20  N    5  Default GigabitEthernet1              
Loopback2                     2.2.2.2         12406  2.2.2.2         ::                                      12406    2/0  custom2          up     2      no/yes/no   No/No  0:20:20:27   0:01:14:20  N    5  Default Unbind

Verify Flexible Netflow Configuration on VPN0 Interface

View Flexible Netflow Record Configuration Summary

You can verify FNF record configuration using the following command.

Device# show flow record <monitor-context-name>

Note


The monitor name is used as temp0 in the following examples.


The following sample output displays the information about IPv4 traffic flow records using ezPM profile.

Device# show flow record temp0-sdwan-fnf-vpn0-monitor_ipv4
flow record temp0-sdwan-fnf-vpn0-monitor_ipv4:
  Description:        ezPM record
  No. of users:       1
  Total field space:  66 bytes
  Fields:
    match ipv4 dscp
    match ipv4 protocol
    match ipv4 source address
    match ipv4 destination address
    match transport source-port
    match transport destination-port
    match flow direction
    collect routing next-hop address ipv4
    collect transport tcp flags
    collect interface input
    collect interface output
    collect flow sampler
    collect counter bytes long
    collect counter packets long
    collect timestamp absolute first
    collect timestamp absolute last
    collect application name
    collect flow end-reason                                                                   


The following sample output displays the information about IPv6 traffic flow records using ezPM profile.

Device# show flow record temp0-sdwan-fnf-vpn0-monitor_ipv6                                                                  
  flow record temp0-sdwan-fnf-vpn0-monitor_ipv6:
  Description:        ezPM record
  No. of users:       1
  Total field space:  102 bytes
  Fields:
    match ipv6 dscp
    match ipv6 protocol
    match ipv6 source address
    match ipv6 destination address
    match transport source-port
    match transport destination-port
    match flow direction
    collect routing next-hop address ipv6
    collect transport tcp flags
    collect interface input
    collect interface output
    collect flow sampler
    collect counter bytes long
    collect counter packets long
    collect timestamp absolute first
    collect timestamp absolute last
    collect application name
    collect flow end-reason


The following sample output displays the monitor information about IPv4 traffic netflow configuration using ezPM profile.

Device# show flow monitor temp0-sdwan-fnf-vpn0-monitor_ipv4
Flow Monitor temp0-sdwan-fnf-vpn0-monitor_ipv4:
  Description:       ezPM monitor
  Flow Record:       temp0-sdwan-fnf-vpn0-monitor_ipv4
  Cache:
    Type:                 normal (Platform cache)
    Status:               allocated
    Size:                 5000 entries
    Inactive Timeout:     10 secs
    Active Timeout:       60 secs

    Trans end aging:   off

The following sample output displays the monitor information about IPv6 traffic netflow configuration using ezPM profile.

Device# show flow monitor temp0-sdwan-fnf-vpn0-monitor_ipv6 
Flow Monitor temp0-sdwan-fnf-vpn0-monitor_ipv6:
  Description:       ezPM monitor
  Flow Record:       temp0-sdwan-fnf-vpn0-monitor_ipv6
  Cache:
    Type:                 normal (Platform cache)
    Status:               allocated
    Size:                 5000 entries
    Inactive Timeout:     10 secs
    Active Timeout:       60 secs

    Trans end aging:   off

View Flow Record Cache

The following sample output displays flow record cache for the specified monitor, in this case, temp0-sdwan-fnf-vpn0-monitor_ipv4.

Device# show flow monitor temp0-sdwan-fnf-vpn0-monitor_ipv4 cache 
Cache type:                               Normal (Platform cache)
  Cache size:                                 5000
  Current entries:                              14
  High Watermark:                               14

  Flows added:                                 170
  Flows aged:                                  156
    - Active timeout      (    60 secs)        156

IPV4 SOURCE ADDRESS:       10.0.0.0
IPV4 DESTINATION ADDRESS:  10.255.255.254
TRNS SOURCE PORT:          0
TRNS DESTINATION PORT:     0
FLOW DIRECTION:            Input
IP DSCP:                   0x00
IP PROTOCOL:               1
ipv4 next hop address:     10.0.0.1
tcp flags:                 0x00
interface input:           Gi1
interface output:          Gi2
flow sampler id:           0
counter bytes long:        840
counter packets long:      10
timestamp abs first:       02:55:24.359
timestamp abs last:        02:55:33.446
flow end reason:           Not determined
application name:          layer7 ping
……

The following sample output displays flow record cache for the specified IPv6 monitor, temp0-sdwan-fnf-vpn0-monitor_ipv6.

Device# show flow monitor temp0-sdwan-fnf-vpn0-monitor_ipv6 cache 
Cache type:                               Normal (Platform cache)
  Cache size:                                 5000
  Current entries:                               6
  High Watermark:                                6

  Flows added:                                  10
  Flows aged:                                    4
    - Inactive timeout    (    10 secs)          4

IPV6 SOURCE ADDRESS:       2001:DB8::/32
IPV6 DESTINATION ADDRESS:  2001:DB8::1
TRNS SOURCE PORT:          0
TRNS DESTINATION PORT:     32768
FLOW DIRECTION:            Output
IP DSCP:                   0x00
IP PROTOCOL:               58
ipv6 next hop address:     2001:DB8:1::1
tcp flags:                 0x00
interface input:           Gi2
interface output:          Gi1
flow sampler id:           0
counter bytes long:        2912
counter packets long:      28
timestamp abs first:       02:57:06.025
timestamp abs last:        02:57:33.378
flow end reason:           Not determined
application name:          prot ipv6-icmp

The following sample output displays the flow exporter details.

Device# show flow exporter temp0 
Flow Exporter temp0:
  Description:              performance monitor context temp0 exporter
  Export protocol:          IPFIX (Version 10)
  Transport Configuration:
    Destination type:       IP
    Destination IP address: 10.0.0.1
    VRF label:              1
    Source IP address:      10.0.0.0
    Source Interface:       GigabitEthernet5
    Transport Protocol:     UDP
    Destination Port:       4739
    Source Port:            51242
    DSCP:                   0x1
    TTL:                    255
    Output Features:        Used
  Export template data timeout:        300
  Options Configuration:
    interface-table (timeout 300 seconds) (active)
    vrf-table (timeout 300 seconds) (active)
    sampler-table (timeout 300 seconds) (active)
    application-table (timeout 300 seconds) (active)
    application-attributes (timeout 300 seconds) (active)

Verify Flexible NetFlow Configuration with Export of BFD Metrics

Minimum releases: Cisco IOS XE Catalyst SD-WAN Release 17.10.1a and Cisco Catalyst SD-WAN Control Components Release 20.10.1

The following sample output from the show flow exporter command displays the configuration of each flow exporter:

Device# show flow exporter 
…
Flow Exporter sdwan_flow_exporter_1:
  Description:              export flow records to collector
  Export protocol:          IPFIX (Version 10)
  Transport Configuration:
    Destination type:       IP
    Destination IP address: 10.0.100.1
    Source IP address:      10.0.100.15
    Transport Protocol:     UDP
    Destination Port:       4739
    Source Port:            54177
    DSCP:                   0x0
    TTL:                    255
    MTU:                    1280
    Output Features:        Used
  Options Configuration:
    interface-table (timeout 600 seconds)  (active)
    tunnel-tloc-table (timeout 600 seconds) (active)
    bfd-metrics-table (timeout 600 seconds) (active)

The following sample output from the show flow exporter statistics command displays the client-sent statistics of each flow exporter:

Device# show flow exporter statistics 
…
Flow Exporter sdwan_flow_exporter_1:
  Packet send statistics (last cleared 3d05h ago):
    Successfully sent:         1433                  (907666 bytes)

  Client send statistics:
    Client: Option options interface-table
      Records added:           6552
        - sent:                6552
      Bytes added:             694512
        - sent:                694512

    Client: Option options tunnel-tloc-table
      Records added:           1916
        - sent:                1916
      Bytes added:             99632
        - sent:                99632

    Client: Flow Monitor sdwan_flow_monitor
      Records added:           0
      Bytes added:             0

    Client: Option options bfd-metrics-table
      Records added:           4
        - sent:                4
      Bytes added:             196
        - sent:                196

The following sample output from the show flow exporter templates command displays the details for each template:

Device# show flow exporter templates
…
 Client: Option options tunnel-tloc-table
  Exporter Format: IPFIX (Version 10)
  Template ID    : 257
  Source ID      : 6
  Record Size    : 52
  Template layout
  _____________________________________________________________________________
  |                 Field                   |    ID | Ent.ID | Offset |  Size |
  -----------------------------------------------------------------------------
  | TLOC TABLE OVERLAY SESSION ID           | 12435 |      9 |      0 |     4 |
  | tloc local color                        | 12437 |      9 |      4 |    16 |
  | tloc remote color                       | 12439 |      9 |     20 |    16 |
  | tloc tunnel protocol                    | 12440 |      9 |     36 |     8 |
  | tloc local system ip address            | 12436 |      9 |     44 |     4 |
  | tloc remote system ip address           | 12438 |      9 |     48 |     4 |
  -----------------------------------------------------------------------------

  Client: Option options bfd-metrics-table
  Exporter Format: IPFIX (Version 10)
  Template ID    : 262
  Source ID      : 6
  Record Size    : 49
  Template layout
  _____________________________________________________________________________
  |                 Field                   |    ID | Ent.ID | Offset |  Size |
  -----------------------------------------------------------------------------
  | TLOC TABLE OVERLAY SESSION ID           | 12435 |      9 |      0 |     4 |
  | IP DSCP                                 |   195 |        |      4 |     1 |
  | bfd loss                                | 12527 |      9 |      5 |     4 |
  | bfd pfr update ts                       | 12530 |      9 |      9 |     8 |
  | bfd avg latency                         | 12528 |      9 |     17 |     8 |
  | bfd avg jitter                          | 12529 |      9 |     25 |     8 |
  | bfd rx cnt                              | 12531 |      9 |     33 |     8 |
  | bfd tx cnt                              | 12532 |      9 |     41 |     8 |
  -----------------------------------------------------------------------------