The documentation set for this product strives to use bias-free language. For the purposes of this documentation set, bias-free is defined as language that does not imply discrimination based on age, disability, gender, racial identity, ethnic identity, sexual orientation, socioeconomic status, and intersectionality. Exceptions may be present in the documentation due to language that is hardcoded in the user interfaces of the product software, language used based on RFP documentation, or language that is used by a referenced third-party product. Learn more about how Cisco is using Inclusive Language.
The intent of the Dashboard is to enable network and storage administrators to focus on particular areas of concern around the health and performance
of data center switching. This information is provided as 24-hour snapshots.
The functional view of LAN switching consists of seven dynamic dashlets that display information in the context of the selected
scope by default.
The various scopes that are available on the Cisco Nexus Dashboard Fabric Controller Web UI are:
Overview
From the left menu bar, choose Dashboard > Overview. The Overview window displays the default dashlets. The dashlets display donuts summary.
The following are the default dashlets that appear in the Overview dashboard window:
Dashlet
Description
Fabric Health
Displays the fabric health status, and a number in the donut depicting total number of fabrics. The Fabric Health status is based on the severity of the highest outstanding alarm for the fabric or its member switches.
Events Analytics
Displays events with Critical, Error, and Warning severity.
Switches Configuration
Displays the switches inventory summary information such as the switch models and the corresponding count.
Switches
Switch Health
Displays the switches health summary with the corresponding count. The Switch Health status is based on the severity of the highest outstanding alarm for the switch or its interfaces.
Switch Roles
Displays the switches roles summary and the corresponding count. Displays the number of access, spine and leaf devices.
Switch Hardware Version
Displays the switches models and the corresponding count.
Switch Software Version
Displays the switches software version and the corresponding count.
Performance Collector
Displays the performance collection information.
Click Stop collector to stop performance collection information.
Click Start collector to restart the performance collection information.
Reports
Displays switch reports.
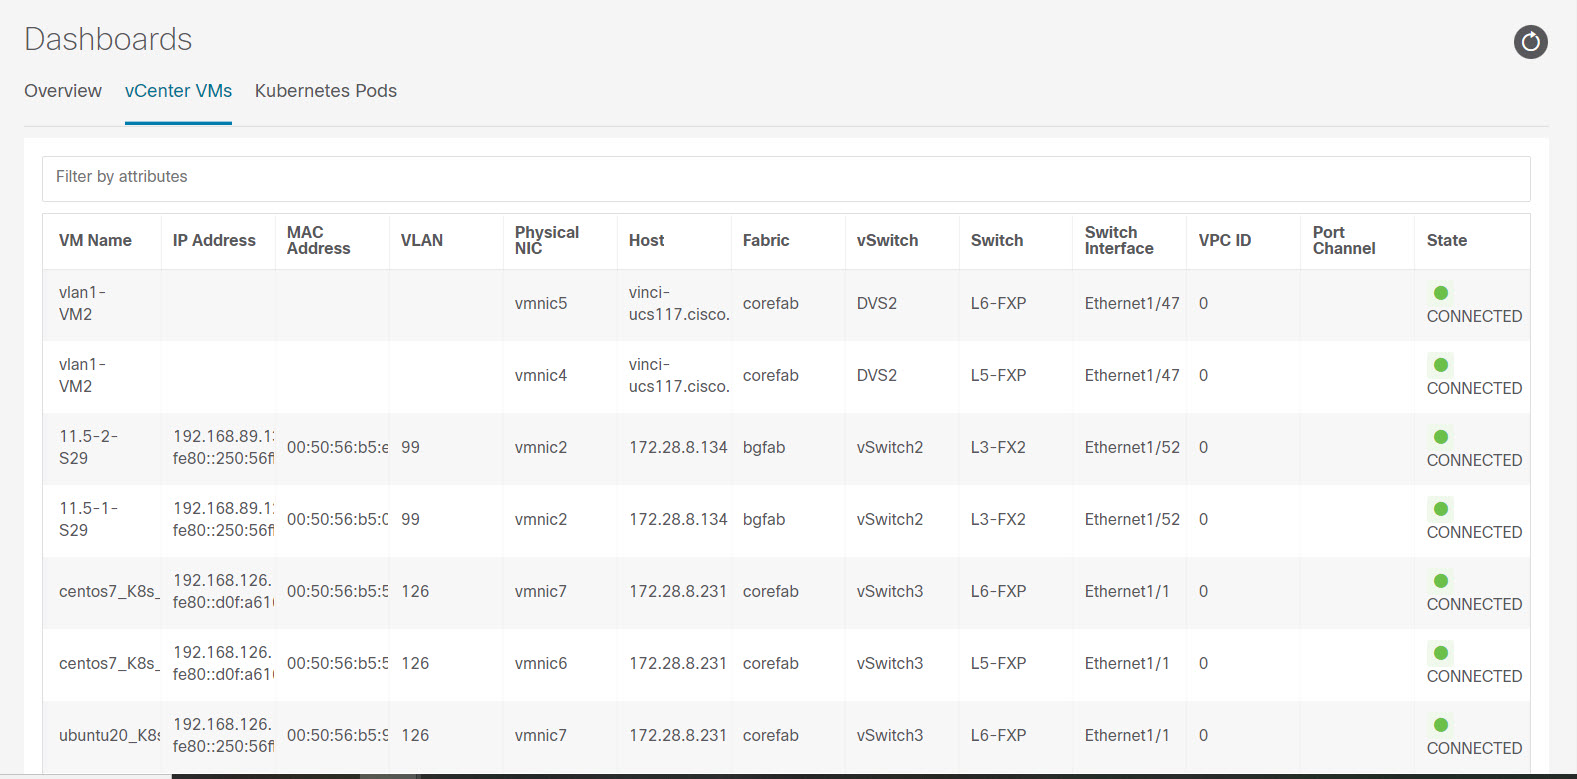
Viewing vCenter VMs
UI Path: Dashboard > vCenter VMs
Note
You can view the Virtual Machine details for the added vCenter cluster on dashboard and topology window. Navigate Dashboard > vCenter VMs.
The vCenter VMs tab displays the following details of VMs:
VM Name, its IP address and MAC address
Name of the compute where the VM is hosted
Switch name that is connected to a VM, switch’s IP address, MAC address, and interface
Port channel ID and vPC ID (if connected to a VPC)
VLAN VM configured on
Power state of the VM
Physical NIC of the Compute host
You can search and filter VMs by using filter by attributes search field.
To view VMs on Fabric window, navigate to LAN > Fabrics, double-click on required fabric. On Fabric Overview window, choose Virtual Infrastructure > Virtual Machine VMs.
To view VMs on Switch window, navigate to LAN > Switches, double click on required switch. On Switch Overview window, choose Virtual Infrastructure > Virtual Machine VMs.
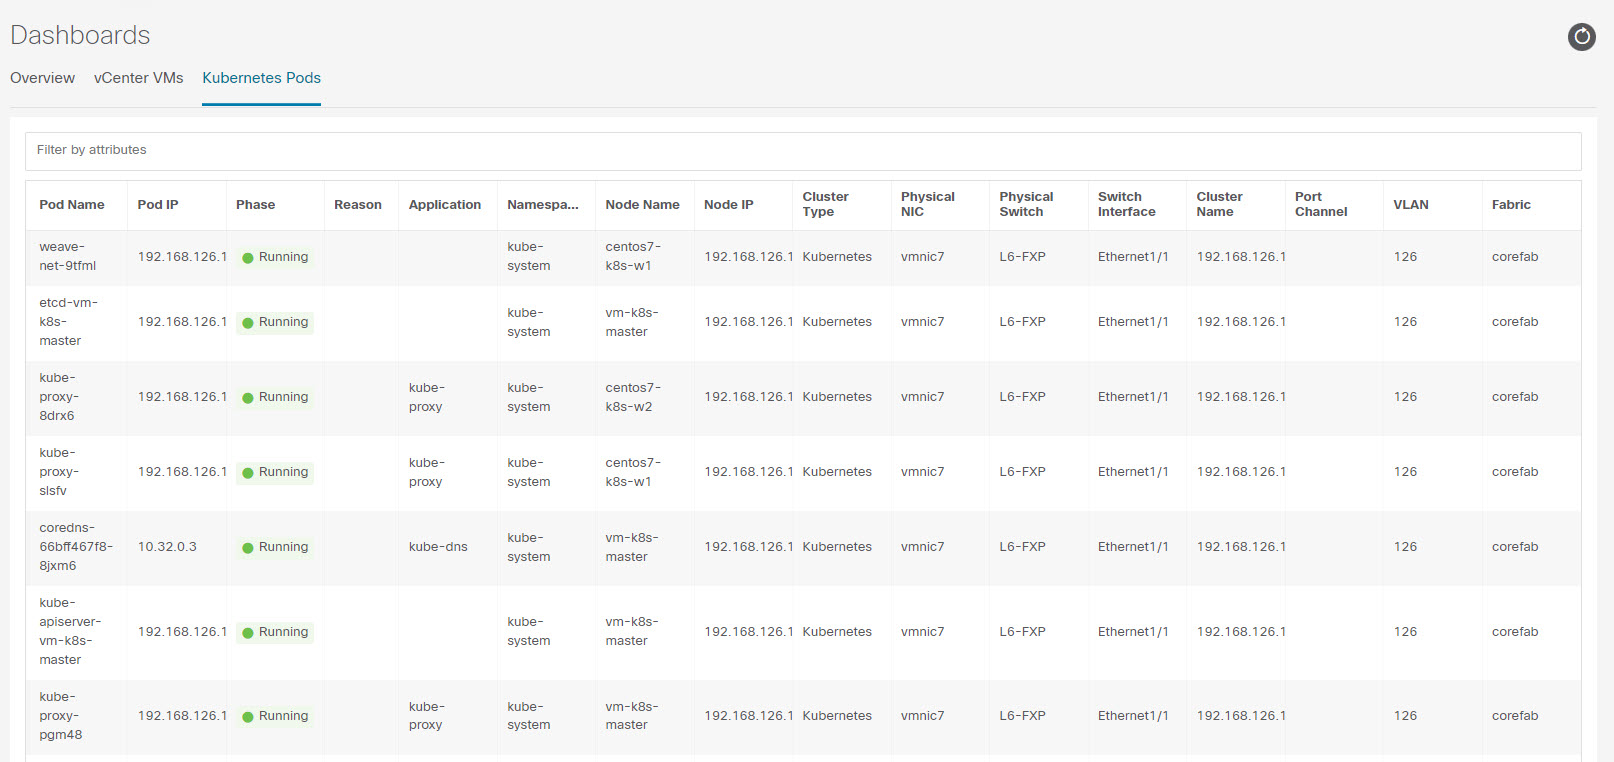
Viewing Kubernetes Pods
UI Path: Dashboard > Kubernetes Pods
You can view Kubernetes pods on Fabrics window, navigate LAN > Fabrics, double-click on required fabric, it navigates to Fabric Overview window, click Virtual Infrastructure > Kubernetes Pods.
You can view Kubernetes pods on Switch window, navigate LAN > Switches, double-click on required switch, it navigates to Switch Overview window, click Virtual Infrastructure > Kubernetes Pods.
You can search and filter kubernetes pods by using filter by attributes search field.
The following table describes the fields and description on the window.
Field
Description
Pod Name
Specifies the name of the Kubernetes pod.
Pod IP
Displays the IP address of the Kubernetes pod.
Phase
Specifies the phase (state) of the pod.
Reason
Specifies the reason.
Applications
Specifies the applications of the pod.
Namespace
Specifies the namespace of the pod.
Node Name
Specifies the node name of the pod.
Node IP
Specifies the node IP address.
Cluster Type
Displays the type of cluster.
Physical NIC
Displays the physical NIC of the node.
Physical Switch
Specifies the physical switch connected to cluster node.
Switch Interface
Specifies the switch interface connected to cluster node.
Cluster Name
Specifies the name of the cluster.
Port Channel
Specifies the port channel (if cluster node is connected to a VPC).
VLAN
Specifies the VLAN.
Fabric
Specifies the fabric name.
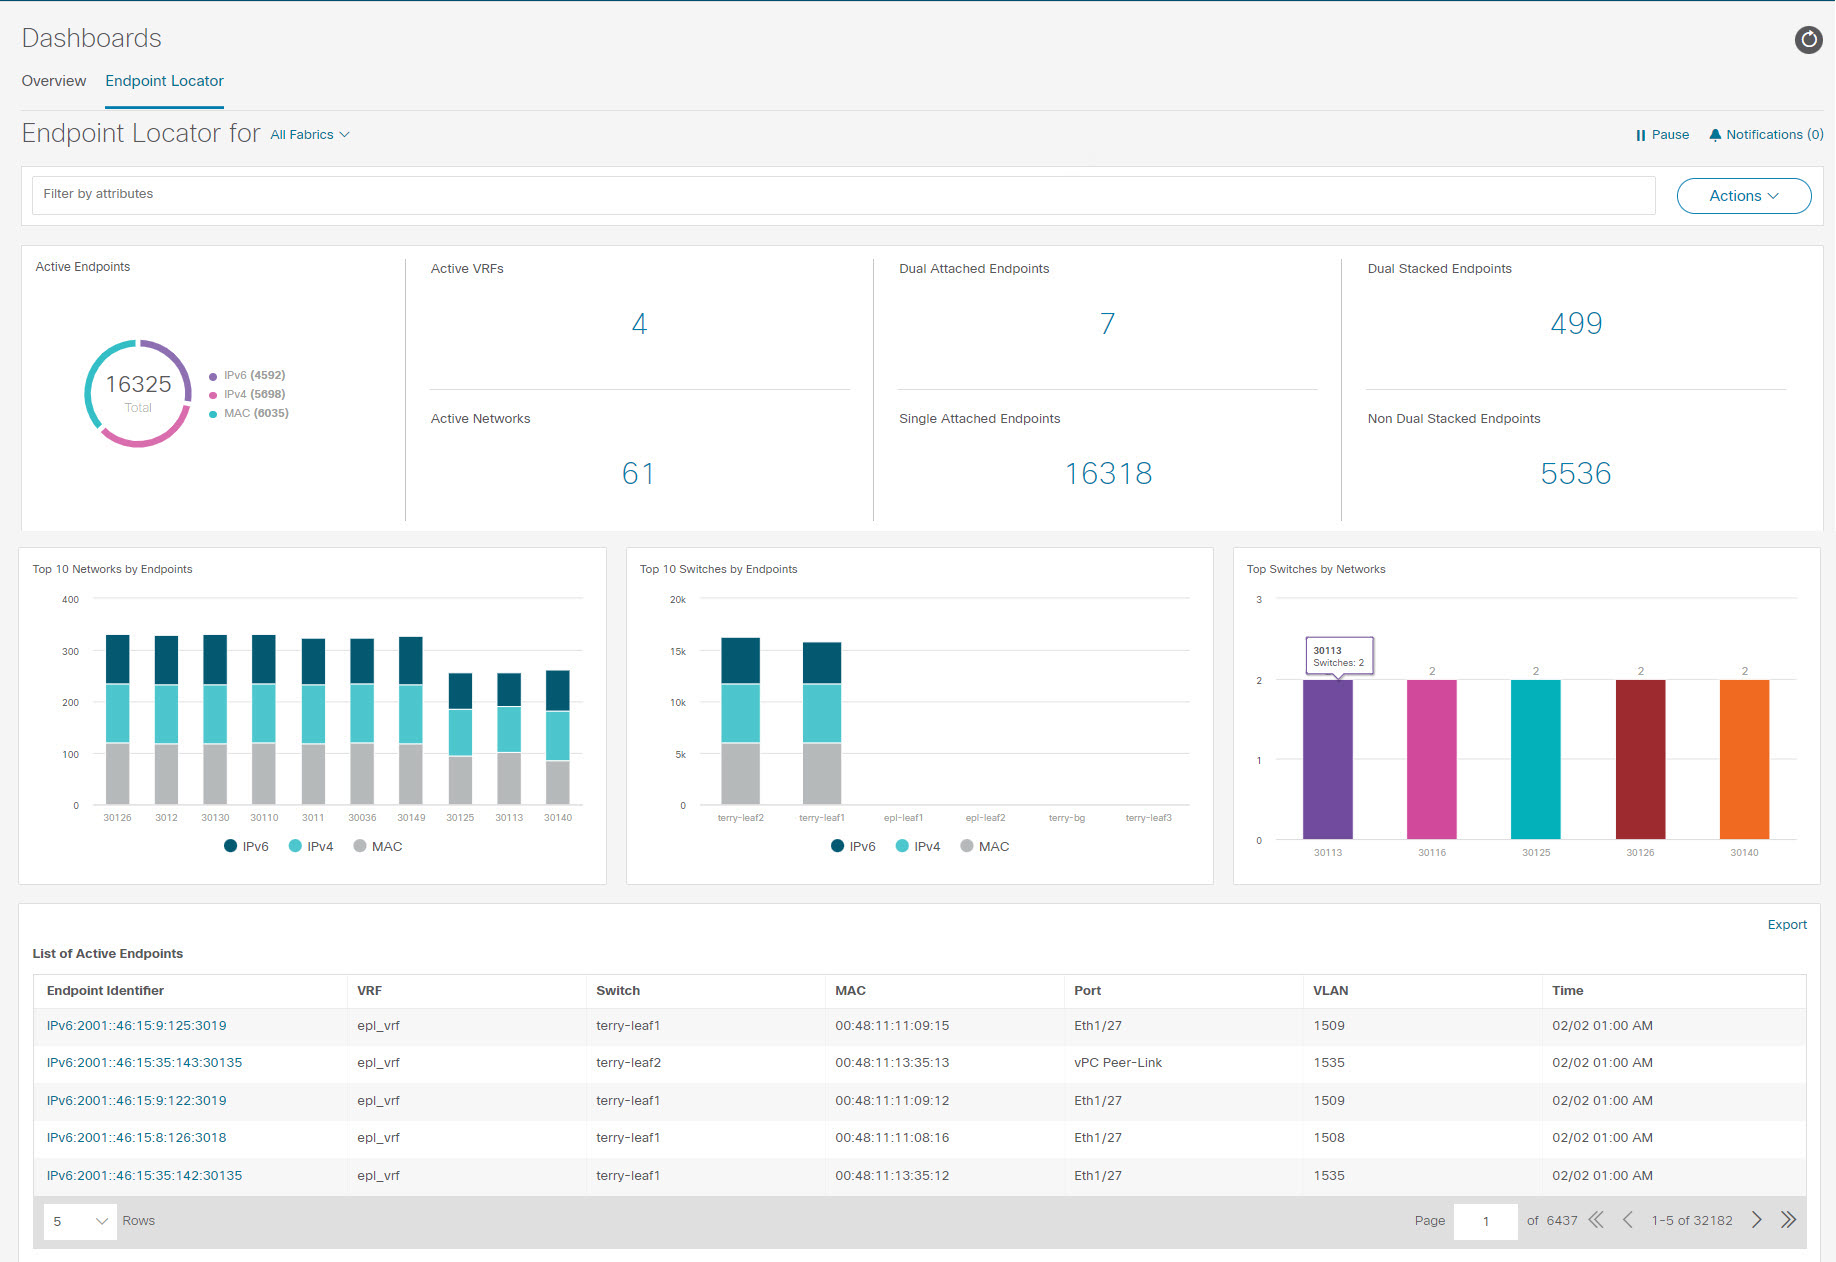
Endpoint Locator Dashboard
To explore endpoint locator details from the Cisco Nexus Dashboard Fabric Controller Web UI, choose Dashboard > Endpoint Locator. The Endpoint Locator dashboard is displayed.
Note
Due to an increase in scale, the system may take some time to collect endpoint data and display it on the dashboard. On bulk
addition or removal of endpoints, the endpoint information displayed on the EPL dashboard takes a few minutes to refresh and
display the latest endpoint data.
You can initiate a search by using the available options in the filter by attributres search bar field.
You can also filter and view the endpoint locator details for a specific Switch, VRF, Network, and Type by using the respective drop-down lists. You can select MAC type of endpoints as a filter attribute. The name of the network
is also displayed in the Network drop-down list. By default, the selected option is All for these fields. You can display endpoint data for a specific device by entering the host IP address, MAC address, or the
name of the virtual machine in the Search Host IP/MAC/VM Name field.
You can click All fabrics drop-down list to view endpoint locator details for all fabrics or required fabric.
An alarm is generated if there are any endpoint related anomalies. Click the Pause icon to temporarily stop the near real-time collection and display of data. By default Run is chosen. Click Notification icon to view the notification details.
Click Actions > Endpoint Search. For more information, refer to Endpoint Search.
Click Actions > Endpoint Life. For more information, refer to Endpoint Life.
Click Actions > Resync to syncing to the data currently in the Route Reflector (RR). However, historical data is preserved. We recommend not clicking
Resync multiple times as this is a compute-intense activity.
In certain scenarios, the datapoint database may go out-of-sync and information, such as the number of endpoints, is not displayed
correctly due to network issues such as:
Endpoint moves under the same switch between ports and the port information needs some time to be updated.
An orphan endpoint is attached to the second VPC switch and is no longer an orphan endpoint.
NX-API not enabled initially and then enabled at a later point in time.
NX-API failing initially due to misconfiguration.
Change in Route Reflector (RR).
Management IPs of the switches are updated.
Click Notifications icon to display a list of the most recent notifications.
The Endpoint Locator Notifications window appears.
Information such as the time at which the notification was generated, the description of the notification, severity level
is displayed.
Notifications are generated for events such as duplicate IP addresses, duplicate MAC-Only addresses, VRF disappears from a
fabric, all endpoints disappear from a switch, endpoint moves, endpoints on a fabric going to zero, when endpoints are attached
to a switch, when a new VRF is detected, and when the RR BGP connectivity status changes. The RR connected status indicates
that the Nexus Dashboard Fabric Controller can connect to the RR through BGP (Nexus Dashboard Fabric Controller and RR are BGP neighbors). The RR disconnected status indicates that the RR is disconnected and the underlying BGP is not
functioning.
You can initiate a search by using the available options in the filter by attributres search bar field.
The top pane of the window displays the following information:
The top pane of the window displays the number of active endpoints, active VRFs, active networks, dual attached endpoints,
single attached endpoints and dual stacked endpoints, for the selected scope. Support for displaying the number of dual attached
endpoints, single attached endpoints and dual stacked endpoints has been added. A dual attached endpoint is an endpoint that
is behind at least two switches. A dual stacked endpoint is an endpoint that has at least one IPv4 address and one IPv6 address.
Historical analysis of data is performed and a statement mentioning if any deviation has occurred or not over the previous
day is displayed at the bottom of each tile.
Click any tile in the top pane of the EPL dashboard to go to the Endpoint History window.
The 'middle pane' of the window displays the following information:
Top 10 Networks by Endpoints - A pie chart is displayed depicting the top ten networks that have the most number of endpoints. Hover over the pie chart
to display more information. Click on the required section to view the number of IPv4, IPv6, and MAC addresses.
Top 10 Switches by Endpoints - A pie chart is displayed depicting the top ten switches that are connected to the most number of endpoints. Hover over
the pie chart to display more information. Click on the required section to view the number of IPv4, IPv6, and MAC addresses.
Top Switches by Networks - Bar graphs are displayed depicting the number of switches that are associated with a particular network. For example, if
a vPC pair of switches is associated with a network, the number of switches associated with the network is 2.
The 'bottom pane' of the window displays the list of active endpoints.
If a virtual machine has been configured, the name of the VM is displayed in the Node Name field. Note that it can take up to 15 minutes for the name of the VM to be reflected in the EPL dashboard. Until then, the
EPL dashboard displays No DATA in the Node Name field.
Click Export to download the list of active endpoints in .csv format.
Click on required endpoint identifier, a slide-in pane appears and the related details are displayed. Click Endpoint Life. The Endpoint Life window appears for selected endpoint identifier. For more information, refer to Endpoint Life.
Click the search icon in the Endpoint Identifier column to search for specific IP addresses.
Consider a scenario in which EPL is first enabled and the Process MAC-Only Advertisements checkbox is selected. Then, EPL is disabled and enabled again without selecting the Process MAC-Only Advertisements checkbox. As the cache data in elasticsearch is not deleted on disabling of EPL, the MAC endpoint information is still displayed
in the EPL dashboard. The same behavior is observed when a Route-Reflector is disconnected. Depending on the scale, the endpoints
are deleted from the EPL dashboard after some time. In certain cases, it may take up to 30 minutes to remove the older MAC-only
endpoints. However, to display the latest endpoint data, you can click Resync.
Endpoint History
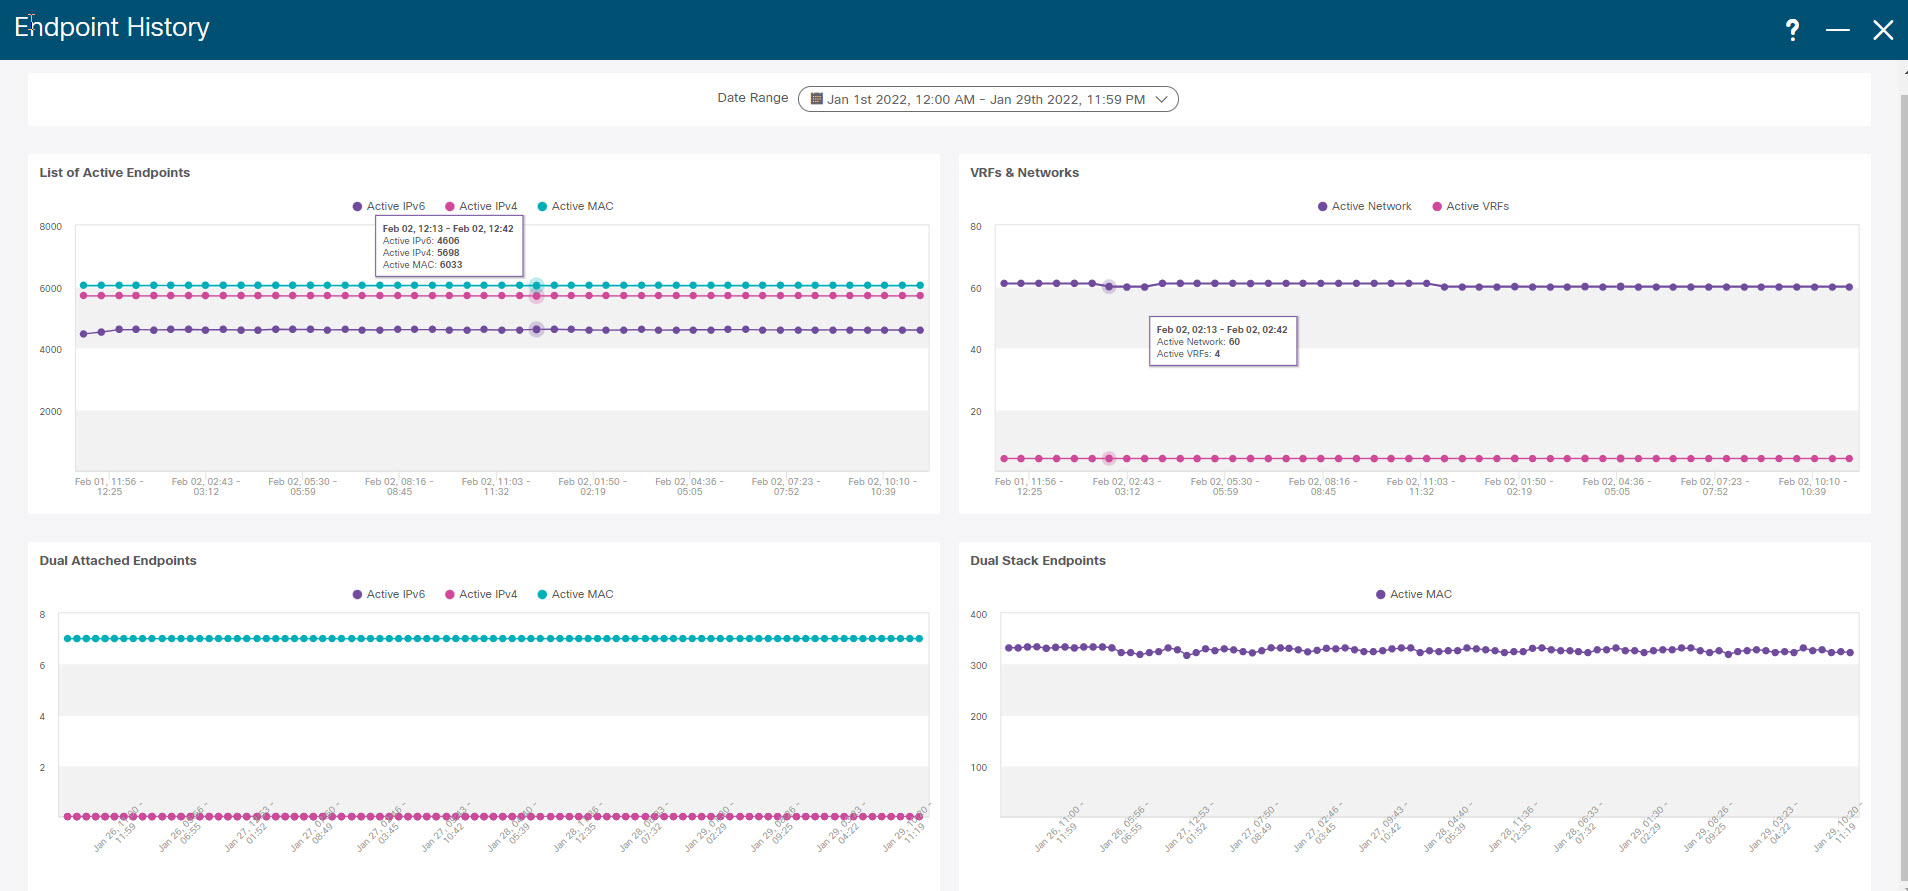
Click any tile in the top pane of the EPL dashboard to go to the Endpoint History window. A graph depicting the number of active endpoints, VRFs and networks, dual attached endpoints and dual stacked MAC
endpoints at various points in time is displayed. The graphs that are displayed here depict all the endpoints and not only
the endpoints that are present in the selected fabric. Endpoint history information is available for the last 30 days amounting
to a maximum of 100 GB storage space.
Hover over the graph at specific points to display more information. The points in the graph are plotted at 30-minute intervals.
You can also display the graph for a specific requirement by clicking the color-coded points at the bottom of each graph.
For example, click on all color-coded points other than active (IPv4) in the Active Endpoints window displayed above such that only active (IPv4) is highlighted and the other points are not highlighted. In such a scenario, only the active IPv4 endpoints are displayed
on the graph. You can also click on the required color-coded points at the bottom of the graph to display the graph for a
specific requirement. For example, hover over active (IPv4) to display only the active IPv4 endpoints on the graph.
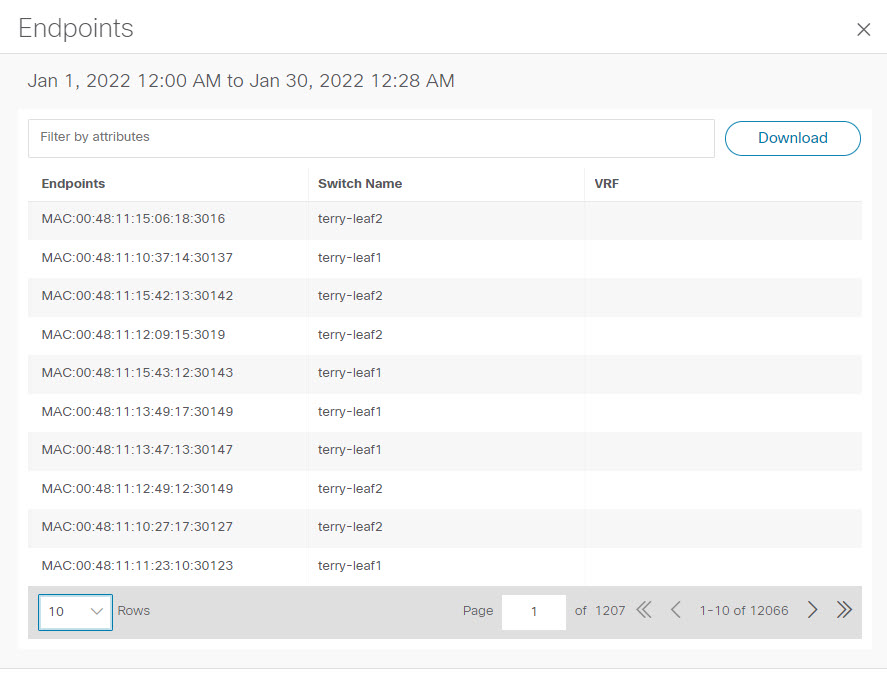
Click on any point in the graph to display a window that has detailed information about that point of time. For example, click
on a specific point in the Active Endpoints graph to display the Endpoints window. This window has information about the endpoints along with the name of the switch and the VRF associated with the
endpoint. Click Download to download the data as a CSV file.
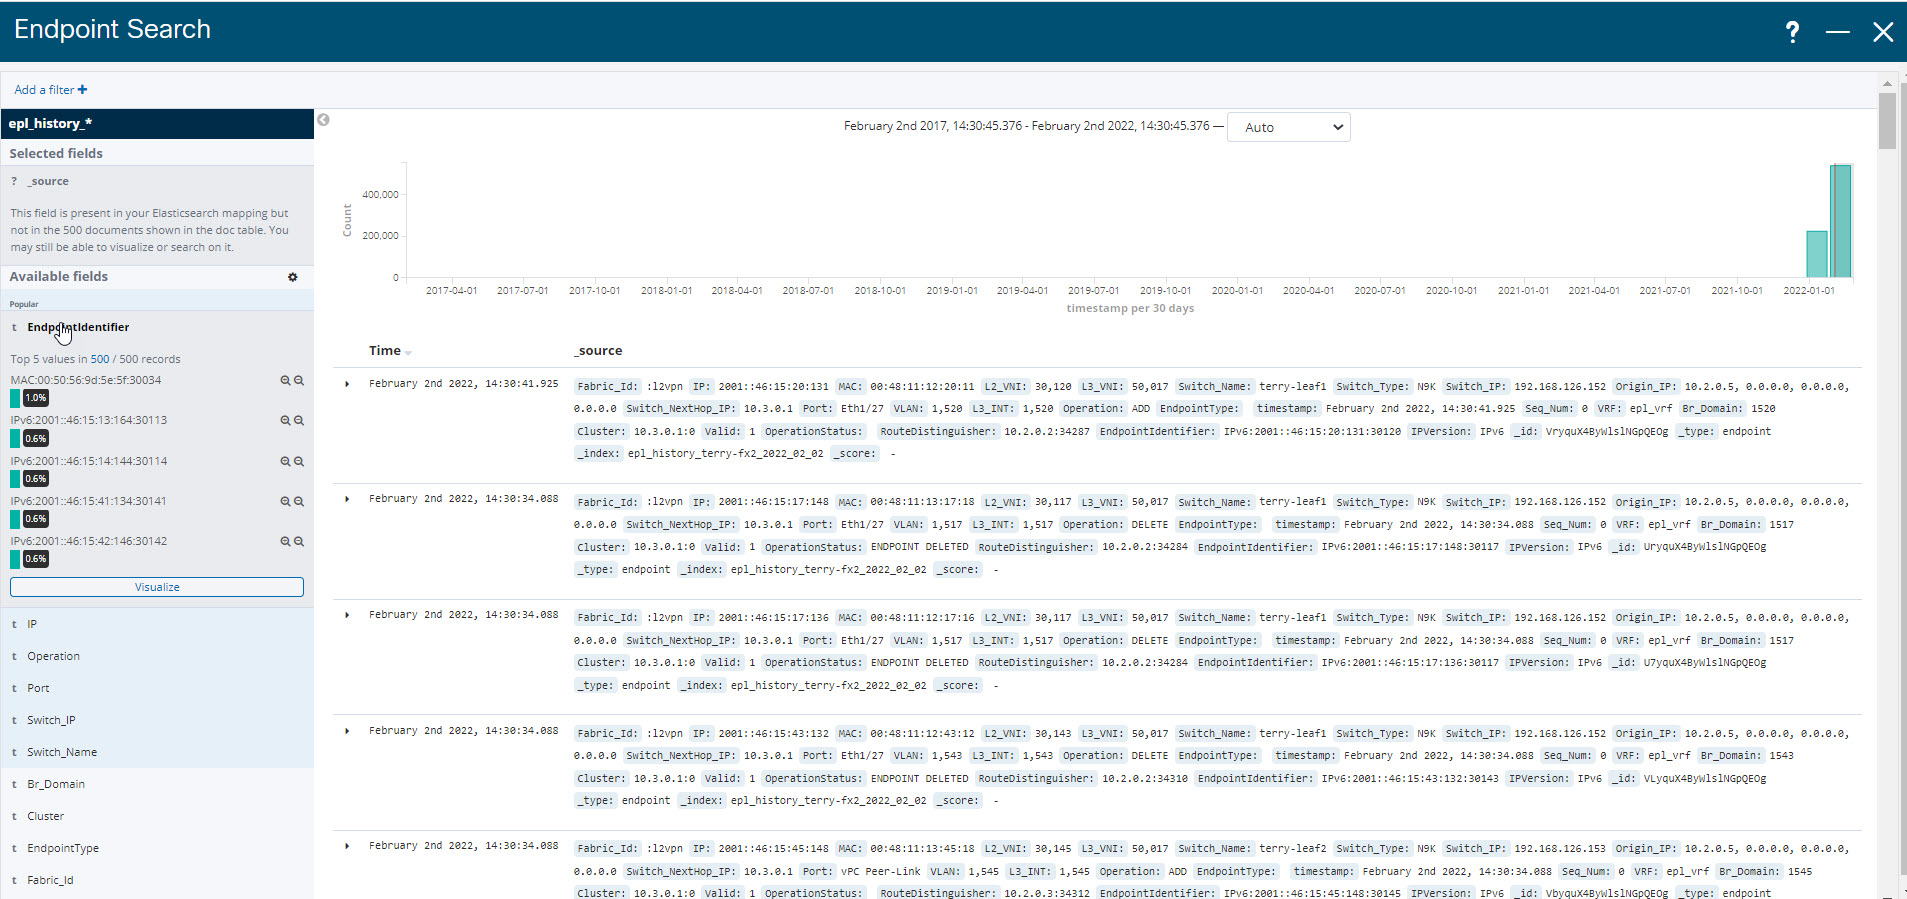
Endpoint Search
UI Path: Dashboard > Endpoint Locator.
On Endpoint Locator window, click Actions > Endpoint Search to view a real-time plot displaying endpoint events for the period specified in a date range.
Note
You cannot change time on the clock icon. Ignore the tooltip to change the time.
The results displayed here are dependent on the fields listed under Selected fields located in the menu on the left. You can add any field listed under Available fields to Selected fields to initiate a search using the required fields.
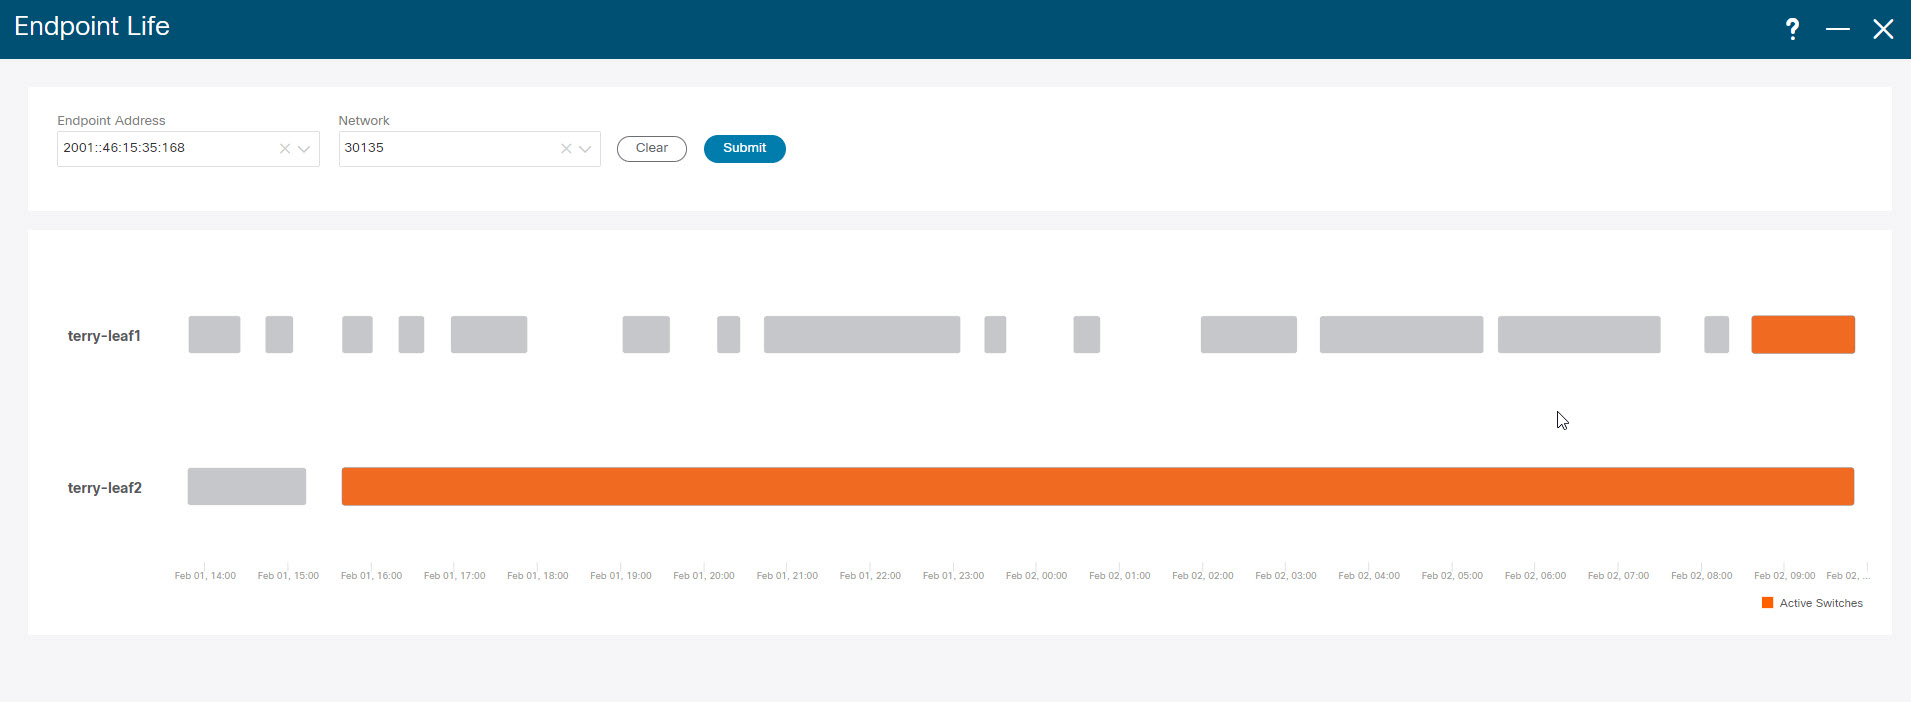
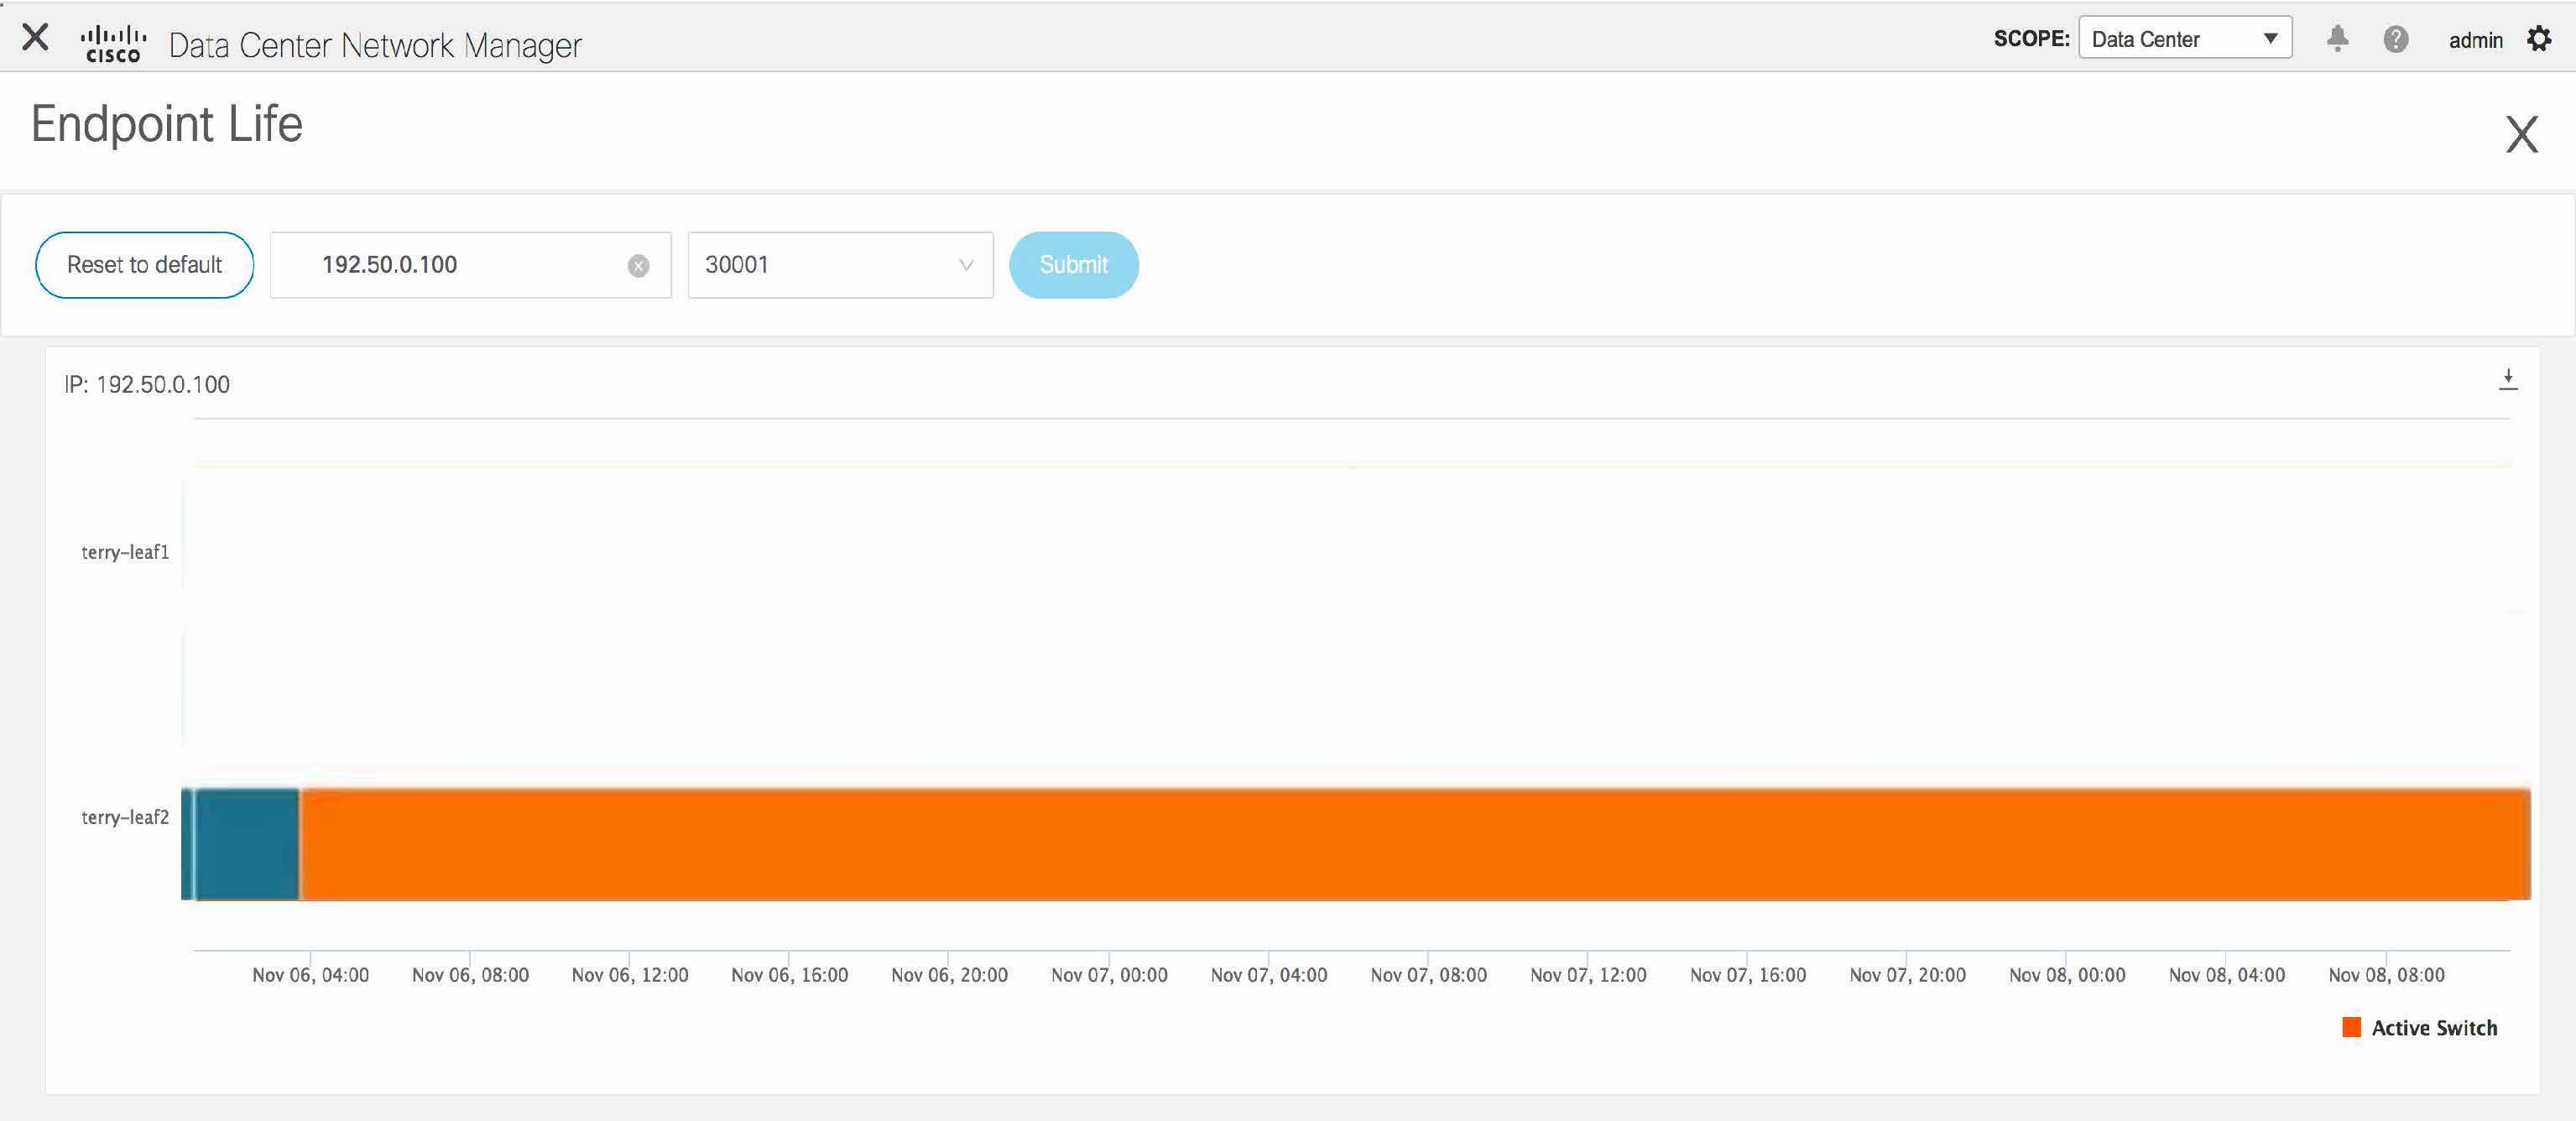
Endpoint Life
Click Actions > Endpoint Life to display a time line of a particular endpoint in its entire existence within the fabric.
Specify the IP or MAC address of an endpoint and the VXLAN Network Identifier (VNI) to display the list of switches that an
endpoint was present under, including the associated start and end dates. Click Submit.
Initiate a search by using an IPv4 or IPv6 address to display the Endpoint Life graph for IPv4/IPv6 endpoints. Initiate a search by using a MAC address to display the Endpoint Life graph for MAC-Only endpoints.
The window that is displayed is essentially the endpoint life of a specific endpoint. The bar that is orange in color represents
the active endpoint on that switch. If the endpoint is viewed as active by the network, it will have a band here. If an endpoint
is dual-homed, then there will be two horizontal bands reporting the endpoint existence, one band for each switch (typically
the vPC pair of switches). In case the endpoints are deleted or moved, you can also see the historical endpoint deletions
and moves on this window.

 Feedback