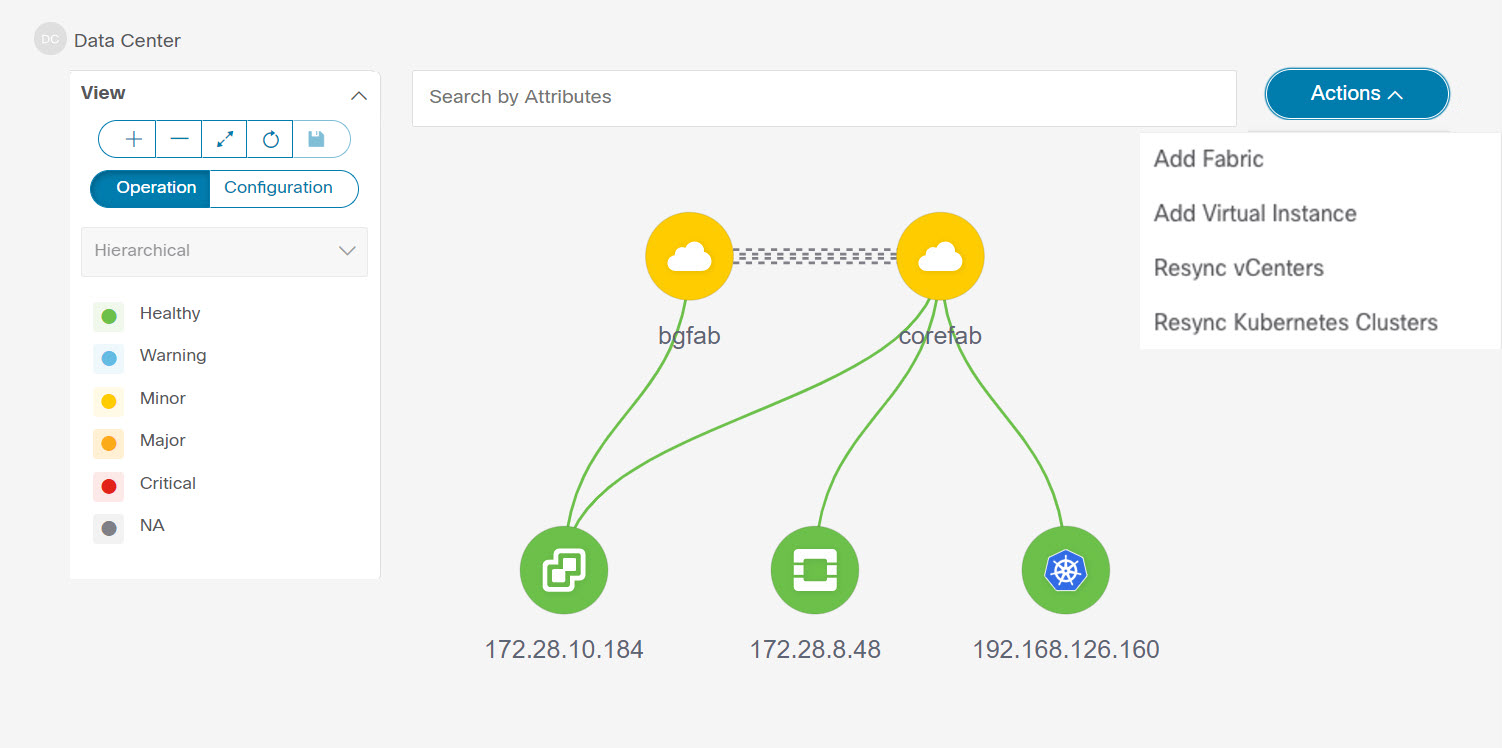
UI Navigation - Click Topology.
This section provides information about various elements or entities displayed in the Topology window for SAN fabrics.
VSAN
In the Topology window, double-click on the fabric to view the fabric topology. A SAN fabric contains VSAN node and switches. The VSAN node
has a number displayed in brackets, which indicates the number of VSANs in the fabric. Double-click on the VSAN node to view
the individual VSANs in the VSAN node topology.
The VSAN topology displays zones and switches connected to the VSAN. Double-click on a VSAN to open the VSAN topology and
view the zones and switches. However, the switches must have the VSAN configured and have links with VSAN membership.
Zone
Double-click on the VSAN node, VSAN zone is displayed. The switches in that VSAN and a Zones node show the number of zones.
Double click on that zones node, which displays individual zone nodes. Double click on zone node display switches in that
zone and its connectivity (ISL) with end devices that are a member of the selected zone.
Hosts and Storage
The zone topology displays hosts and storage devices pertaining to the zone and connected to a switch. In the Topology window, double-click on a zone to view hosts and storage devices.
Alternatively, to view the switch topology, you can directly click on a switch in the fabric topology. The switch topology
displays the hosts and storage devices connected to the switch.
Hosts
Click on the host device to view more information about the host in the slide-in pane. From the slide-in pane, you can open
the host dashboard. Alternatively, you can right-click on the host device and click Detailed View to open the host dashboard.
Storage
Click on the storage device to view more information about storage in the slide-in pane. From the slide-in pane, you can open
the storage dashboard. Alternatively, you can right-click on the storage device and click Detailed View to open the storage dashboard.
Links
In the switch topology, click on the link that connects two devices, for example, the switch and the storage to open the Link slide-in pane. This pane displays the details related to the last polling of the performance data. However, you must have
configured performance monitoring for the fabric in Performance Data Collection Settings. This allows the Nexus Dashboard Fabric Controller to collect the traffic information and the aggregated information is displayed along with a graph showing traffic utilization.
The Nexus Dashboard Fabric Controller updates the last poll metric every 5 minutes for all the ports, links, and so on for all the switches in the fabric. If the
date and time displayed in this pane is current, then the last poll metric details are up to date. The details provided in
this slide-in pane are as follows:
-
General information such as link capacity, VSAN, and status.
-
Information about the traffic for the last 24 hours with details such as average, maximum, and minimum Rx and Tx in Bytes.
-
The last poll metrics such as Time, Rx, and Tx can be viewed in a graph on the Graph tab and in a table format on the Table tab. Note that the table is paginated.


 Feedback