Platform Overview
Cisco Nexus Dashboard is a central management console for multiple data center sites and a common platform for hosting Cisco data center operation applications, such as Nexus Dashboard Insights and Nexus Dashboard Orchestrator. These applications are universally available for all the data center sites and provide real time analytics, visibility, and assurance for network policies and operations. Cisco Nexus Dashboard Orchestrator can also run on Nexus Dashboard as a hosted app.
Nexus Dashboard provides a common platform and modern technology stack for these micro-services-based applications, simplifying the life cycle management of the different modern applications and reducing the operational overhead to run and maintain these applications. It also provides a central integration point for external 3rd party applications with the locally hosted applications.
Each Nexus Dashboard cluster consists of 3 master nodes. In addition, you can provision a number of worker nodes to enable horizontal scaling and standby nodes for easy cluster recovery in case of a master node failure. More information about extending your cluster with additional nodes is available in Infrastructure Management.
Hardware vs Software Stack
Nexus Dashboard is offered as a cluster of specialized Cisco UCS servers (Nexus Dashboard platform) with the software framework (Nexus Dashboard) pre-installed on it. The Cisco Nexus Dashboard software stack can be decoupled from the hardware and deployed in a number of virtual form factors. For the purposes of this document, we will use "Nexus Dashboard platform" specifically to refer to the hardware and "Nexus Dashboard" to refer to the software stack and the GUI console.
This guide describes how to use the Nexus Dashboard; for hardware installation, see Nexus Dashboard Hardware Installation Guide and for deployment planning and Nexus Dashboard software installation, see the Nexus Dashboard Deployment Guide.
Available Form Factors
This release of Cisco Nexus Dashboard can be deployed using a number of different form factors. Keep in mind however, you must use the same form factor for all nodes, mixing different form factors within the same cluster is not supported.
-
Cisco Nexus Dashboard physical appliance (.iso)
This form factor refers to the original physical appliance hardware that you purchased with the Cisco Nexus Dashboard software stack pre-installed on it.
The later sections in this document describe how to configure the software stack on the existing physical appliance hardware to deploy the cluster. Setting up the original Cisco Nexus Dashboard platform hardware is described in Cisco Nexus Dashboard Hardware Setup Guide.
-
VMware ESX (.ova)
Virtual form factor that allows you to deploy a Nexus Dashboard cluster using VMware ESX virtual machines with one of two resource profiles:
-
Data node — node profile designed for data-intensive applications, such Nexus Dashboard Insights
-
App node — node profile designed for non-data-intensive applications, such Nexus Dashboard Orchestrator
-
-
Linux KVM (.qcow2)
Virtual form factor that allows you to deploy a Nexus Dashboard cluster using Linux KVM virtual machines.
-
Amazon Web Services (.ami)
Cloud form factor that allows you to deploy a Nexus Dashboard cluster using AWS instances.
-
Microsoft Azure (.arm)
Cloud form factor that allows you to deploy a Nexus Dashboard cluster using Azure instances.
Cluster Sizing Guidelines
Nexus Dashboard supports co-hosting of applications. Depending on the type and number of applications you choose to run, you may be required to deploy additional worker nodes in your cluster. For cluster sizing information and recommended number of nodes based on specific use cases, see the Nexus Dashboard Capacity Planning tool.
Adding worker nodes to your cluster is described in Managing Worker Nodes.
Supported Services
For the full list of supported applications and the associated compatibility information, see the Data Center Networking Services Compatibility Matrix.
Network Connectivity
Nexus Dashboard is deployed as a cluster, connecting each service node to two networks. When first configuring Nexus Dashboard, you will need to provide two IP addresses for the two Nexus Dashboard interfaces-—one connected to the Data Network and the other to the Management Network.
This section describes the purpose and functionality of the networks as they are used by the Nexus Dashboard services. Individual applications installed in the Nexus Dashboard may utilize the two networks for additional purposes, so we recommend consulting the specific application’s documentation in addition to this document for your deployment planning.
Data Network
The data network is used for:
-
Nexus Dashboard node clustering
-
Application to application communication
-
Nexus Dashboard nodes to Cisco APIC nodes communication
For example, the network traffic for the Nexus Dashboard Insights service.
Management Network
The management network is used for:
-
Accessing the Nexus Dashboard GUI
-
Accessing the Nexus Dashboard CLI via SSH
-
DNS and NTP communication
-
Nexus Dashboard firmware upload
-
Cisco DC App Center (AppStore)
If you want to use the Nexus Dashboard App Store to install applications as described in Services Management, the https://dcappcenter.cisco.com page must be reachable via the Management Network.
-
Intersight device connector
Data and Management Network Requirements
The two networks have the following requirements:
-
The following table summarizes service-specific requirements for the management and data networks.

Note
 Changing the data subnet requires redeploying the cluster, so we recommend using a larger subnet than the bare minimum required by the nodes and services to account for any additional services in the future. In addition to the requirements listed in this section, ensure that you consult the Release Notes for the specific service you plan to deploy.
Allocating persistent IP addresses is done after the cluster is deployed using the External Service Pools configuration in the UI, as described in the Cisco Nexus Dashboard User Guide.
We recommend consulting the specific service’s documentation for any additional requirements and caveats related to persistent IP configuration.
Nexus Dashboard Service Management Interface Data Interface Persistent IPs Support for Data and Management in the same subnet Nexus Dashboard Orchestrator
Layer 3 adjacent
Layer 3 adjacent
N/A
Yes
However, we recommend separate subnets for the two networks
Nexus Dashboard Insights for ACI fabrics
Layer 3 adjacent
Layer 3 adjacent
N/A
Yes
However, we recommend separate subnets for the two networks
Nexus Dashboard Insights for DCNM fabrics
Layer 3 adjacent
Layer 2 adjacent
6 IPs in data interface network if using IPv4
7 IPs in data interface network if using IPv6
No
Nexus Dashboard Insights with SFLOW/NetFlow (ACI or DCNM)
Layer 3 adjacent
Layer 2 adjacent
6 IPs in data interface network
No
Nexus Dashboard Fabric Controller
Layer 2 adjacent
Layer 2 adjacent
One of the following:
— 2 IPs in management network if using the default LAN Device Management Connectivity setting
— 2 IPs in data network if setting LAN Device Management Connectivity to
Data. Plus 1 IP per fabric for EPL in data networkNo
-
For physical clusters, the management network must provide IP reachability to each node’s CIMC via TCP ports 22/443.
Nexus Dashboard cluster configuration uses each node’s CIMC IP address to configure the node.
-
For Nexus Dashboard Insights service, the data network must provide IP reachability to the in-band network of each fabric and of the APIC.
-
For Nexus Dashboard Insights and AppDynamics integration, the data network must provide IP reachability to the AppDynamics controller.
-
For Nexus Dashboard Orchestrator service, the data network can have in-band and/or out-of-band IP reachability for Cisco APIC sites but must have in-band reachability for Cisco DCNM sites.
-
The data network interface requires a minimum MTU of 1500 to be available for the Nexus Dashboard traffic.
Higher MTU can be configured if desired.
-
Connectivity between the nodes is required on both networks with the following additional round trip time (RTT) requirements.
Note
You must always use the lowest RTT requirement when deploying the Nexus Dashboard cluster and applications. For example, if you plan to co-host the Insights and Orchestrator services, site connectivity RTT must not exceed 50ms.
Application Connectivity Maximum RTT Nexus Dashboard cluster
Between nodes
150 ms
Nexus Dashboard Orchestrator service
Between nodes
150 ms
To sites
500 ms
Nexus Dashboard Insights service
Between nodes
50 ms
To sites
50 ms
Nexus Dashboard Fabric Controller service
Between nodes
50 ms
To sites
50 ms
Internal Networks
Two additional internal networks are required for communication between the containers used by the Nexus Dashboard:
-
Application overlay is used for applications internally within Nexus Dashboard
Application overlay must be a /16 network.
-
Service overlay is used internally by the Nexus Dashboard.
Service overlay must be a /16 network.
Note that communications between containers deployed in different Nexus Dashboard nodes is VXLAN-encapsulated and uses the data interfaces IP addresses as source and destination. This means that the Application Overlay and Service overlay addresses are never exposed outside the data network and any traffic on these subnets is routed internally and does not leave the cluster nodes. For example, if you had another service (such as DNS) on the same subnet as one of the Overlay networks, you would not be able to access it from your Nexus Dashboard as the traffic on that subnet would never be routed outside the cluster. As such, when configuring these networks, ensure that they are unique and do not overlap with any existing networks or services you may need to access from the Nexus Dashboard cluster nodes.
Communication Ports
The following ports are required by the Nexus Dashboard cluster and its applications:
| Service | Port | Protocol | Direction | Connection |
|---|---|---|---|---|
|
ICMP |
ICMP |
ICMP |
In/Out |
Other cluster nodes, CIMC, default gateway |
|
SSH |
22 |
TCP |
In/Out |
CLI and CIMC of the cluster nodes |
|
TACACS |
49 |
TCP |
Out |
TACACS server |
|
DNS |
53 |
TCP/UDP |
Out |
DNS server |
|
HTTP |
80 |
TCP |
Out |
Internet/proxy |
|
NTP |
123 |
UDP |
Out |
NTP server |
|
HTTPS |
443 |
TCP |
In/Out |
UI, other clusters (for multi-cluster connectivity), fabrics, Internet/proxy |
|
LDAP |
389 |
TCP |
Out |
LDAP server |
|
Radius |
1812 |
TCP |
Out |
Radius server |
|
KMS |
9880 |
TCP |
In/Out |
Other cluster nodes and ACI fabrics |
|
Infra-Service |
30012 |
TCP/UDP |
In/Out |
Other cluster nodes |
| Service | Port | Protocol | Direction | Connection |
|---|---|---|---|---|
|
SSH |
22 |
TCP |
Out |
Inband of switches and APIC |
|
HTTPS |
443 |
TCP |
Out |
Inband of switches and APIC/NDFC/DCNM |
|
VXLAN |
4789 |
TCP |
In/Out |
Other cluster nodes |
|
KMS |
9880 |
TCP |
In/Out |
Other cluster nodes and ACI fabrics |
|
Infra-Service |
3379 |
TCP |
In/Out |
Other cluster nodes |
|
Kafka |
30001 |
TCP |
In/Out |
Inband of switches and APIC/NDFC/DCNM |
|
Infra-Service |
30016 |
TCP/UDP |
In/Out |
Other cluster nodes |
|
Infra-Service |
30500-30600 |
TCP/UDP |
In/Out |
Other cluster nodes |
| Service | Port | Protocol | Direction | Connection |
|---|---|---|---|---|
|
Show Techcollection |
2022 |
TCP |
In/Out |
Inband of switches and APIC/NDFC/DCNM |
|
SW Telemetry |
5640-5671 |
UDP |
In |
Inband of switches |
|
TAC Assist |
8884 |
TCP |
In/Out |
External |
|
KMS |
9989 |
TCP |
In/Out |
Other cluster nodes and ACI fabrics |
|
Flow Telemetry |
5695 |
TCP |
In/Out |
Other cluster nodes |
Fabric Connectivity
You can connect the Nexus Dashboard cluster to your fabrics in two ways:
-
The Nexus Dashboard cluster connected to the fabric via a Layer 3 network.
-
The Nexus Dashboard nodes connected to the leaf switches as typical hosts.
Physical Node Cabling
If you deployed a virtual or cloud form factor cluster, you can skip this section.
The following figure shows the Nexus Dashboard physical node interfaces:
-
eth1-1andeth1-2must be connected to the Management network -
eth2-1andeth2-2must be connected to the Data network
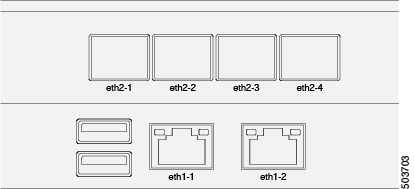
The interfaces are configured as Linux bonds: one for the data interfaces and one for the management interfaces. All interfaces must be connected to individual host ports, PortChannel or vPC are not supported.
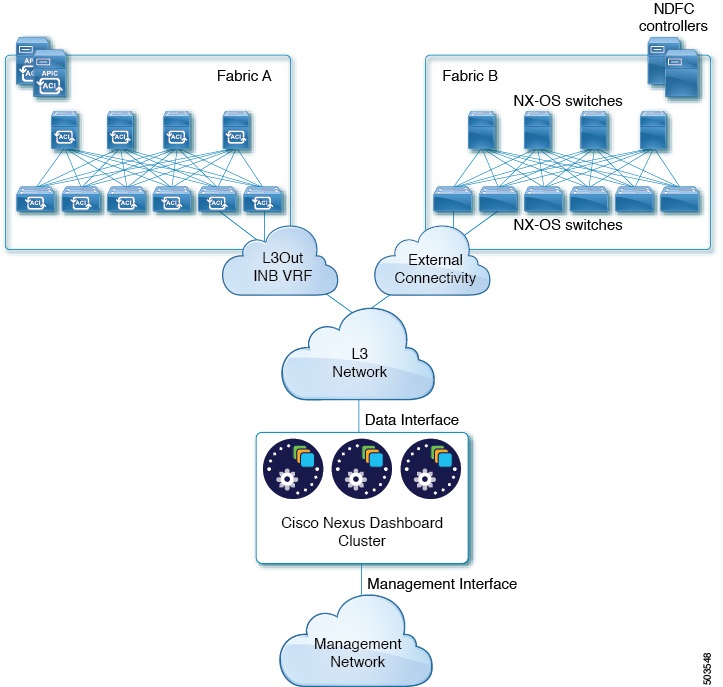
Connecting via External Layer 3 Network
Connectivity depends on the type of applications deployed in the Nexus Dashboard:
-
If you are deploying Nexus Dashboard Orchestrator to manage Cisco ACI fabrics only, you can establish connectivity from the data interface to either the in-band or out-of-band (OOB) interface of each site’s APIC.
-
If you are deploying Nexus Dashboard Orchestrator to manage Cisco NDFC or DCNM fabrics, you must establish connectivity from the data interface to the in-band interface of each site’s DCNM.
-
If you are deploying Nexus Dashboard Insights or Network Assurance Engine, you must establish connectivity from the data interface to the in-band network of each fabric.
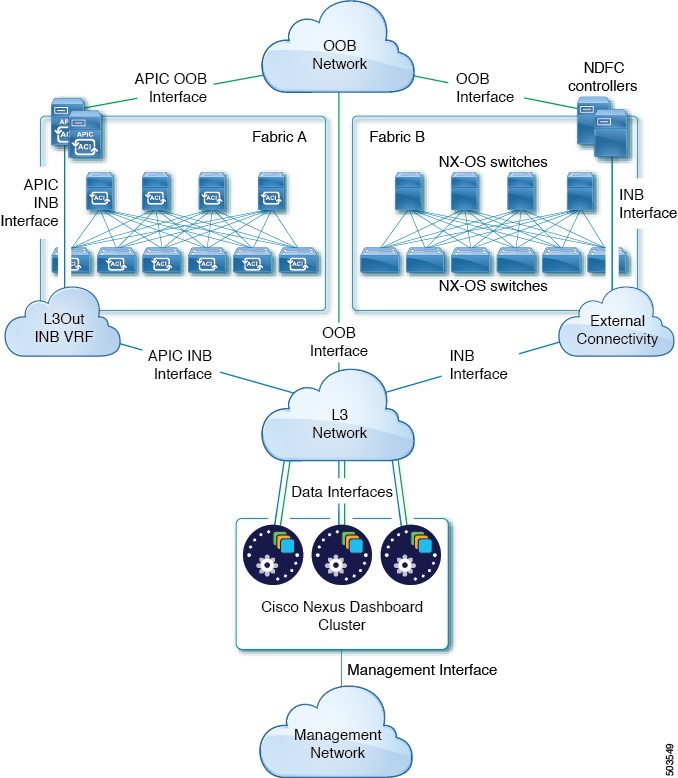
If you plan to connect the cluster across an external Layer 3 network, keep the following in mind:
-
For ACI fabrics, you must configure an L3Out and the external EPG for Cisco Nexus Dashboard data network connectivity in the management tenant.
Configuring external connectivity in an ACI fabric is described in Cisco APIC Layer 3 Networking Configuration Guide.
-
For DCNM Fabrics, if the data interface and DCNM’s in-band interface are in different subnets, you must add a route to the Nexus Dashboard’s data network on DCNM.
You can add the route from the DCNM UI by navigating to Administration > Customization > Network Preference > In-Band (eth2), then adding the route and saving.
-
If you specify a VLAN ID for your data interface during setup of the cluster, the host port must be configured as trunk allowing that VLAN.
However, in most common deployments, you can leave the VLAN ID empty and configure the host port in access mode.
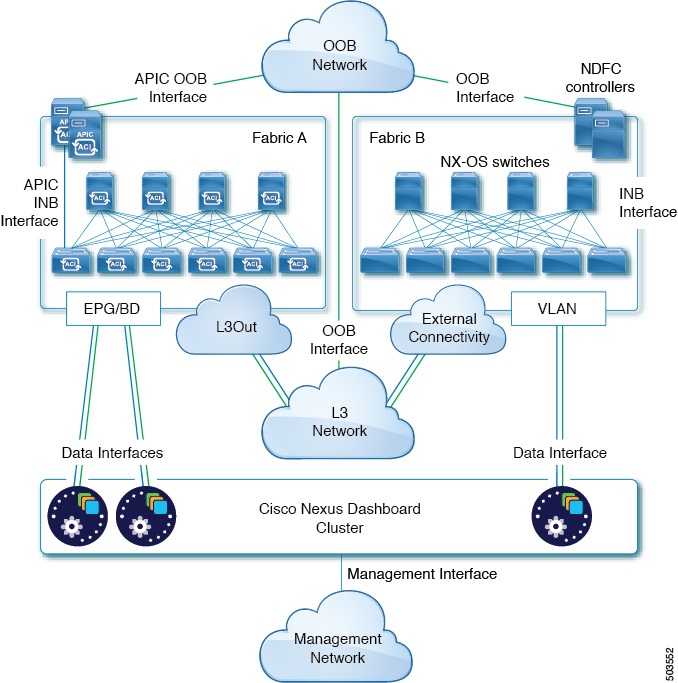
The following two figures show two distinct network connectivity scenarios when connecting the Nexus Dashboard cluster to the fabrics via an external Layer 3 network. The primary purpose of each depends on the type of application you may be running in your Nexus Dashboard.
Note that the "L3 Network" and the "Management Network" can be the same network infrastructure, for example in case the Nexus Dashboard nodes have the management and data network interfaces in the same subnet.
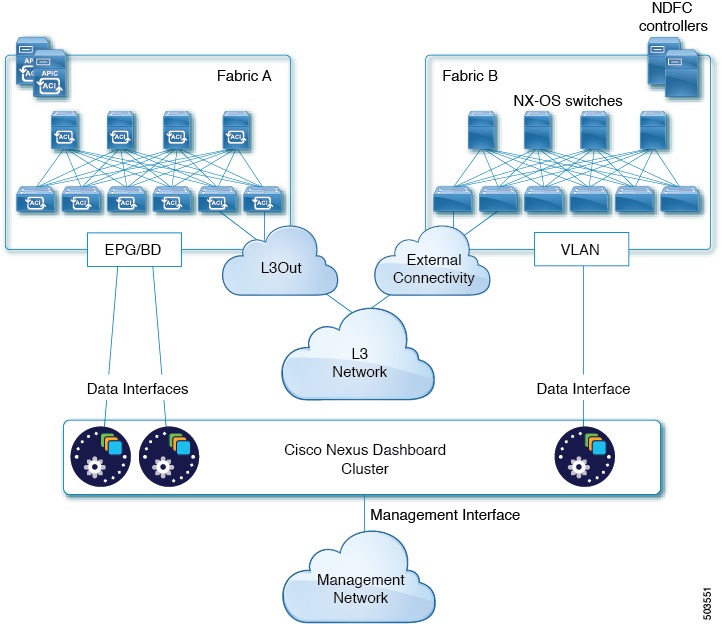
Connecting the Nodes Directly to Leaf Switches
Like in the previous example, connectivity depends on the type of applications deployed in the Nexus Dashboard:
-
If you are deploying Nexus Dashboard Orchestrator to manage Cisco ACI fabrics only, you can establish connectivity from the data interface to either the in-band or out-of-band (OOB) interface of each site’s APIC
-
If you are deploying Nexus Dashboard Insights or Network Assurance Engine, you must establish connectivity from the data interface to the in-band interface of each fabric.
For ACI fabrics, the data interface IP subnet connects to an EPG/BD in the fabric and must have a contract established to the local in-band EPG in the management tenant. We recommend deploying the Nexus Dashboard in the management tenant and in-band VRF. Connectivity to other fabrics is established via an L3Out.
-
If you are deploying Nexus Dashboard Insights with ACI fabrics, the data interface IP address and the ACI fabric’s in-band IP address must be in different subnets.
If you plan to connect the cluster directly to the leaf switches, keep the following in mind:
-
For ACI fabrics, we recommend configuring the bridge domain (BD), subnet, and endpoint group (EPG) for Cisco Nexus Dashboard connectivity in management tenant.
Because the Nexus Dashboard requires connectivity to the in-band EPG in the in-band VRF, creating the EPG in the management tenant means no route leaking is required.
-
For ACI fabrics, you must create a contract between the fabric’s in-band management EPG and Cisco Nexus Dashboard EPG.
-
If you specify a VLAN ID for your data network during setup of the cluster, the Nexus Dashboard interface and the port on the connected network device must be configured as trunk
However, in most cases we recommend not assigning a VLAN to the data network, in which case you must configure the ports in access mode.
-
For ACI fabrics, if several fabrics are monitored with apps on the Services Engine cluster, L3Out with default route or specific route to other ACI fabric in-band EPG must be provisioned and a contract must be established between the cluster EPG and the L3Out’s external EPG.
The following two figures show two distinct network connectivity scenarios when connecting the Nexus Dashboard cluster directly to the fabrics' leaf switches. The primary purpose of each depends on the type of application you may be running in your Nexus Dashboard.
Note that the "L3 Network" and the "Management Network" can be the same network infrastructure, for example in case the Nexus Dashboard nodes have the management and data network interfaces in the same subnet.
 Feedback