Infrastructure Management
Cluster Configuration
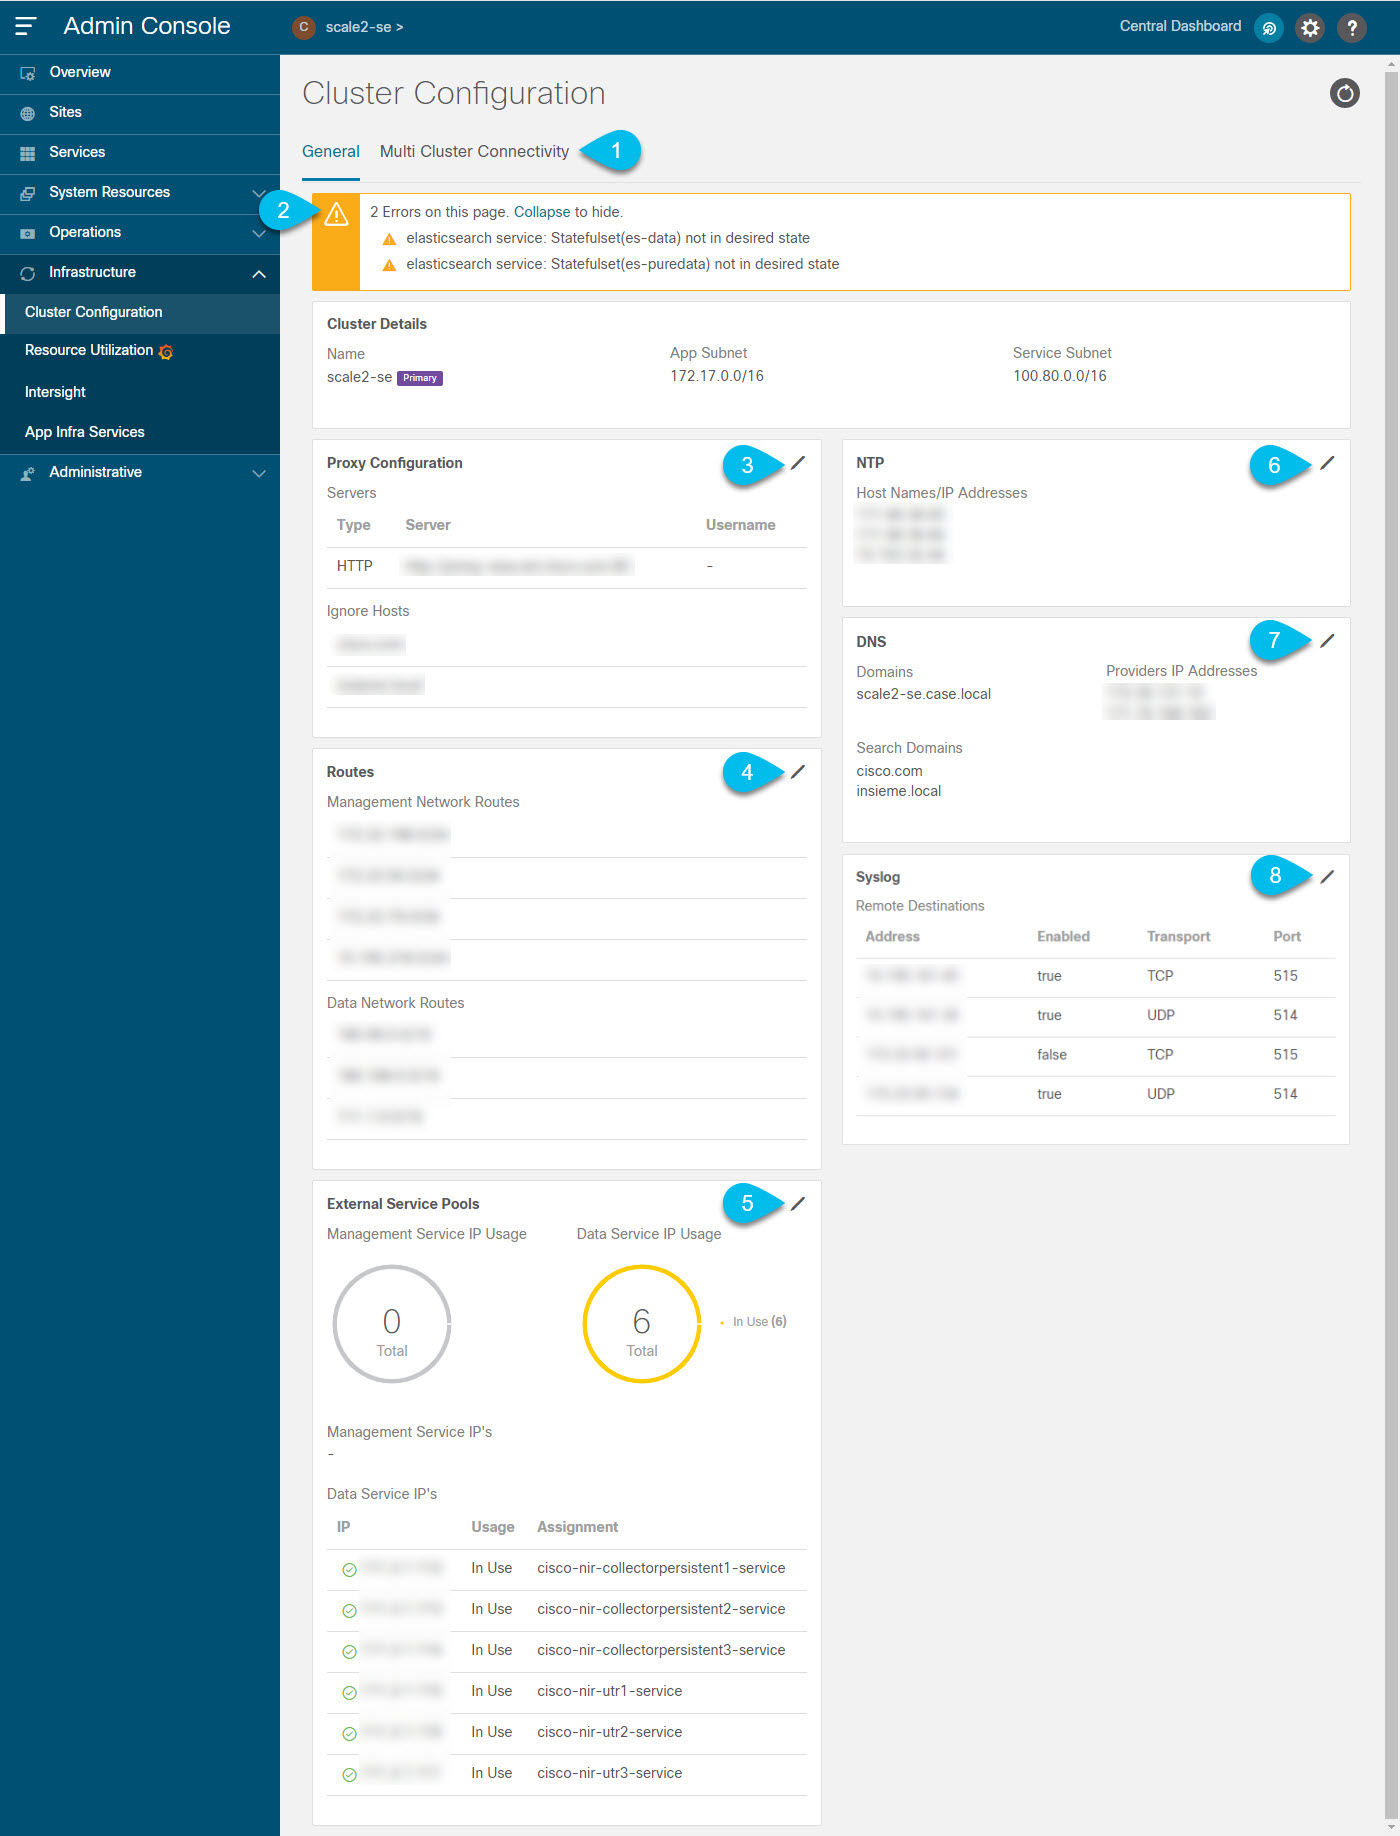
The cluster configuration GUI screen allows you to configure a number of options specific to the Nexus Dashboard cluster and its nodes. It will also display information about any issues that may be present in your Nexus Dashboard cluster.

Note ![]() Only IPv4 addresses are supported for any of the following cluster configuration IP settings.
Only IPv4 addresses are supported for any of the following cluster configuration IP settings.
-
The Multi-cluster Connectivity tab allows you to connect multiple clusters together for a single pane of glass view and administration of the clusters and their sites, services, and configurations.
For more information, see Multi-Cluster Connectivity.
-
The errors and warning tile will display the number of existing issues in your cluster. You can click Expand to see the full list of specific issues.
-
To configure a proxy for the Nexus Dashboard, click the Edit icon in the Proxy Configuration tile.
In certain deployment scenarios, such as with a combination of on-premises and cloud sites and the Nexus Dashboard cluster deployed inside a corporate network, you may have to access the Internet and the cloud sites through a proxy.
Note
 This release supports adding a single proxy server.
To add a proxy server:
-
Click +Add Server in the proxy configuration window.
-
From the Type dropdown, select the type of traffic that you want to be proxied.
-
In the Server field, provide the full address for the proxy server including the port if required.
For example
http://proxy.company.com:80. -
If the server requires login credentials, provide the Username and Password.
-
-
(Optional) Click Add Ignore Host to provide any hosts that will ignore the proxy.
You can add one or more hosts with which the cluster will communicate directly bypassing the proxy.
-
To add one or more Management Network or Data Network routes, click the Edit icon in the Routes tile.
Here you can define static routes for the management or data interfaces. For example, adding
10.195.216.0/21as a Data Network route will cause all traffic destined to that subnet to transit out of the data network interface.-
To add a management network route, click Add Management Network Routes and provide the destination subnet.
-
To add a data network route, click Add Data Network Routes and provide the destination subnet.
-
-
To add one or more External Service Pools, click the Edit icon in the External Service Pools tile.
This allows you to provide persistent IP addresses for applications that require to retain the same IP addresses even in case it is relocated to a different Nexus Dashboard node.
Services like Nexus Dashboard Insights require some services (such as SNMP trap, syslog, SAN Insights, and others) to stream data from the switches in your fabrics to the application. An IP address is configured on the switches for this purpose. Typically, if the IP address changes when the application is relocated, the application services will reconfigure the new IP address on the switches.
In order to avoid this IP reconfiguration impact on the fabric switches, the application can request that the services IP addresses are preserved, in which case you will need to define a set of IP addresses which can be assigned to the application for this purpose.
If a service requires persistent IP addresses, you will not be able to enable that application in the Nexus Dashboard until enough IP addresses are defined as described below.
Note
This feature is supported for Nexus Dashboard Insights with DCNM fabrics only. Also, if your Nexus Dashboard is deployed in VMware ESX, you must enable promiscuous mode for both management and data network interface portgroups, as described in https://kb.vmware.com/s/article/1004099.
In the External Service Pools screen that opens, you can click one of the +Add IP Address buttons to add one or more IP addresses for the management or data networks. Note that you must add individual IP addresses one by one; adding a range of IP addresses is not supported.
The IP addresses you add for management services must be part of the management subnet and the IP addresses for data services must be part of the data subnet.
You can also remove any previously defined IPs, but you will not be able to remove any IPs that are currently in use by application services.
-
To configure NTP settings, click the Edit icon in the NTP tile.
By default, the NTP server that you configured when deploying the Nexus Dashboard cluster is listed here.
You can provide additional NTP servers by clicking +Add NTP Server.
You can remove existing NTP server by clicking the Delete icon next to it. Keep in mind that at least one NTP server must be configured in your cluster.
-
To configure DNS settings, click the Edit icon in the DNS tile.
By default, the DNS server and search domain that you configured when deploying the Nexus Dashboard cluster are listed here.
You can provide additional DNS servers and search domains by clicking +Add a Provider or +Add a Search Domain respectively.
You can remove existing DNS server by clicking the Delete icon next to it.
-
To provide one or more
syslogservers to stream event logs to, click the Edit icon in the Syslog tile.In the Syslog dialog that opens, click +Add Remote Destinations to add a new server. Then provide the IP address, protocol, and port number for the server and choose whether you want to enable streaming to this syslog server at this time.
The events that are exported to the provided syslog servers are also viewable directly in your Nexus Dashboard GUI as described in Event Analytics.
Multi-Cluster Connectivity
This release of Nexus Dashboard allows you to establish connectivity between multiple Nexus Dashboard clusters for a single pane of glass cluster administration, as well as access to any of the sites and services running on any of the connected clusters.
When you add a second cluster, a group of clusters is formed. The cluster from which you create the group becomes the "primary" cluster with a number of unique characteristics that do not apply to other clusters in the group:
-
You must use the primary cluster to connect all additional clusters.
-
You must use the primary cluster to remove any of the clusters from the group.
Establishing multi-cluster connectivity does not create any single databases with information from all clusters in the group. Every cluster continues to maintain its own configuration databases, while simultaneously being able to function as a proxy for all other clusters in the group regardless of which cluster an action or request is originated from or destined to.
Guidelines and Limitations
The following guidelines apply when configuring multi-cluster connectivity:
-
This release supports multi-cluster connectivity between clusters deployed using physical or virtual (ESX) form factors only. In other words, you can join physical Nexus Dashboard clusters with virtual (ESX) clusters, but you cannot join virtual (KVM) or cloud clusters into the same group.
-
Connectivity must be established between all nodes of all clusters, which will be connected via multi-cluster connectivity.
-
This release supports up to 4 clusters connected together.
-
This release supports up to 12 sites across all clusters that are connected together.
-
The primary cluster, which you use to establish multi-cluster connectivity, must be running the same or later release of Nexus Dashboard as any other cluster in the group.
In other words, you cannot connect a Nexus Dashboard cluster running release 2.1.2 from a primary cluster that is running release 2.1.1.
If you are upgrading multiple clusters that are connected together, you must upgrade the primary cluster first.
-
Multi-Cluster connectivity and One View are supported for remote users only.
If you connect multiple clusters, but then login to one of the clusters as a local
adminuser, you will only be able to view and manage the local cluster into which you logged in.To view and manage all clusters in the group, you must login as a remote user that is configured on all clusters.
-
Nexus Dashboard Insights service in each cluster can view site groups from other Insights services across any cluster in the group.
However, when creating site groups, each Insights service can add sites which are onboarded in the same cluster where the service is installed only.
-
Nexus Dashboard Orchestrator service supports managing only sites which are onboarded in the same cluster where the service is installed.
Connecting Multiple Clusters
-
You must have familiarized yourself with the information provided in the Guidelines and Limitations section.
-
You must have set up remote authentication and users on all clusters which you plan to connect.
Multi-Cluster connectivity and One View are supported for remote users only, so you must configure the same remote user with
adminprivieleges for all clusters. For additional details, see Remote Authentication.
To connect another cluster:
-
Log in to the Nexus Dashboard GUI of the cluster which you want to designate as the primary.
-
Add second cluster.
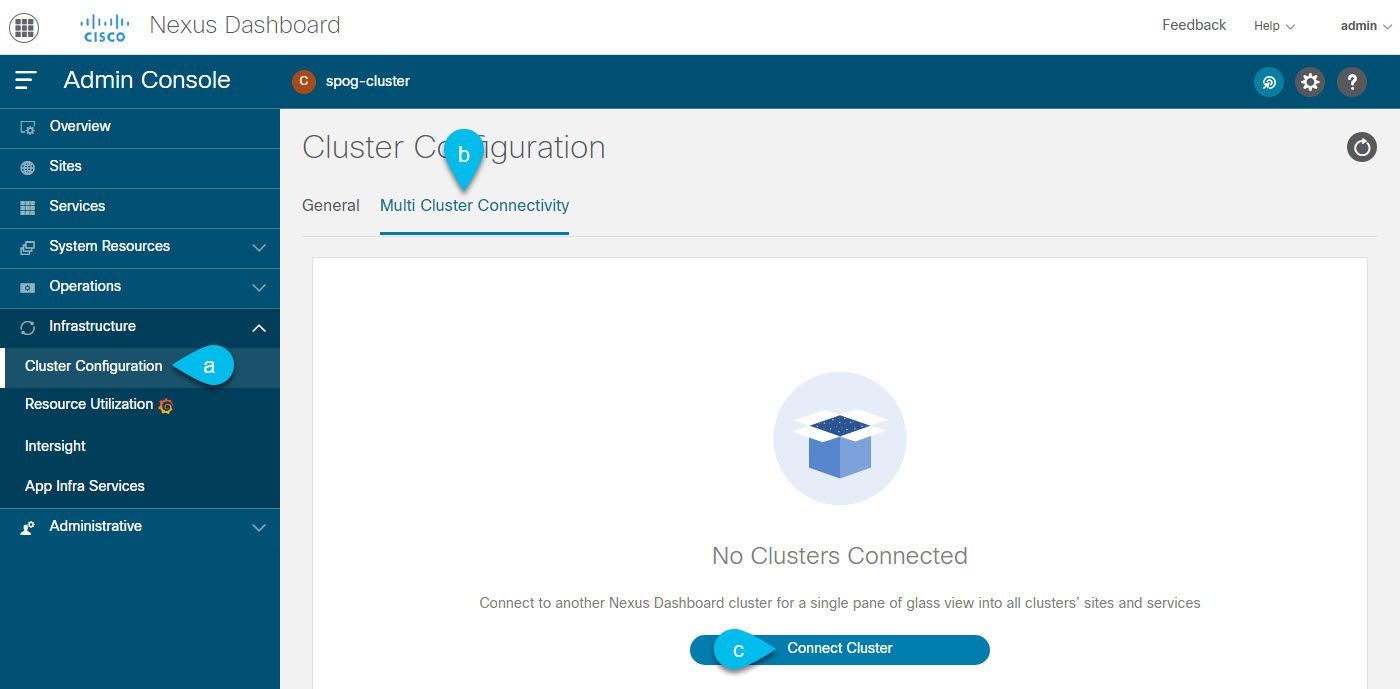
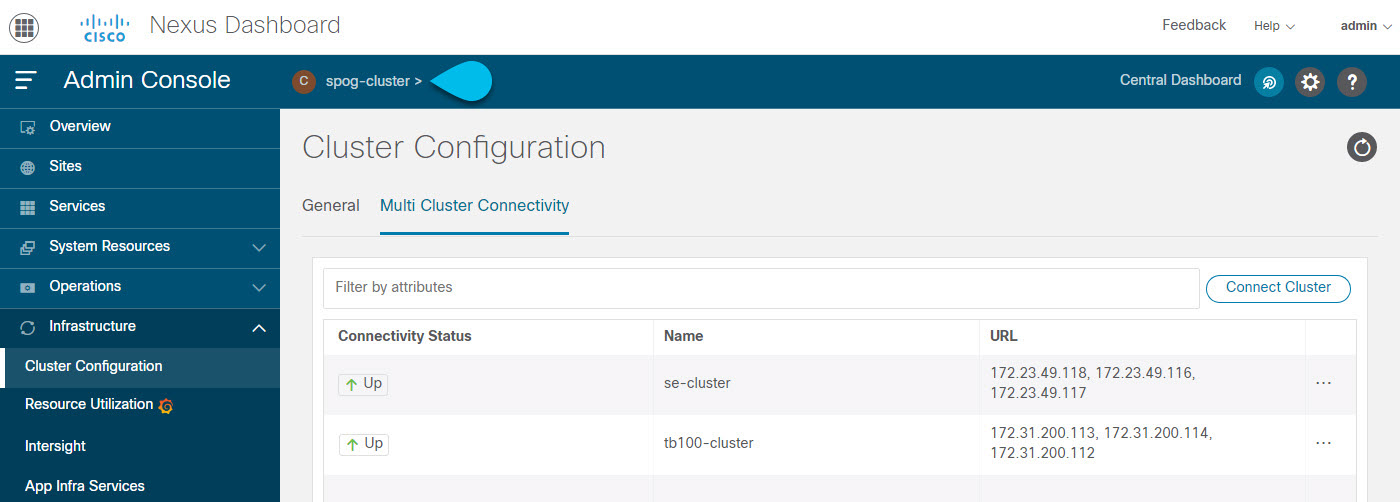
Figure 13. Adding Second Cluster -
From the main navigation menu, select Infrastructure > Cluster Configuration.
-
In the main pane, select the Multi-Cluster Connectivity tab.
-
Click Connect Cluster.
-
-
Provide cluster information.
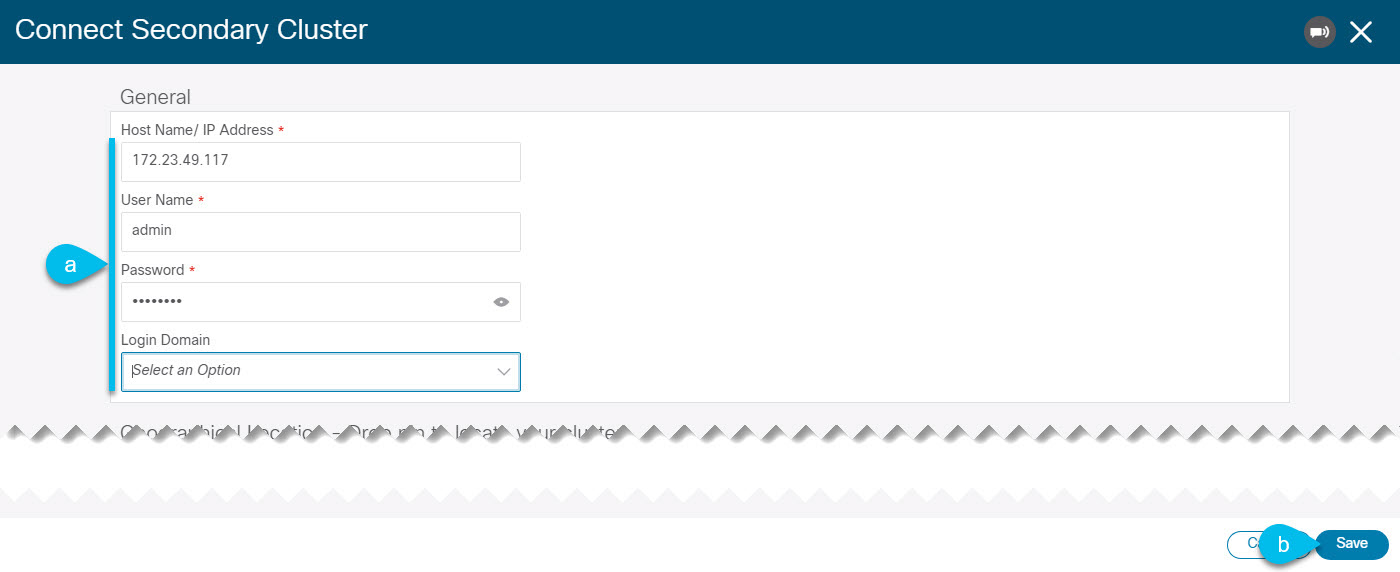
Figure 14. Providing Cluster Information -
In the information fields, provide the hostname or IP address and the authentication information for the cluster you are adding.
You only need to provide the management IP address of one of the nodes in the target cluster. Other nodes' information will be automatically synced after connectivity is established.
-
Then click Save.
The user you provide must have administrative rights on the cluster you are adding. The user credentials are used once when you are first establishing connectivity to the additional cluster. After initial connectivity is established, all subsequent communication is done through secure keys. The secure keys are provisioned to each cluster while adding it to the group.
The cluster you are adding must not be part of an already existing group of clusters.
-
-
Repeat the procedure for any additional Nexus Dashboard cluster which you want to add to the group.
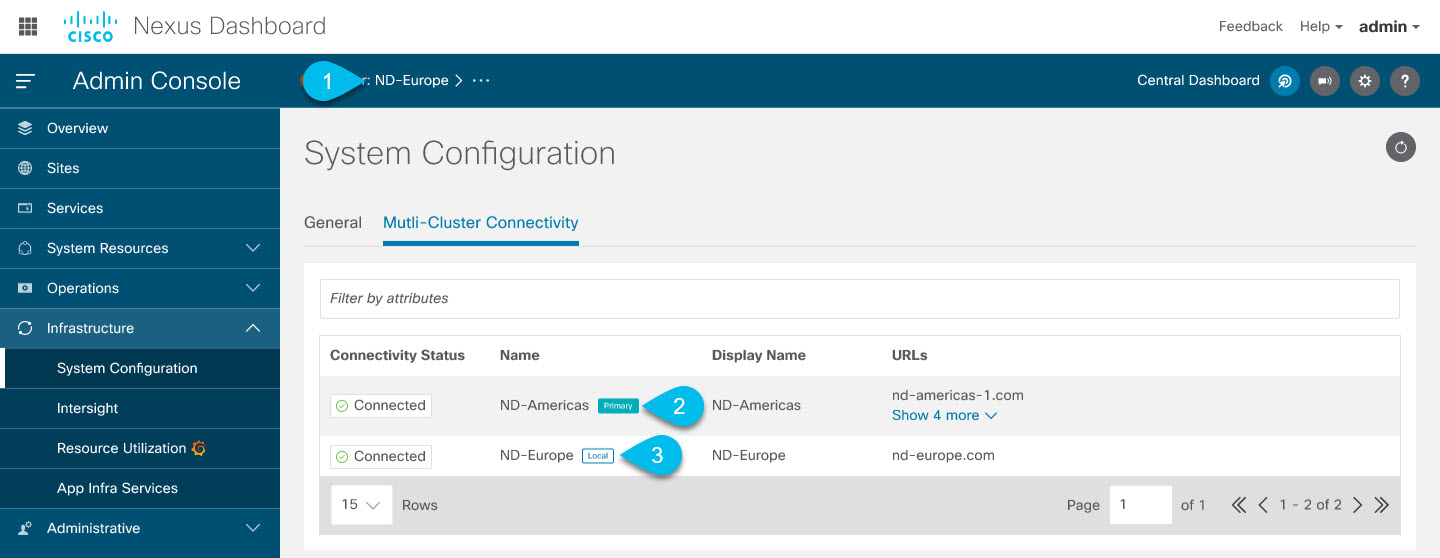
After multiple clusters are added to the group, you can see their status in the Cluster Configuration > Multi-Cluster Connectivity page.
Note that while you can view and manage any cluster from any other cluster as long as they are part of the same multi-cluster group, you can only add and remove clusters from the group when viewing the primary cluster.
The Multi-Cluster Connectivity page will display all clusters that are part of the multi-cluster group. The Actions button will be displayed only when viewing the primary cluster. To modify the cluster group, you will need to navigate to the primary as described in Navigating Between Clusters, at which point the Actions button will become available.
-
The Cluster: <name> area shows the cluster you are currently viewing.
When you first log into a cluster that is part of a cluster group, it will be displayed here. You can click on the name of the cluster to navigate to and manage a remote cluster that is part of the same group.
-
The
Primarylabel indicates the group’s primary cluster.You must be viewing this cluster to make any changes to the cluster group, such as adding or removing clusters.
-
The
Locallabel indicates the cluster you logged into.This is the cluster whose address is displayed in the browser’s URL field. If you navigate to a different cluster as mentioned above, the browser URL and the
Locallabel will not change.
Central Dashboard
A central multi-cluster connectivity dashboard UI page can be accessed by clicking Central Dashboard in the top right of any Nexus Dashboard UI page. This page provides an overview and status of the entire system with all clusters, sites, and services across the entire group of clusters you have created and allows you to quickly find obvious issues, such as connectivity loss to one of the clusters:
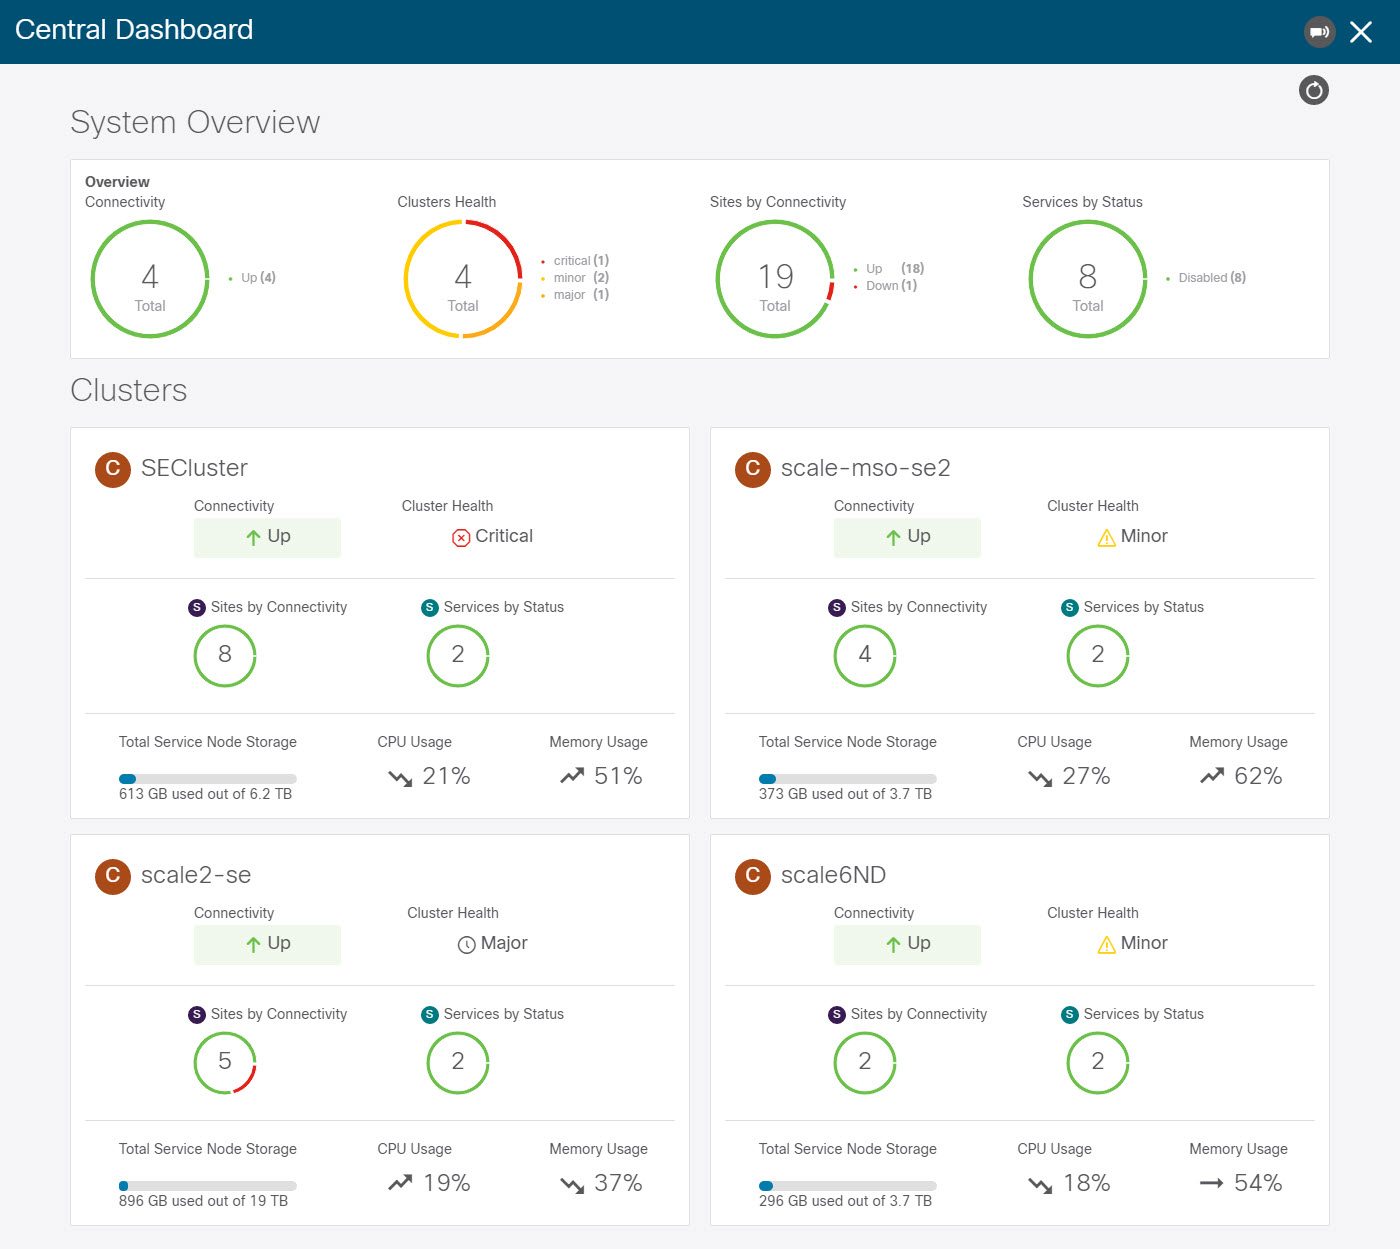
Note ![]() The cluster connectivity displayed in this screen indicates connectivity of each cluster to the
The cluster connectivity displayed in this screen indicates connectivity of each cluster to the primary cluster only. It does not cover full-mesh connectivity across all clusters in the group.
Navigating Between Clusters
When you connect two or more clusters together, you can view and manage any of the clusters and their sites and services directly from the cluster to which you are already logged in through a single pane of glass.
To change the currently viewed cluster, simply click the cluster name on any of the Nexus Dashboard pages:
After you change the current cluster, you may need to click the Refresh button in the top right of the current page to display the information from the cluster you just selected. From here on, you can perform any actions as if you were logged in directly into that cluster.
Disconnecting Clusters
To disconnect a cluster from an existing group:
-
Log in to the Nexus Dashboard GUI of the primary cluster.
Adding and removing clusters from the group must be done from the primary cluster.
-
From the main navigation menu, select Infrastructure > Cluster Configuration.
-
In the main pane, select the Multi-Cluster Connectivity tab.
-
From the Actions (
…) menu for the cluster you want to remove, select Disconnect Cluster -
In the confirmation window, click Ok.
App Infra Services
The App Infra Services screen displays information about the infrastructure services running in your Nexus Dashboard. It also allows you to restart the services in order to select a different service Deployment Profile best suitable for your deployment scenario, such combination of applications and fabric sizes.
Note that the Infra services deployment profiles are different from the application deployment profiles, which you select when you first enable or upgrade the application in the Nexus Dashboard GUI, as described in Enabling Services. Consult your application’s documentation for more information on the available deployment profiles specific to that application.
When you first deploy or upgrade your Nexus Dashboard cluster, each Infra service is configured with the most common default deployment profile. If you are not deploying the Nexus Dashboard Insights service, you can leave the Infra services at their default settings.
However, if you plan to deploy Nexus Dashboard Insights, you will need to change one or more services based on your specific deployment scenario as shown in the following table before installing any applications:
| Deployment Scenario | Cluster Nodes | elasticsearch profile |
elasticsearch-nir profile |
kafka profile |
|---|---|---|---|---|
|
<50 switches |
3 |
|
|
|
|
51-100 switches |
4 |
|
|
|
|
51-100 switches |
5 |
|
|
|
|
>100 switches |
6 |
|
|
|
To change the deployment profile for a service:
-
Navigate to your Nexus Dashboard’s Admin Console.
-
Select the service you want to restart.
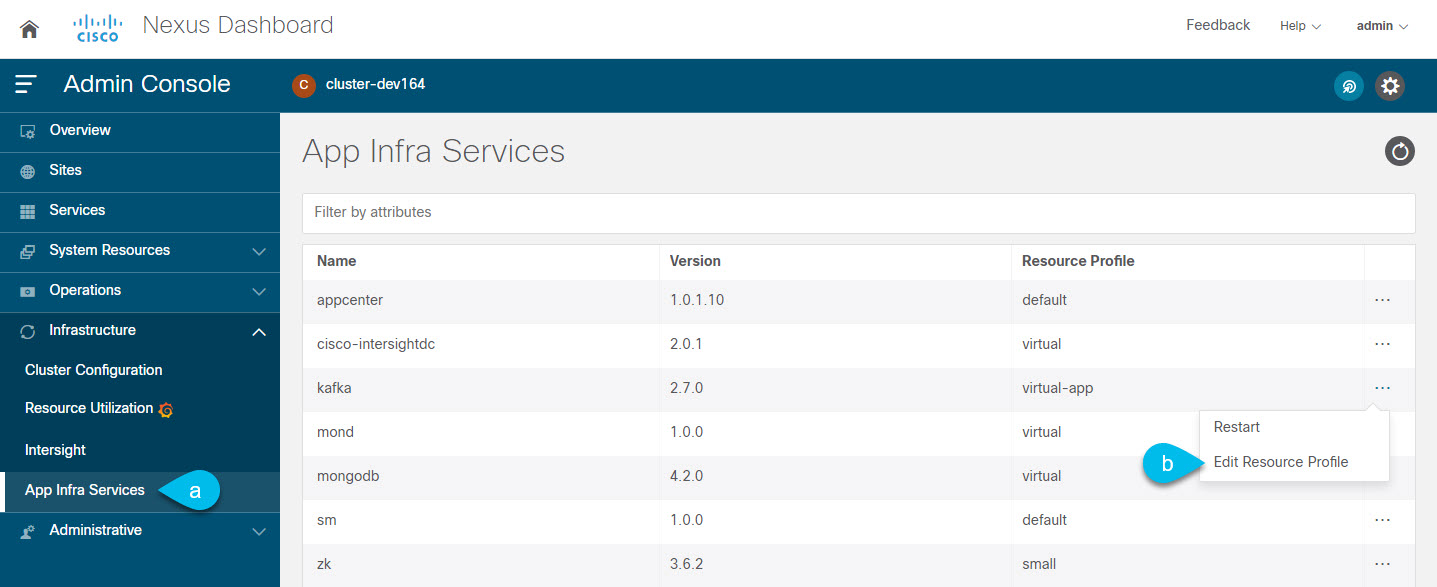
Figure 18. App Infra Service Restart -
From the main navigation menu, select Infrastructure > App Infra Services.
-
From the service’s Actions menu, choose Edit Resource Profile.
-
-
Select a different deployment profile if necessary and restart the service.
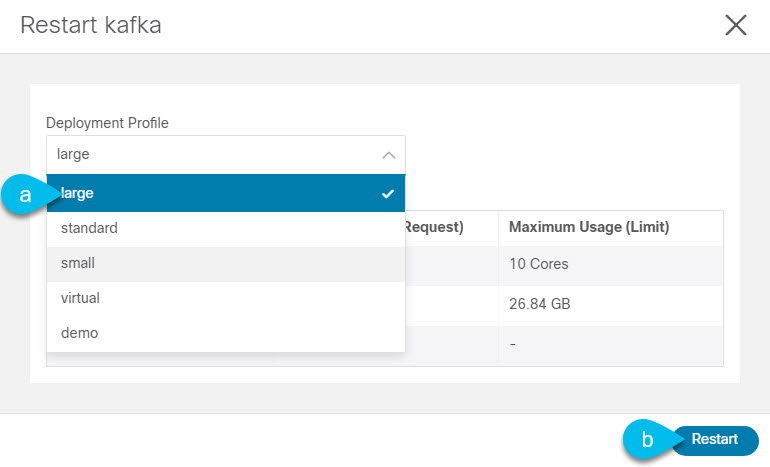
Figure 19. App Infra Service Profile -
From the Deployment Profile dropdown, select the profile appropriate for your deployment.
Note
In some cases you may not be able to change the profile of a service if the application that requires that profile is still installed. For example, if you set the kafkaservice deployment profile tolargeand install the Nexus Dashboard Insights application, you will not be able to change the service’s profile back tostandarduntil you uninstall the Nexus Dashboard Insights application. Note that uninstalling the application would also delete any collected application data, such as software and hardware telemetry.
-
Click Restart.
-
Deploying Additional Physical Nodes
Initial cluster deployment is described in Nexus Nexus Dashboard Deployment Guide. The following sections describe how to deploy an additional physical node so you can add it as a worker or standby node.
Note ![]() When adding nodes to an existing cluster, the additional nodes must be of the same form factor (physical or virtual) as the rest of the nodes in the cluster. This release does not support clusters with nodes of different form factors.
When adding nodes to an existing cluster, the additional nodes must be of the same form factor (physical or virtual) as the rest of the nodes in the cluster. This release does not support clusters with nodes of different form factors.
After you deploy an additional node, you can add it to the cluster based on its role:
-
For more information about
workernodes, see Managing Worker Nodes -
For more information about
standbynodes, see Managing Standby Nodes
Prerequisites and Guidelines for Physical Nodes
-
Ensure that you reviewed reviewed and completed the general prerequisites described in the Platform Overview, especially the network and fabric connectivity sections.
-
For maximum number of
workerandstandbynodes in a single cluster, see the Release Notes for your release. -
Ensure you are using the following hardware.
The physical appliance form factor is supported on the original Nexus Dashboard hardware only. The following table lists the PID and specifications of the physical appliance server:
Table 6. Supported Hardware PID Hardware SE-NODE-G2
- UCS C220 M5 Chassis
- 2x 10 core 2.2G Intel Xeon Silver CPU
- 4x 25G Virtual Interface Card 1455
- 4x 2.4TB HDDs
- 400GB SSD
- 1.2TB NVMe drive
- 256 GB of RAM
- 1050W power supply
Note ![]() The above hardware supports Nexus Dashboard software only. If any other operating system is installed, the node can no longer be used as a Nexus Dashboard node.
The above hardware supports Nexus Dashboard software only. If any other operating system is installed, the node can no longer be used as a Nexus Dashboard node.
-
Ensure that you are running a supported version of Cisco Integrated Management Controller (CIMC).
Recommended version: CIMC, Release 4.1(3d).
Minimum supported version: CIMC, Release 4.0(1a).
-
Have the physical server racked and connected as described in Nexus Dashboard Hardware Installation Guide.
-
Ensure the hardware is running the same Nexus Dashboard release as your existing cluster.
If the new node is running an earlier release, you must manually upgrade to the current release, as described in Manual Upgrades.
If for any reason you are unable to run the manual upgrade, you can reinstall the software, as described in Re-Imaging Nodes.
Deploying Physical Nodes
Once you have completed all prerequisites described above, simply connect the node and power it own.
Once the node is deployed, you can add it to the cluster:
-
To add the node as a
workernode, see Managing Worker Nodes -
To add the node as a
standbynodes, see Managing Standby Nodes
Deploying Additional Virtual Nodes in VMware ESX
Initial cluster deployment is described in Nexus Nexus Dashboard Deployment Guide. The following sections describe how to deploy an additional node in VMware ESX so you can add it as a worker or standby node.
Note ![]() When adding nodes to an existing cluster, the additional nodes must be of the same form factor (physical or virtual) as the rest of the nodes in the cluster. This release does not support clusters with nodes of different form factors.
When adding nodes to an existing cluster, the additional nodes must be of the same form factor (physical or virtual) as the rest of the nodes in the cluster. This release does not support clusters with nodes of different form factors.
After you deploy an additional node, you can add it to the cluster based on its role:
-
For more information about
workernodes, see Managing Worker Nodes -
For more information about
standbynodes, see Managing Standby Nodes
Prerequisites and Guidelines for ESX Nodes
-
Ensure that you reviewed and completed the general prerequisites described in the Platform Overview, especially the network and fabric connectivity sections.
-
This release supports VMware ESX clusters with up to 6
worker(3 app and 3 data nodes) and 2standbynodes total. -
When deploying in VMware ESX, you can choose to deploy using a vCenter or directly in the ESXi host.
For detailed information, see one of the following sections.
-
When deploying in VMware ESX, you can deploy two types of nodes:
-
Data node — node profile designed for data-intensive applications, such Nexus Dashboard Insights
-
App node — node profile designed for non-data-intensive applications, such Nexus Dashboard Orchestrator
Table 7. Supported Hardware Nexus Dashboard Version Data Node Requirements App Node Requirements Release 2.1.1
VMware vCenter 6.x
VMware ESXi 6.5 or 6.7
The node VM must have:
-
32 vCPUs
-
128GB of RAM
-
3TB SSD storage for the data volume and an additional 50GB for the system volume
All
Datanodes must be deployed on SSD or faster storage.
We recommend that each Nexus Dashboard node is deployed in a different ESXi server.
VMware vCenter 6.x
VMware ESXi 6.5 or 6.7
The node VM must have:
-
16 vCPUs
-
64GB of RAM
-
500GB HDD or SSD storage for the data volume and an additional 50GB for the system volume
Some services require
Appnodes to be deployed on faster SSD storage while other services support HDD. Check the Nexus Dashboard Capacity Planning tool to ensure that you use the correct type of storage.
We recommend that each Nexus Dashboard node is deployed in a different ESXi server.
-
-
Deploying ESX Node Using vCenter
Ensure that you meet the requirements and guidelines described in Prerequisites and Guidelines for ESX Nodes.
This section describes how to deploy an additional Cisco Nexus Dashboard node in VMware ESX using vCenter.
-
Obtain the Cisco Nexus Dashboard OVA image.
-
Browse to the Software Download page.
-
Click the Downloads tab.
-
Choose the Nexus Dashboard version you want to download.
-
Download the appropriate Cisco Nexus Dashboard image (nd-dk9.<version>.ova).
For Data nodes, download the
nd-dk9.<version>-data.ova.For App nodes, download the
nd-dk9.<version>-app.ova
-
-
Log in to your VMware vCenter.
You cannot deploy the OVA directly in the ESX host, you must deploy it using a vCenter.
Depending on the version of your vSphere client, the location and order of configuration screens may differ slightly. The following steps provide deployment details using VMware vSphere Client 6.7.
-
Right-click the ESX host where you want to deploy and select Deploy OVF Template….
The Deploy OVF Template wizard appears.
-
In the Select an OVF template screen, provide the OVA image, then click Next.
If your image is local, select Local file and click Choose Files to select the OVA file you downloaded.
If you hosted the image on a web server in your environment, select URL and provide the URL to the image.
-
-
In the Select a name and folder screen, provide a name and location for the VM, then click Next.
-
In the Select a compute resource screen, select the ESX host, then click Next.
-
In the Review details screen, click Next to continue.
-
In the Select storage screen, provide the storage information, then click Next.
From the Select virtual disk format dropdown, select Thick Provision Lazy Zeroed.
We recommend a unique datastore for each node.
-
In the Select networks screen, accept default values and click Next to continue.
There are two networks, fabric0 is used for the data network and mgmt0 is used for the management network.
-
In the Customize template screen, provide the required information.
-
Provide the sizes for the node’s data disks.
We recommend using the default values for the required data volume.
The default values will be pre-populated based on the type of node you are deploying, with App node having a single 500GB disk and Data node having a single 3TB disk.
Note that in addition to the data volume, a second 50GB system volume will also be configured but cannot be customized.
-
Provide and confirm the Password.
We recommend configuring the same password for all nodes, however you can choose to provide different passwords for each node.
-
Provide the Management Network IP address, netmask, and gateway.
-
Ensure that the Cluster Leader checkbox is unchecked.
Note
If you leave the box checked, you will not be able to add this node to an existing cluster as it will expect to become a brand new cluster instead.
-
Click Next to continue.
-
-
In the Ready to complete screen, verify that all information is accurate and click Finish to begin deploying the node.
-
Once the VM deployment is finished, power on the VM.
-
Add the node as
masterorstandby.Once the node is deployed, you can add it to the cluster:
-
To add the node as a
workernode, see Managing Worker Nodes -
To add the node as a
standbynodes, see Managing Standby Nodes
-
Deploying ESX Node Directly in ESXi
Ensure that you meet the requirements and guidelines described in Prerequisites and Guidelines for ESX Nodes.
This section describes how to deploy an additional Cisco Nexus Dashboard node in VMware ESX using vCenter.
-
Obtain the Cisco Nexus Dashboard OVA image.
-
Browse to the Software Download page.
-
Click the Downloads tab.
-
Choose the Nexus Dashboard version you want to download.
-
Download the appropriate Cisco Nexus Dashboard image (nd-dk9.<version>.ova).
For Data nodes, download the
nd-dk9.<version>-data.ova.For App nodes, download the
nd-dk9.<version>-app.ova
-
-
Log in to your VMware ESXi.
Depending on the version of your ESXi server, the location and order of configuration screens may differ slightly. The following steps provide deployment details using VMware ESXi 6.7.
-
Right-click the host and select Create/Register VM.
-
In the Select creation type screen, choose Deploy a virtual machine from an OVF or OVA file, then click Next.
-
In the Select OVF and VMDK files screen, provide the virtual machine name (for example,
nd-node-worker1) and the OVA image you downloaded in the first step, then click Next. -
In the Select storage screen, choose the datastore for the VM, then click Next.
-
In the Select OVF and VMDK files screen, provide the virtual machine name (for example,
nd-node-worker1) and the OVA image you downloaded in the first step, then click Next. -
In the Deployment options screen, choose Disk Provisioning: Thick, uncheck the Power on automatically option, then click Next to continue.
There are two networks, fabric0 is used for the data network and mgmt0 is used for the management network.
-
In the Ready to complete screen, verify that all information is accurate and click Finish to begin deploying the first node.
-
Wait for the VM to finish deploying, ensure that the VMware Tools periodic time synchronization is disabled, then start the VM.
To disable time synchronization:
-
Right-click the node’s VM and select Edit Settings.
-
In the Edit Settings window, select the VM Options tab.
-
Expand the VMware Tools category and uncheck the Synchronize guest time with host option.
-
-
Open the node’s console and configure the node’s basic information.
-
Begin initial setup.
You will be prompted to run the first-time setup utility:
[ OK ] Started atomix-boot-setup.
Starting Initial cloud-init job (pre-networking)...
Starting logrotate...
Starting logwatch...
Starting keyhole...
[ OK ] Started keyhole.
[ OK ] Started logrotate.
[ OK ] Started logwatch.
Press any key to run first-boot setup on this console...
-
Enter and confirm the admin password
This password will be used for the rescue-user SSH login and for adding this node to the cluster.
Admin Password:
Reenter Admin Password:
-
Enter the management network information.
Management Network:
IP Address/Mask: 192.168.9.172/24
Gateway: 192.168.9.1
-
Ensure that you do not designate the node as the
Cluster Leader.Is this the cluster leader?: y
-
Review and confirm the entered information.
You will be asked if you want to change the entered information. If all the fields are correct, choose
nto proceed.If you want to change any of the entered information, enter
yto re-start the basic configuration script.Please review the config Management network: Gateway: 192.168.9.1 IP Address/Mask: 192.168.9.172/24 Cluster leader: no Re-enter config? (y/N): n
-
-
Add the node as
masterorstandby.Once the node is deployed, you can add it to the cluster:
-
To add the node as a
workernode, see Managing Worker Nodes -
To add the node as a
standbynodes, see Managing Standby Nodes
-
Deploying Additional Virtual Nodes in Linux KVM
Initial cluster deployment is described in Nexus Nexus Dashboard Deployment Guide. The following sections describe how to deploy an additional node in Linux KVM so you can add it as a worker or standby node.
Note ![]() When adding nodes to an existing cluster, the additional nodes must be of the same form factor (physical or virtual) as the rest of the nodes in the cluster. This release does not support clusters with nodes of different form factors.
When adding nodes to an existing cluster, the additional nodes must be of the same form factor (physical or virtual) as the rest of the nodes in the cluster. This release does not support clusters with nodes of different form factors.
After you deploy an additional node, you can add it to the cluster based on its role:
-
For more information about
workernodes, see Managing Worker Nodes -
For more information about
standbynodes, see Managing Standby Nodes
Prerequisites and Guidelines for KVM Nodes
-
Ensure that you reviewed and complete the general prerequisites described in the Platform Overview, especially the network and fabric connectivity sections.
-
This release supports KVM clusters with up to 3
workerand 2standbynodes total. -
Ensure that your VM has sufficient resources:
Table 8. Supported Hardware Nexus Dashboard Version VM Requirements Release 2.1.1
-Linux Kernel 3.10.0-957.el7.x86_64 or later with KVM libvirt-4.5.0-23.el7_7.1.x86_64 or later
The node VM must have:
-16 vCPUs
-48 GB of RAM
-800 GB disk
Each node requires a dedicated disk partition
The disk must have I/O latency of 20ms or less. You can verify the I/O latency using the following command:
# fio --rw=write --ioengine=sync --fdatasync=1 --directory=test-data_with_se --size=22m --bs=2300 --name=mytest And confirm that the 99.00th=[<value>] in the fsync/fdatasync/sync_file_range section is under 20ms.We recommend that each Nexus Dashboard node is deployed in a different KVM server.
Deploying KVM Nodes
Ensure that you meet the requirements and guidelines described in Prerequisites and Guidelines for KVM Nodes.
This section describes how to deploy an additional Cisco Nexus Dashboard node in Linux KVM.
-
Obtain the Cisco Nexus Dashboard
qcow2image.-
Browse to the Software Download page.
-
Click the Downloads tab.
-
Choose the Nexus Dashboard version you want to download.
-
Download the appropriate Cisco Nexus Dashboard image (
nd-dk9.<version>.qcow2).
-
-
Copy the image to the Linux KVM servers where you will host the nodes.
You can use
scpto copy the image, for example:# scp nd-dk9.2.1.1a.qcow2 root@<kvm-host-ip>:/home/nd-base
The following steps assume you copied the image into the
/home/nd-basedirectory. -
Create the required disk images for the first node.
You will create a snapshot of the base qcow2 image you downloaded and use the snapshots as the disk images for the nodes' VMs. You will also need to create a second disk image for each node.
-
Log in to your KVM host as the root user.
-
Create a directory for the node’s snapshot.
The following steps assume you create the snapshot in the
/home/nd-node-worker1directory.# mkdir -p /home/nd-node-worker1/ # cd /home/nd-node-worker1
-
Create the snapshot.
In the following command, replace
/home/nd-base/nd-dk9.2.1.1a.qcow2with the location of the base image you created in the previous step.# qemu-img create -f qcow2 -b /home/nd-base/nd-dk9.2.1.1a.qcow2 /home/nd-node-worker1/nd-node-worker1-disk1.qcow2 -
Create the additional disk image for the node.
Each node requires two disks: a snapshot of the base Nexus Dashboard qcow2 image and a second 500GB disk.
# quemu-img create -f qcow2 /home/nd-node-worker1/nd-node-worker1-disk2.qcow2 500GBefore you proceed to the next step, you should have the following:
/home/nd-node-worker1/directory with two disk images:-
/home/nd-node-worker1/nd-node-worker1-disk1.qcow2, which is a snapshot of the base qcow2 image you downloaded in Step 1. -
/home/nd-node-worker1/nd-node-worker1-disk2.qcow2, which is a new 500GB disk you created.
-
-
-
Create the node’s VM.
-
Open the KVM console and click New Virtual Machine.
You can open the KVM console from the command line using the
virt-managercommand. -
In the New VM screen, choose Import existing disk image option and click Forward.
-
In the Provide existing storage path field, click Browse and select the
nd-node-worker1-disk1.qcow2file.We recommend that each node’s disk image is stored on its own disk partition.
-
Choose Generic for the OS type and Version, then click Forward.
-
Specify 48GB memory and 16 CPUs, then click Forward.
-
Enter the Name of the virtual machine, for example nd-node-worker1 and check the
Customize configuration before installoption. Then click Finish.
Note
You must select the Customize configuration option before install checkbox to be able to make the disk and network card customizations required for the node.
The VM details window will open.
-
-
In the VM details window, change the NIC’s device model:
-
Select NIC <mac>.
-
For Device model, choose e1000.
-
-
In the VM details window, add a second NIC:
-
Click Add Hardware.
-
In the Add New Virtual Hardware screen, select Network.
-
For Network Source, choose the KVM host’s device.
-
Leave the default Mac address value.
-
For Device model, choose
e1000.
-
-
In the VM details window, add the second disk image:
-
Click Add Hardware.
-
In the Add New Virtual Hardware screen, select Storage.
-
Choose Select or create custom storage, click Manage, and select the
nd-node-worker1-disk2.qcow2file you created. -
Click Finish to add the second disk.
-
-
Finally, click Begin Installation to finish creating the node’s VM.
-
Start the VM.
-
Open the node’s console and configure the node’s basic information.
-
Begin initial setup.
You will be prompted to run the first-time setup utility:
[ OK ] Started atomix-boot-setup.
Starting Initial cloud-init job (pre-networking)...
Starting logrotate...
Starting logwatch...
Starting keyhole...
[ OK ] Started keyhole.
[ OK ] Started logrotate.
[ OK ] Started logwatch.
Press any key to run first-boot setup on this console...
-
Enter and confirm the admin password
This password will be used for the rescue-user SSH login and for adding this node to the cluster.
Admin Password:
Reenter Admin Password:
-
Enter the management network information.
Management Network:
IP Address/Mask: 192.168.9.172/24
Gateway: 192.168.9.1
-
Ensure that you do not designate the node as the
Cluster Leader.Cluster leader?: no
Note
If you designate the node as a cluster leader, you will not be able to add it to an existing cluster as it will expect to become a brand new cluster instead.
-
Review and confirm the entered information.
You will be asked if you want to change the entered information. If all the fields are correct, choose
nto proceed.If you want to change any of the entered information, enter
yto re-start the basic configuration script.Please review the config Management network: Gateway: 192.168.9.1 IP Address/Mask: 192.168.9.172/24 Cluster leader: no Re-enter config? (y/N): n
-
-
Add the node to the cluster as
masterorstandby.Once the bootstrap process is finished, you can add it to the cluster:
-
To add the node as a
workernode, see Managing Worker Nodes -
To add the node as a
standbynodes, see Managing Standby Nodes
-
Managing Worker Nodes
You can add a number of worker nodes to an existing 3-node cluster for horizontal scaling to enable application co-hosting.
For additional information about application co-hosting and cluster sizing, see the Platform Overview section of this document.
Note ![]() Worker nodes are not supported for cloud form factors of Nexus Dashboard clusters deployed in AWS or Azure.
Worker nodes are not supported for cloud form factors of Nexus Dashboard clusters deployed in AWS or Azure.
Adding Worker Nodes
This section describes how to add a worker node to your cluster to enable horizontal scaling
-
Ensure that the existing master nodes and the cluster are healthy.
-
Prepare and deploy the new node as described in Deploying Additional Physical Nodes, Deploying Additional Virtual Nodes in VMware ESX, Deploying ESX Node Directly in ESXi, or Deploying Additional Virtual Nodes in Linux KVM.
-
Ensure that the node you are adding is powered on.
-
If you are adding a physical node, ensure that you have the new node’s CIMC IP address and login information.
You will need to use the CIMC information to add the new node using the Nexus Dashboard GUI.
-
If you are adding a virtual node, ensure that you have the node’s management IP address and login information.
To add a worker node:
-
Log in to the Cisco Nexus Dashboard GUI.
-
From the main navigation menu, select System Resources > Nodes.
-
In the main pane, click Add Node.
The Add Node screen opens.
-
In the Add Node screen, provide the node information.
-
Provide the Name of the node.
-
From the Type dropdown, select
Worker. -
Provide the Credentials information for the node, then click Verify.
For physical nodes, this is the IP address, username, and password of the server’s CIMC. The CIMC will be used to configure the rest of the information on the node.
For virtual nodes, this is the IP address and
rescue-userpassword you defined for the node when deploying it. -
Provide the Management Network information.
For virtual nodes, the management network information will be pre-populated with the information pulled from the node based on the IP address and credentials you provided in the previous sub-step.
For physical nodes, you must provide the management network IP address, netmask, and gateway now.
-
Provide the Data Network information.
You must provide the data network IP address, netmask, and gateway. Optionally, you can also provide the VLAN ID for the network. For most deployments, you can leave the VLAN ID field blank.
-
(Optional) Provide IPv6 information for the management and data networks.
Starting with release 2.1.1, Nexus Dashboard supports dual stack IPv4/IPv6 for the management and data networks.
If you want to provide IPv6 information, you must do it when adding the node.
All nodes in the cluster must be configured with either only IPv4 or dual IPv4/IPv6 stack.
-
-
Click Save to add the node.
The configuration will be pushed to the node and the node will be added to the list in the GUI.
-
If you are running Nexus Dashboard Insights application, disable and re-enable the application.
After you add the new worker node, you must disable and re-enable the application for its services to be properly distributed to the new node.
Deleting a Worker node
-
Ensure that the master nodes and the cluster are healthy.
To delete an existing worker node:
-
Log in to the Cisco Nexus Dashboard GUI.
-
From the main navigation menu, select System Resources > Nodes.
-
Select the checkbox next to the worker node you want to delete.
-
From the Actions menu, choose Delete to delete the node.
Managing Standby Nodes
You can add up to two standby nodes, which you can use to quickly restore the cluster functionality in case one or more master nodes fail by replacing the failed master node with the standby node.
Standby nodes are similar to worker nodes in deployment, initial configuration, and upgrades. However, unlike worker nodes, the cluster will not use the standby nodes for any workloads.
Note ![]() Standby nodes are not supported for single-node clusters or clusters deployed in AWS or Azure.
Standby nodes are not supported for single-node clusters or clusters deployed in AWS or Azure.
The following two cases are supported:
-
Single master node failure
You can use the UI to convert the standby node into a new master node.
-
Two master nodes failure
You will need to perform manual failover of one of the nodes to restore cluster functionality. Then fail over the second node using standard procedure.
Adding Standby Nodes
This section describes how to add a standby node to your cluster for easy cluster recover in case of a master node failure.
-
Ensure that the existing master nodes and the cluster are healthy.
-
Prepare and deploy the new node as described in Deploying Additional Physical Nodes, Deploying Additional Virtual Nodes in VMware ESX, Deploying ESX Node Directly in ESXi, or Deploying Additional Virtual Nodes in Linux KVM.
You can failover only between nodes of identical types, so you must deploy the same type of node as the nodes in your cluster which you may need to replace. In case of virtual nodes deployed in VMware ESX, which have two node profiles (
OVA-appandOVA-data), you can failover only between nodes of the same profile as well. -
Ensure that the node you are adding is powered on.
-
If you are adding a physical node, ensure that you have the new node’s CIMC IP address and login information.
You will need to use the CIMC information to add the new node using the Nexus Dashboard GUI.
-
If you are adding a virtual node, ensure that you have the node’s management IP address and login information.
To add a standby node:
-
Log in to the Cisco Nexus Dashboard GUI.
-
From the main navigation menu, select System Resources > Nodes.
-
In the main pane, click Add Node.
The Add Node screen opens.
-
In the Add Node screen, provide the node information.
-
Provide the Name of the node.
-
From the Type dropdown, select
Standby. -
Provide the Credentials information for the node, then click Verify.
For physical nodes, this is the IP address, username, and password of the server’s CIMC. The CIMC will be used to configure the rest of the information on the node.
For virtual nodes, this is the IP address and
rescue-userpassword you defined for the node when deploying it. -
Provide the Management Network information.
For virtual nodes, the management network information will be pre-populated with the information pulled from the node based on the IP address and credentials you provided in the previous sub-step.
For physical nodes, you must provide the management network IP address, netmask, and gateway now.
-
Provide the Data Network information.
You must provide the data network IP address, netmask, and gateway. Optionally, you can also provide the VLAN ID for the network. For most deployments, you can leave the VLAN ID field blank.
-
(Optional) Provide IPv6 information for the management and data networks.
Starting with release 2.1.1, Nexus Dashboard supports dual stack IPv4/IPv6 for the management and data networks.
If you want to provide IPv6 information, you must do it when adding the node.
All nodes in the cluster must be configured with either only IPv4 or dual IPv4/IPv6 stack.
-
-
Click Save to add the node.
The configuration will be pushed to the node and the node will be added to the list in the GUI.
Replacing Single Master Node with Standby Node
This section describes failover using a pre-configured standby node. If your cluster does not have a standby node, follow the steps described in one of the sections in Troubleshooting instead.
-
Ensure that at least 2 master nodes are healthy.
If two of the master nodes are unavailable, you will need to manually restore the cluster as described in Replacing Two Master Nodes with Standby Nodes
-
Ensure that you have at least one
standbynode available in the cluster.Setting up and configuring
standbynodes is described in Adding Standby Nodes. -
Ensure that the
masternode you want to replace is powered off.
Note
You cannot re-add the masternode you are replacing back to the cluster after the failover is complete. If themasternode you replace is still functional and you want to re-add it to the cluster after the failover, you must factory reset (acs factory-reset) or re-image it and add it as astandbyormasternode only.
To failover a single master node:
-
Log in to the Cisco Nexus Dashboard GUI.
-
From the main navigation menu, select System Resources > Nodes.
-
Click the Actions (…) menu next to the
Inactivemaster node that you want to replace. -
Choose Failover.
Note that you must have a standby node already configured and added or the Failover menu option will not be available.
-
In the Fail Over window that opens, select a standby node from the dropdown.
-
Click Save to complete the failover.
The failed master node will be removed from the list and replaced by the standby node you selected. The status will remain
Inactivewhile the services are being restored to the new master node.It can take up to 10 minutes for all services to be restored, at which point the new master node’s status will change to
Active.
Replacing Two Master Nodes with Standby Nodes
This section describes failover using a pre-configured standby node. If your cluster does not have a standby node, follow the steps described in one of th sections in Troubleshooting instead.
If only one of your master nodes failed, you can use the GUI to replace it with a standby node as described in Replacing Single Master Node with Standby Node.
However, when two master nodes are unavailable, the entire cluster is put into read-only mode. In this case, most operations including the UI are disabled and no changes can be made to the cluster. This section describes how to fail over one of the failed master nodes to a standby node to recover the cluster and restore normal operations, at which point you can recover the second master node using the normal procedure.
-
Ensure that you have at least one
standbynode available in the cluster.Setting up and configuring
standbynodes is described in Adding Standby Nodes. -
Ensure that the
masternodes you want to replace are powered off.
Note
You cannot re-add the masternode you are replacing back to the cluster after the failover is complete. If themasternode you replace is still functional and you want to re-add it to the cluster after the failover, you must factory reset (acs factory-reset) or re-image it and add it as astandbyormasternode only.
To fail over two master nodes:
-
Log in to the remaining master node via CLI as
rescue-user. -
Execute the failover command.
In the following command, replace
<node1-data-ip>and<node2-data-ip>with the data network IP addresses of the failed nodes:# acs failover --failedIP <node1-data-ip> --failedIP <node2-data-ip>
Note
Even though only the first node is failed over, the second failed node you provide is required internally to recover the cluster.
By default, the healthy master node will automatically pick an available standby node and fail over the first failed node you provide (
<node1-data-ip>) to it.If you would like to provide a specific standby node, you can add
<standby-node-data-ip>to the above command:# acs failover --failedIP <node1-data-ip> --failedIP <node2-data-ip> \ --standbyIP <standby-node1-data-ip>
-
Confirm that you want to proceed.
Warning: Failover can be a disruptive operation and should only be performed as last resort option to recover cluster from disasters using standby where two master nodes have lost their state due to hardware faults.
Proceed? (y/n): y
The master node will copy the configuration state to the standby node and both nodes will restart. It may take up to 30 minutes for the nodes to come up and the cluster to be restored. You can check the progress by navigating to the master node’s UI.
-
After the cluster is back up, fail over the second failed master node.
At this point, you can use the standard procedure described in Replacing Single Master Node with Standby Node.
Deleting Standby Nodes
-
Ensure that the master nodes and the cluster are healthy.
To delete an existing standby node:
-
Log in to the Cisco Nexus Dashboard GUI.
-
From the main navigation menu, select System Resources > Nodes.
-
Select the checkbox next to the standby node you want to delete.
-
From the Actions menu, choose Delete to delete the node.
 Feedback