Deploying as Physical Appliance

Prerequisites and Guidelines

Before you proceed with deploying the Nexus Dashboard cluster, you must:

  • Review and complete the general prerequisites described in Deployment Overview and Requirements.

    Note that this document describes how to initially deploy the base Nexus Dashboard cluster. If you want to expand an existing cluster with additional nodes (such as worker or standby), see the "Infrastructure Management" chapter of the Cisco Nexus Dashboard User Guide instead, which is available from the Nexus Dashboard UI or online at Cisco Nexus Dashboard User Guide

    If you are looking to completely re-image the server, for example in case you cannot log in as the rescue-user for manual recovery, see the "Troubleshooting" chapter of the Cisco Nexus Dashboard User Guide.

    The guide is available from the Nexus Dashboard UI or online at Cisco Nexus Dashboard User Guide

  • Review and complete any additional prerequisites described in the Release Notes for the services you plan to deploy.

  • Ensure you are using the following hardware and the servers are racked and connected as described in Cisco Nexus Dashboard Hardware Installation Guide.

    The physical appliance form factor is supported on the original Nexus Dashboard platform hardware only. The following table lists the PIDs and specifications of the physical appliance servers:

    Table 1. Supported Hardware

    PID

    Hardware

    SE-NODE-G2

    • UCS C220 M5 Chassis

    • 2x 10-core 2.2G Intel Xeon Silver CPU

    • 256 GB of RAM

    • 4x 2.4TB HDDs

      400GB SSD

      1.2TB NVME drive

    • UCS Virtual Interface Card 1455 (4x25G ports)

    • 1050W power supply

    SE-CL-L3

    A cluster of 3x SE-NODE-G2 appliances.

    Note


    The above hardware supports Nexus Dashboard software only. If any other operating system is installed, the node can no longer be used as a Nexus Dashboard node.


  • Ensure that you are running a supported version of Cisco Integrated Management Controller (CIMC).

    Recommended version: CIMC, Release 4.2(2a).

    Minimum supported version: CIMC, Release 4.0(1a).

  • Ensure that all nodes are running the same release version image.

  • If your Nexus Dashboard hardware came with a different release image than the one you would like to deploy, we recommend deploying the cluster with the existing image first and then upgrading it to the desired release.

    For example, if the hardware you received came with Release 2.0.1 image pre-installed, but you want to deploy Release 2.1.1 instead, we recommend:

    • First, bring up the Release 2.0.1 cluster, as described in the following section.

    • Then upgrade to Release 2.1.1, as described in Upgrading Nexus Dashboard.

You must have at least a 3-node cluster. Additional worker nodes can be added for horizontal scaling if required by the type and number of applications you will deploy. For maximum number of worker and standby nodes in a single cluster, see the Release Notes for your release.
Deploying Cisco Nexus Dashboard as Physical Appliance

When you first receive the Nexus Dashboard physical hardware, it comes preloaded with the software image. This section describes how to configure and bring up the initial 3-node Nexus Dashboard cluster.

Before you begin

Procedure


Step 1

Configure the first node's basic information.

You only need to complete the following configuration on one of the nodes of the cluster. For the second and third master nodes, simply ensure that they are powered on, their CIMCs are configured with IP addresses and login credentials, and the CIMC IPs are reachable from the first node.

  1. SSH into the node using CIMC management IP and use the connect host command to connect to the node's console.

    You will be prompted to run the first-time setup utility:

    [ OK ] Started atomix-boot-setup.
           Starting Initial cloud-init job (pre-networking)...
           Starting logrotate...
           Starting logwatch...
           Starting keyhole...
    [ OK ] Started keyhole.
    [ OK ] Started logrotate.
    [ OK ] Started logwatch.
    
    Press any key to run first-boot setup on this console...
  2. Enter and confirm the admin password

    This password will be used for the rescue-user CLI login as well as the initial GUI password.

    Admin Password:
    Reenter Admin Password:
  3. Enter the management network information.

    Management Network:
      IP Address/Mask: 192.168.9.172/24
      Gateway: 192.168.9.1
  4. Review and confirm the entered information.

    You will be asked if you want to change the entered information. If all the fields are correct, choose n to proceed. If you want to change any of the entered information, enter y to re-start the basic configuration script.

    Please review the config
    Management network:
      Gateway: 192.168.9.1
      IP Address/Mask: 192.168.9.172/24
    
    Re-enter config? (y/N): n

Step 2

Wait for the initial bootstrap process to complete.

After you provide and confirm management network information, the initial setup configures the networking and brings up the UI, which you will use to add two other nodes and complete the cluster deployment.

Please wait for system to boot: [#########################] 100%
System up, please wait for UI to be online.

System UI online, please login to https://192.168.9.172 to continue.

Step 3

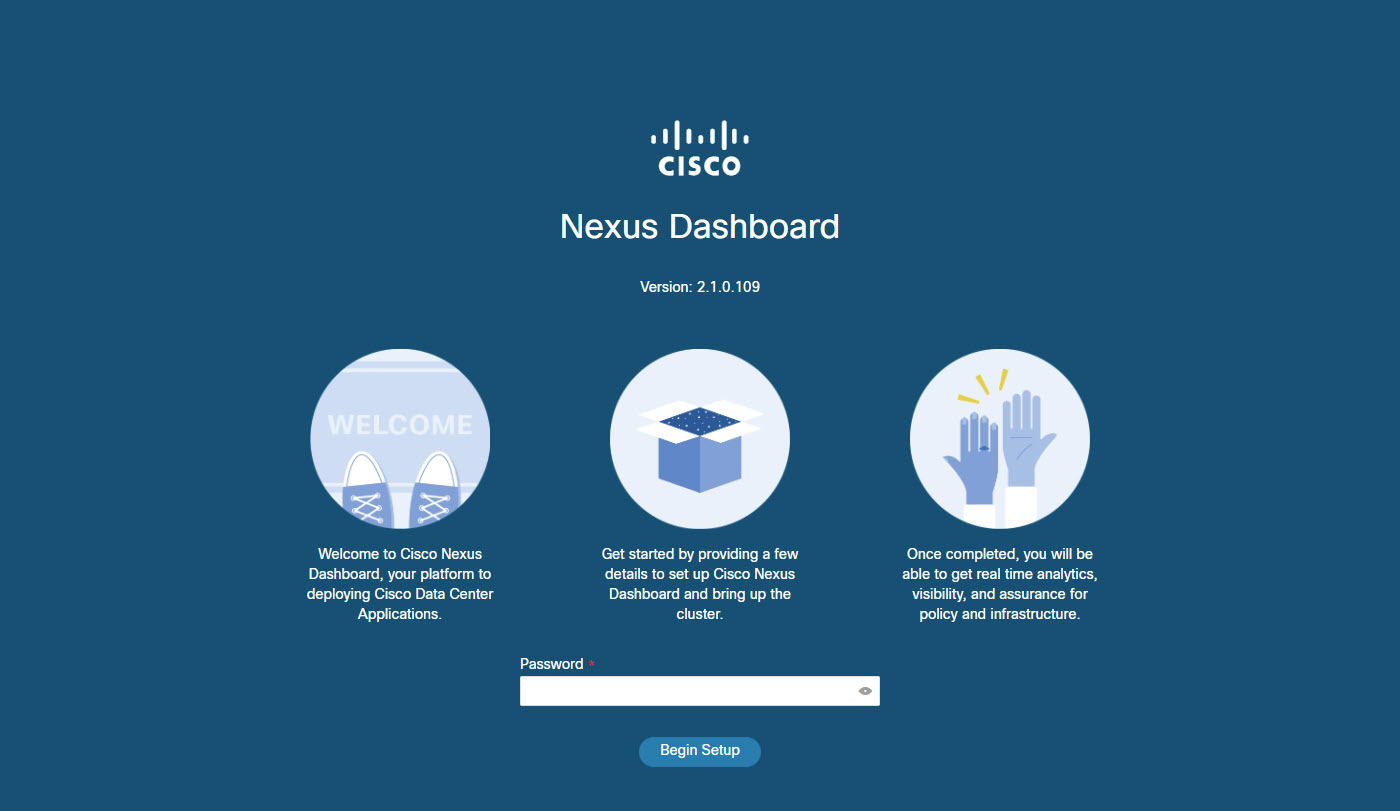
Open your browser and navigate to https://<first-node-management-ip> to open the GUI.

The rest of the configuration workflow takes place from the first node's GUI. You do not need to log in to or configure the other two nodes directly.

Enter the password you provided in a previous step and click Begin Setup

Step 4

Provide the Cluster Details.

In the Cluster Details screen of the initial setup wizard, provide the following information:

  1. Provide the Cluster Name for this Nexus Dashboard cluster.

  2. Click +Add NTP Host to add one or more NTP servers.

    You must provide an IP address, fully qualified domain name (FQDN) are not supported.

    After you enter the IP address, click the green checkmark icon to save it.

  3. Click +Add DNS Provider to add one or more DNS servers.

    After you enter the IP address, click the green checkmark icon to save it.

  4. Provide a Proxy Server.

    For clusters that do not have direct connectivity to Cisco cloud, we recommend configuring a proxy server to establish the connectivity, which will allow you to mitigate risk from exposure to non-conformant hardware and software in your fabrics.

    If you want to skip proxy configuration, click the information (i) icon next to the field, then click Skip.

  5. (Optional) If your proxy server required authentication, change Authentication required for Proxy to Yes and provide the login credentials.

  6. (Optional) Expand the Advanced Settings category and change the settings if required.

    Under advanced settings, you can configure the following:

    • Provide one or more search domains by clicking +Add DNS Search Domain.

      After you enter the IP address, click the green checkmark icon to save it.

    • Provide custom App Network and Service Network.

      The application overlay network defines the address space used by the application's services running in the Nexus Dashboard. The field is pre-populated with the default 172.17.0.1/16 value.

      The services network is an internal network used by the Nexus Dashboard and its processes. The field is pre-populated with the default 100.80.0.0/16 value.

      Application and Services networks are described in the Prerequisites and Guidelines section earlier in this document.

  7. Click Next to continue.

Step 5

In the Node Details screen, provide the node's information.

  1. Click the Edit button next to the first node.

  2. Provide the node's Name.

  3. Provide the node's Data Network information.

    The Management Network information is already pre-populated with the information you provided for the first node.

    You must provide the data network IP address, netmask, and gateway. Optionally, you can also provide the VLAN ID for the network. For most deployments, you can leave the VLAN ID field blank.

  4. (Optional) Provide IPv6 addresses for the management and data networks.

    Starting with release 2.1.1, Nexus Dashboard supports dual stack IPv4/IPv6 for the management and data networks.

    Note


    If you want to provide IPv6 information, you must do it during cluster bootstrap process. If you deploy the cluster using only IPv4 stack and want to add IPv6 information later, you would need to redeploy the cluster.

    All nodes in the cluster must be configured with either only IPv4 or dual IPv4/IPv6 stack.

  5. Click Save to save the changes.

Step 6

Click Add Node to add the second node to the cluster.

The Node Details window opens.

  1. Provide the node's Name.

  2. In the CIMC Details section, provide the node's CIMC IP address and login credentials, then click Verify.

    The IP address and login credentials are used to configure that node.

  3. Provide the node's Management Network information.

    You must provide the management network IP address, netmask, and gateway.

  4. Provide the node's Data Network information.

    You must provide the data network IP address, netmask, and gateway. Optionally, you can also provide the VLAN ID for the network. For most deployments, you can leave the VLAN ID field blank.

  5. (Optional) Provide IPv6 information for the management and data networks.

    Starting with release 2.1.1, Nexus Dashboard supports dual stack IPv4/IPv6 for the management and data networks.

    Note


    If you want to provide IPv6 information, you must do it during cluster bootstrap process. If you deploy the cluster using only IPv4 stack and want to add IPv6 information later, you would need to redeploy the cluster.

    All nodes in the cluster must be configured with either only IPv4 or dual IPv4/IPv6 stack.

  6. Click Save to save the changes.

Step 7

Repeat the previous step to add the 3rd node.

Step 8

Click Next to continue.

Step 9

In the Confirmation screen, review the entered information and click Configure to create the cluster.

During the node bootstrap and cluster bring-up, the overall progress as well as each node's individual progress will be displayed in the UI.

It may take up to 30 minutes for the cluster to form and all the services to start. When cluster configuration is complete, the page will reload to the Nexus Dashboard GUI.

Step 10

Verify that the cluster is healthy.

It may take up to 30 minutes for the cluster to form and all the services to start.

After all three nodes are ready, you can log in to any one node via SSH and run the following command to verify cluster health:

  1. Verify that the cluster is up and running.

    You can check the current status of cluster deployment by logging in to any of the nodes and running the acs health command.

    While the cluster is converging, you may see the following outputs:

    $ acs health
    k8s install is in-progress
    $ acs health
    k8s services not in desired state - [...]
    $ acs health
    k8s: Etcd cluster is not ready
    When the cluster is up and running, the following output will be displayed:
    $ acs health
    All components are healthy
  2. Log in to the Nexus Dashboard GUI.

    After the cluster becomes available, you can access it by browsing to any one of your nodes' management IP addresses. The default password for the admin user is the same as the rescue-user password you chose for the first node of the Nexus Dashboard cluster.

Step 11

If you plan to host multiple applications in the same cluster, configure deployment profiles for the App Infra Services.

If you plan to host only a single application in your Nexus Dashboard cluster, skip this step.

If you are co-hosting multiple applications in the same cluster, you must configure the App Infra Services with deployment profiles appropriate for your combination of applications and fabric sizes.

After the cluster upgrade is completed, follow the instructions described in the "App Infra Services" section of the Cisco Nexus Dashboard User Guide, which is also available in the products GUI.