Alarms
This tab displays the alarms that are generated for various categories. This tab displays information such as ID (optional), Severity, Failure Source, Name, Category, Acknowledged, Creation Time, Last Updated (optional), Policy, and Message. You can specify the Refresh Interval in this tab. You can select one or more alarms and then acknowledge or unacknowledge their status using the Change Status drop-down list. In addition, you can select one or more alarms and then click the Delete button to delete them.
Alarms Raised
UI Path: Operations > Event Analytics > Alarms
-
Click the Alarms Raised tab to view the alarm policies that were triggered by an alarm.
-
Click on the Severity in the Alarms table to view the history of the alarms raised due to the same policy on the same ITL/ITN flow.
-
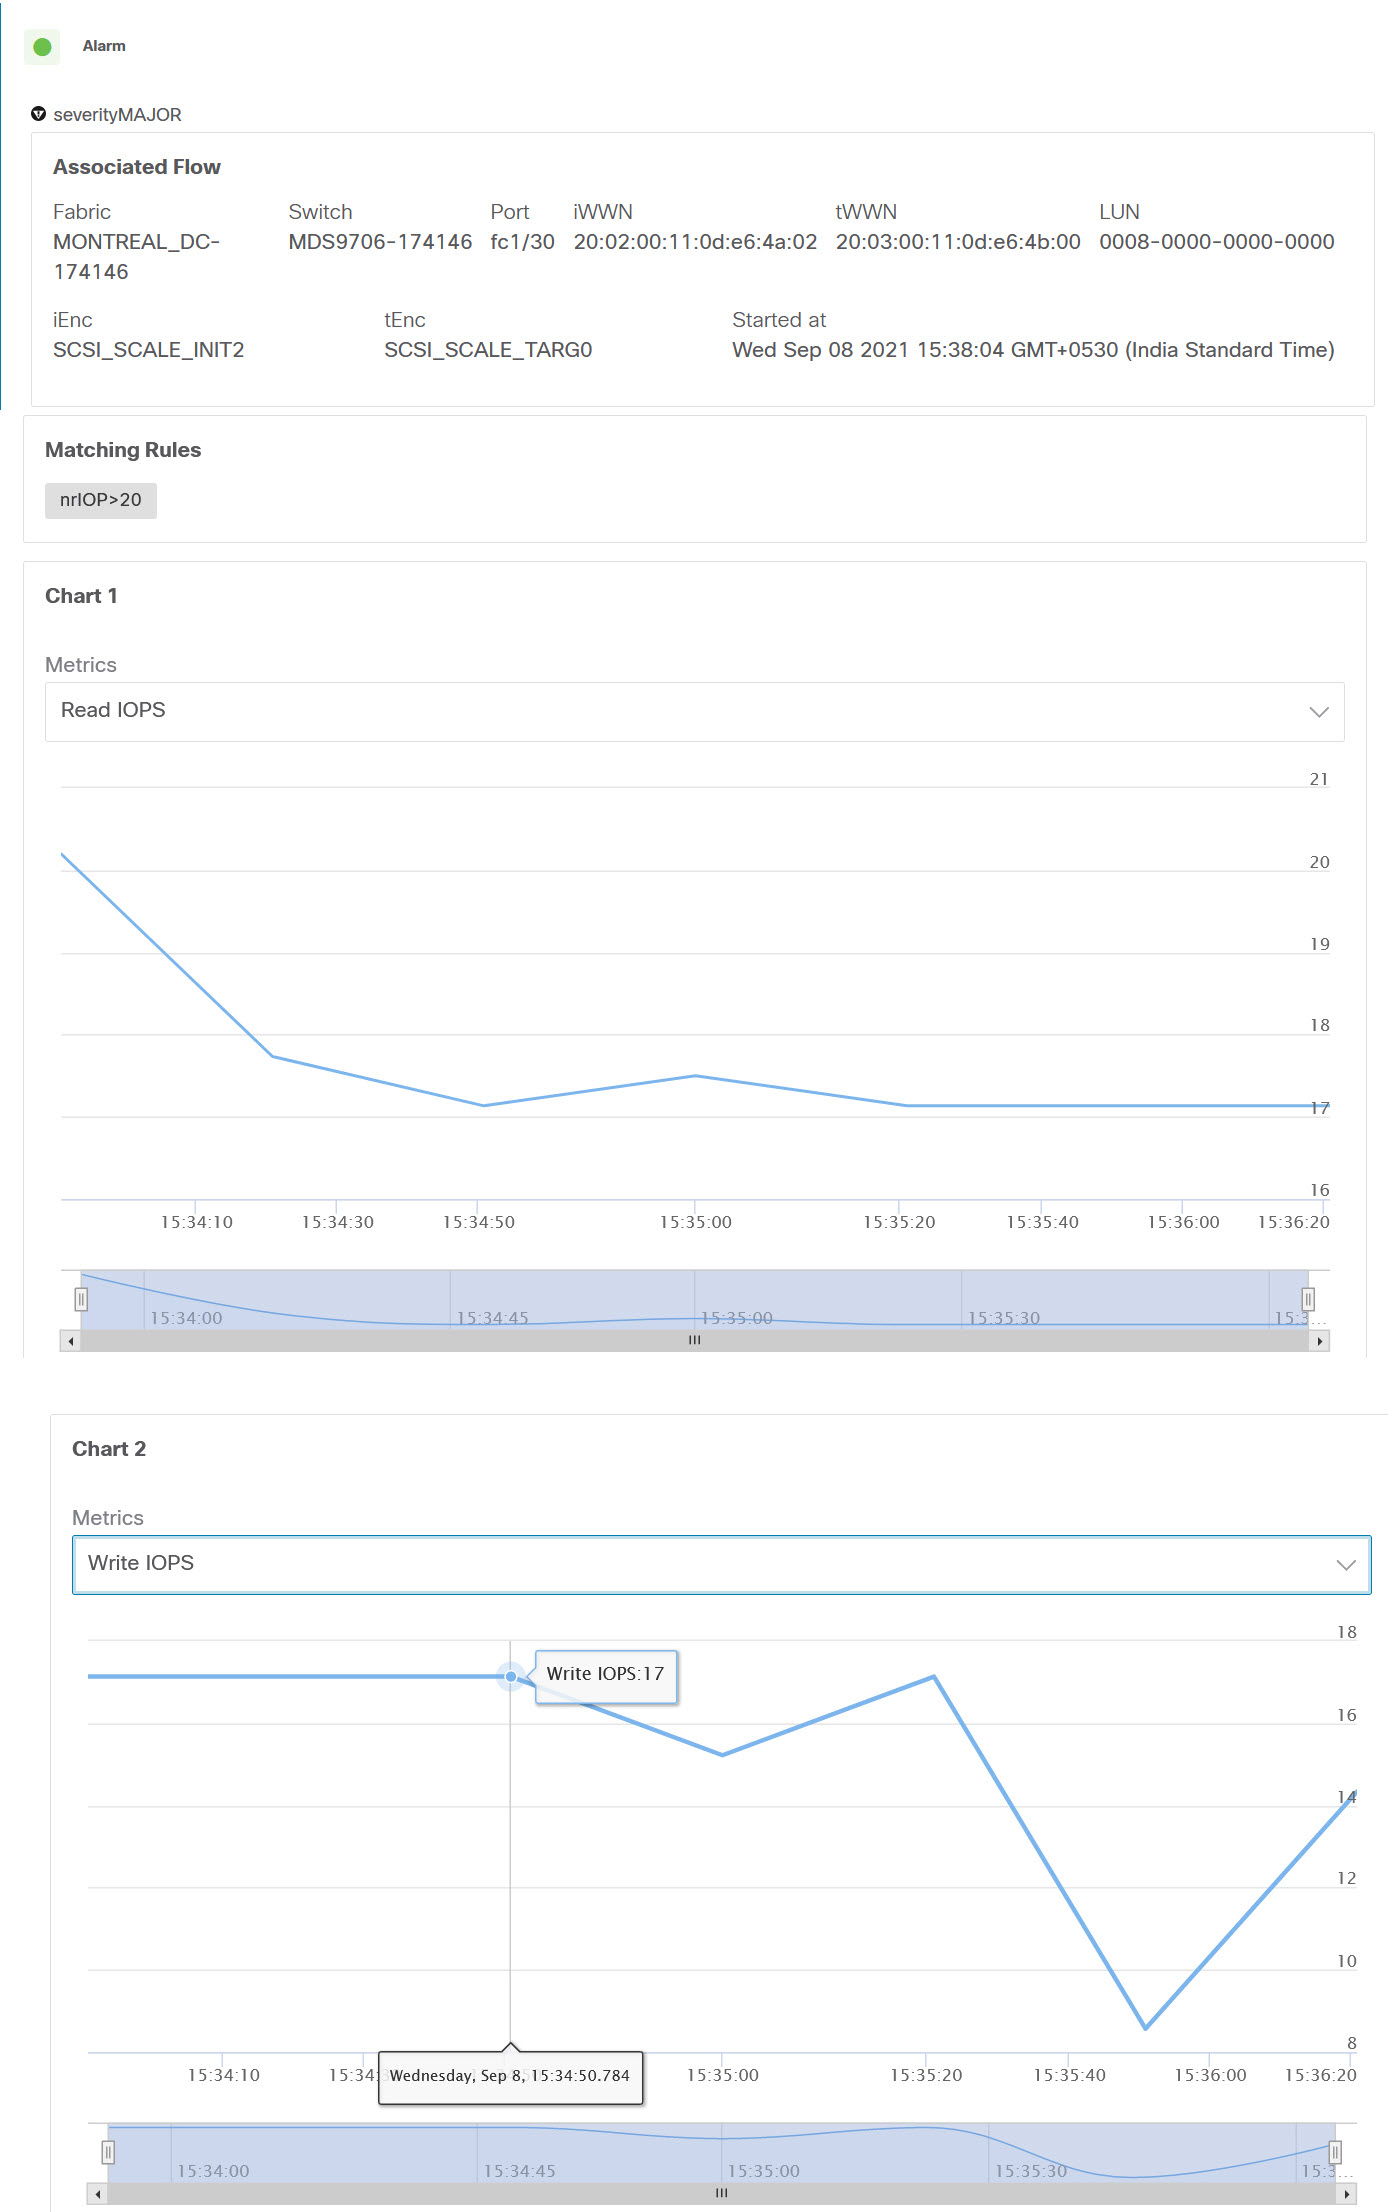
Click on policy ID in ID column to view the charts.
A slide-in pane appears with charts.
-
Choose required Metrics from drop-down list to view the graph.

Note
These metrics can be viewed only for SAN Insights Anomaly Policy.
The following table describes the fields that appear on Operations > Event Analytics > Alarms > Alarms Raised.
| Field | Description |
|---|---|
| Severity | Specifies the severity of the alarm |
| Source | Specifies the name of the source. |
| Name | Specifies the name of the alarm |
| Category | Specifies the category of the alarm |
| Creation Time | Specifies the time at which the alarm was created |
| Policy | Specifies the policy of the alarm |
| Message | Displays the message. |
| Ack User | Displays the username who acknowledged the alarm. |
The following table describes the action items, in the Actions menu drop-down list, that appear on Alarms Raised tab.
| Action Item | Description | ||
|---|---|---|---|
| Acknowledge |
Choose one or multiple alarms and choose Acknowledge. Allows you to bookmark the alarms and adds ack user name to Acknowledged column. |
||
| Unacknowledge |
Choose one or multiple alarms and choose Unacknowledge to remove the bookmarked alarms.
|
||
| Clear |
Choose alarm and choose Clear to clear the alarm policy manually. The cleared alarms will be moved to Alarm Cleared tab. |
||
| Delete Alarm | Choose an alarm and choose Delete to delete the alarm. |
Alarms Cleared
UI Path: Operations > Event Analytics > Alarms > Alarms Cleared
Alarms Cleared tab has the list of alarms which are cleared in the Alarms Raised tab. This tab displays information such as ID (optional), Severity, Failure Source, Name, Category, Acknowledged, Creation Time, Cleared At (optional), Cleared By, Policy, and Message. You can view the cleared alarm details for maximum of 90 days.
You can choose one or more alarms and click the Actions > Delete to delete them.
The following table describes the fields that appear on Alarms Cleared tab.
| Field | Description |
|---|---|
| Severity | Specifies the severity of the alarm. |
| Source | Specifies the IP Address of source alarm. |
| Name | Specifies the name of the alarm. |
| Category | Specifies the category of the alarm. |
| Creation Time | Specifies the time at which the alarm was created. |
| Cleared Time | Specifies the time at which the alarm was cleared. |
| Cleared By |
Specifies the user who cleared the alarm. |
| Policy | Specifies the policy of the alarm. |
| Message | Specifies the CPU utilization and other details of alarm |
| Ack User | Specifies the acknowledged user role name. |
The following table describes the action items, in the Actions menu drop-down list, that appear on Alarms Cleared tab.
| Action Item | Description |
|---|---|
| Delete Alarm | Select an alarm and choose Delete to delete the cleared alarm |
Monitoring and Adding Alarm Policies
In Cisco SAN Controller to enable alarms, Navigate to , click Alarm Policies on vertical tab. Ensure that the Enable external alarms check box is selected. You must restart SAN Controller Server to bring this into effect.
You can forward alarms to registered SNMP Listeners in SAN Controller. From Cisco SAN Controller web UI, choose Settings > Server Settings > Alarms, ensure that the Enable external alarms check box is selected. You must restart SAN Controller Server to bring this into effect.
You can forward alarms to registered SNMP Listeners in SAN Controller. From Cisco SAN Controller web UI, choose Settings > Server Settings > Alarms, enter an external port address in alarm.trap.listener.address field, click Apply Changes, and restart SAN Controller.
Note |
Ensure that you select Forwarding check box in Alarm Policy creation dialog window to enable forwarding alarms to external SNMP Listener. |
The following table describes the fields that appear on Operations > Event Analytics > Alarms > Alarms Policies.
| Field | Description |
|---|---|
| Name | Specifies the name of the alarm policy |
| Description | Specifies the description of the alarm policy |
| Status |
Specifies the status of the alarm policy:
|
| Policy type |
Specifies the type of the policy:
|
| Devices | Specifies the devices to which the alarm policy is applied. |
| Interfaces | Specifies the interfaces. |
| Details | Specifies the details of the policy. |
The following table describes the action items, in the Actions menu drop-down list that appear on Operations > Event Analytics > Alarms > Alarms Policies.
| Action Item | Description |
|---|---|
|
Create new alarm policy |
Choose to create a new alarm policy. See Create new alarm policy section. |
|
Edit |
Select a policy and choose Edit to edit the alarm policy. |
|
Delete |
Select a policy and choose Delete to delete the alarm policy. |
|
Activate |
Select a policy and choose Activate to activate and apply the alarm policy. |
|
Deactivate |
Select a policy and choose Deactivate to disable and deactivate the alarm policy. |
|
Import |
Select to import alarm policies from a .txt file. |
|
Export |
|
You can add alarm policies for the following:
-
Device Health Policy: Device health policies enable you to create alarms when Device SNMP Unreachable, or Device SSH Unreachable. Also, these policies enable you to monitor chassis temperature, CPU, and memory usage.
-
Interface Health Policy: Interface health policies enable you to monitor Up or Down, Packet Discard, Error, Bandwidth details of the interfaces. By default all interfaces are selected for monitoring.
-
Syslog Alarm Policy: Syslog Alarm Policy defines a pair of syslog messages formats; one which raises the alarm, and one which clears the alarm.
-
Hardware Health Policy: The hardware health policy is used to raise hardware-related alarms for different parameters, such as fan status, power supply, modular status and all interface-related alarms.
-
San Insights Anomaly Policy: SAN Insights Anomaly Policy enables you to create customized alarms to identify issues in the fabric using SAN Insight data.
From Cisco Nexus Dashboard SAN Controller Release 12.1.2e, you can modify or activate or use data of pre-provisioned SAN Insights anomaly policies which is in Not Active state by default.
Create new alarm policy
You can add alarm policies for the following:
-
Device Health Policy
-
Interface Health Policy
-
Syslog Alarm Policy
-
Hardware Health Policy
-
SAN Insights Anomaly
After you create a new alarm policy, in the Alarm Policies tab, click Refresh to view the newly-created alarm policy.
Device Health Policy
Device health policies enable you to create alarms when certain conditions are met. By default, all devices are selected for monitoring.
-
Policy Name: Specify a name for the policy. It must be unique.
-
Description: Specify a brief description for the policy.
-
Forwarding: You can forward alarms to registered SNMP listeners in SAN Controller. From the Web UI, choose .
Note
Ensure that you select Forwarding check box while configuring alarm policies to forward alarms to an external SNMP listener.
-
Email: You can forward alarm event emails to recipients when an alarm is created, cleared or when the severity is changed. From SAN Controller Web UI, choose . Configure the SMTP parameters, click Save, and restart SAN Controller services.
-
Specify the CPU utilization parameters, memory utilization parameters, and environmental temperature parameters.
-
Device Availability: Device health policies enable you to create alarms in the following situations:
-
Device Access: When device SNMP or device SSH is unnreachable.
-
Peripherals: When fan, power supply, or module is unnreachable.
-
Also, these policies enable you to monitor chassis temperature, CPU, and memory usage.
Select the devices for which you want to create policies. Specify the policy name, description, CPU Utilization parameters, Memory Utilization parameters, Environment Temperature parameters, device availability, and device features.
Interface Health Policy
Interface health policies enable you to monitor the interface status, packet discards, errors and bandwidth details of the interfaces. By default, all interfaces are selected for monitoring.
Select the devices for which you want to create policies and then specify the following parameters:
-
Policy Name: Specify a name for the policy. It must be unique.
-
Description: Specify a brief description for the policy.
-
Forwarding: You can forward alarms to registered SNMP listeners in SAN Controller. From the Web UI, choose .
Note
Ensure that you select Forwarding check box while configuring alarm policies to forward alarms to an external SNMP listener.
-
Email: You can forward alarm event emails to recipients when an alarm is created, cleared or when the severity is changed. From SAN Controller Web UI, choose . Configure the SMTP parameters, click Save, and restart SAN Controller services.
-
Linkstate: Choose linkstate option to check for the interface link status. You can generate an alarm whenever a link is down and clear the alarms when the link is up.
-
Bandwidth (In/Out): Allows you to set the maximum bandwidth allowed in inbound and outbound directions. The system generates alarms when the bandwidth exceeds the specified values.
-
Inbound Errors: Allows you to set thresholds for the number of inbound errors that are discarded after which it generates an alarm.
-
Outbound Errors: Allows you to set thresholds for the number of outbound errors that are discarded after which it generates an alarm.
-
Inbound Discards: Allows you to set thresholds for the number of inbound packets that are discarded after which it generates an alarm.
-
Outbound Discards: Allows you to set thresholds for the number of outbound packets that are discarded after which it generates an alarm.
Syslog Alarm
Syslog Alarm Policy defines a pair of Syslog messages formats; one which raises the alarm, and one which clears the alarm.
Select the devices for which you want to create policies and then specify the following parameters:
-
Devices: Define the scope of this policy. Select individual devices or all devices to apply this policy.
-
Policy Name: Specify the name for this policy. It must be unique.
-
Description: Specify a brief description for this policy.
-
Forwarding: You can forward alarms to registered SNMP listeners in SAN Controller. From Web UI, choose Settings > Server Settings > Events.
Note
Ensure that you select Forwarding check box in Alarm Policy creation dialog window to enable forwarding alarms to external SNMP listener.
-
Email: You can forward alarm event emails to recipient when alarm is created, cleared or severity changed. From SAN Controller Web UI, choose Settings > Server Settings > Events. Configure the SMTP parameters, click Save, and restart SAN Controller services.
-
Severity: Define the severity level for this syslog alarm policy. Choices are: Critical, Major, Minor, and Warning.
-
Identifier: Specify the identifier portions of the raise & clear messages.
-
Raise Regex: Define the format of a syslog raise message. The syntax is as follows: Facility-Severity-Type: Message
-
Clear Regex: Define the format of a syslog clear message. The syntax is as follows: Facility-Severity-Type: Message
The Regex definitions are simple expressions but not a complete regex. Variable regions of text are noted using $(LABEL) syntax. Each label represents a regex capture group (.+), which corresponds to one or more characters. The variable texts found in both raise and clear messages are used to associate the two messages. An Identifier is a sequence of one or more labels that appear in both messages. An Identifier is used to match a clear syslog message to the syslog message that raised the alarm. If the text appears only in one of the messages, it can be noted with a label and exclude it from the identifier.
Example: A policy with "Value": "ID1-ID2",
"syslogRaise": "SVC-5-DOWN: $(ID1) module $(ID2) is down $(REASON)"
"syslogClear": "SVC-5-UP: $(ID1) module $(ID2) is up."
In the example, ID1 and ID2 labels can be marked as an identifier to find the alarm. This identifier will be found in corresponding syslog messages. Label “REASON” is in the raise but not in the clear message. This label can be excluded from the identifier, as it has no impact on the syslog message to clear the alarm.
| Identifier | ID1-ID2 |
|---|---|
| Raise Regex | ETHPORT-5-IF_ADMIN_UP: Interface Ethernet15/1 is admin up . |
| Clear Regex | ETHPORT-5-IF_DOWN_NONE: Interface Ethernet15/1 is down (Transceiver Absent) |
In the above example, the regex expressions are part of the syslog messages that appear in the terminal monitor.
| Identifier | ID1-ID2 |
|---|---|
| Raise Regex | ETH_PORT_CHANNEL-5-PORT_DOWN: $(ID1): $(ID2) is down |
| Clear Regex | ETH_PORT_CHANNEL-5-PORT_UP: $(ID1): $(ID2) is up |
| Identifier | ID1-ID2 |
|---|---|
| Raise Regex | ETHPORT-5-IF_SFP_WARNING: Interface $(ID1), High Rx Power Warning |
| Clear Regex | ETHPORT-5-IF_SFP_WARNING: Interface $(ID1), High Rx Power Warning cleared |
Hardware Health Policy
The hardware health policy is used to raise hardware-related alarms for different parameters, such as fan status, power supply, modular status and all interface-related alarms.
By default, there is a hardware policy called as discovery that is standard with the NDFC installation. This hardware policy defines various conditions for different parameters. You can also create custom hardware policies for the parameters listed above and define regex expressions based on which alarms are raised.
By default, the All Devices option is selected automatically.
-
Policy Name: Specify a name for the policy. It must be unique.
-
Description: Specify a brief description for the policy.
-
Forwarding: You can forward alarms to registered SNMP listeners in SAN Controller. From the Web UI, choose .
Note
Ensure that you select Forwarding check box while configuring alarm policies to forward alarms to an external SNMP listener.
-
Email: You can forward alarm event emails to recipients when an alarm is created, cleared or when the severity is changed. From SAN Controller Web UI, choose . Configure the SMTP parameters, click Save, and restart SAN Controller services.
Hardware alarms are raised based on regex expressions that you enter when you are creating the policy.
In the Alarms area, create a hardware health policy to raise alarms for the following parameters:
-
Fan: Define the severity for fan-related alarms and determine the condition for the alarms.
-
Click the toggle switch next to Fan to enable the fan-related alarms.
-
Select the severity of the alarm:
-
Critical
-
Major
-
Minor
-
Warning
-
Cleared
-
-
Click Edit Regex, then enter the value that will trigger the alarm when the status is not that value.
For example, if you enter
okin the Trigger alarm when status is not field, NDFC will raise an alarm for any status other thanok, such as N/A. -
Click Save.
-
-
Power Supply: Define the severity for power supply-related alarms and determine the condition for the alarms.
-
Click the toggle switch next to Power Supply to enable the power supply-related alarms.
-
Select the severity of the alarm:
-
Critical
-
Major
-
Minor
-
Warning
-
Cleared
-
-
Click Edit Regex, then enter the value that will trigger the alarm when the status is not that value.
For example, if you enter
okin the Trigger alarm when status is not field, NDFC will raise an alarm for any status other thanok, such as failed, OffEnvpower, OffDenied, and so on. -
Click Save.
-
-
Module: Define the severity for module-related alarms and determine the condition for the alarms.
-
Click the toggle switch next to Module to enable the module-related alarms.
-
Select the severity of the alarm:
-
Critical
-
Major
-
Minor
-
Warning
-
Cleared
-
-
Click Edit Regex, then enter the value that will trigger the alarm when the status matches that value.
For example, if you were to enter the following value in the Trigger alarm when status matches regex field, as shown in the information (i) button:
^(?!ok|poweredDown|okButDiagFailed).*$NDFC will raise an alarm when modules are in states other than ok, poweredDown, and OkButDiag failed.
-
Click Save.
-
-
Interface Status: Define the severity for interface-related alarms and determine the condition for the alarms.
-
Click the toggle switch next to Interface Status to enable the interface-related alarms.
-
Click one or more toggle switches next to the appropriate severity to select the severity of the alarm:
-
Critical
-
Major
-
Minor
-
Warning
-
Cleared
-
-
Click Edit Regex, then enter the value that will trigger the alarm when the status matches that value. The provided regex expression is matched against the combined field of
admin_status:oper_status:status_reason.For example, if you were to enter the following value in the Trigger alarm when status matches regex field:
^up:down:(?!Link not connected|XCVR not inserted|sfpNotPresent|Channel admin down).*$NDFC will raise an alarm when interfaces are in states that match these values.
-
Click Save.
-
SAN Insights Anomaly Policy
From Cisco Nexus Dashboard SAN Controller Release 12.0(1), a new policy type saninsights is added. This new policy type can be customized to identify issues. You can create an alarm policy, based on specific flows to retain per interval data for analysis. If selected flow matches alarm policy, maintain the flow based on the parameters defined by the policy.
Procedure
|
Step 1 |
Choose . |
||
|
Step 2 |
Choose in the Alarms tab. |
||
|
Step 3 |
Choose . |
||
|
Step 4 |
Use the San Insights Anomaly Policy radio button. |
||
|
Step 5 |
Specify details for below parameters:
|
||
|
Step 6 |
Select time from drop-down list to define Capture Time and Retention Time.
|
||
|
Step 7 |
Select time or interval from the drop-down list to define Analysis Level and select severity level from drop-down list to define the Severity of this policy.
|
||
|
Step 8 |
You can define a new rule, click Add new rule and specify mandatory fields and then click Create new policy.
You can view the created alarms in the Alarms tab. |
 Feedback