- Troubleshooting
- Useful Commands
- Upgrading CIMC
- Manual Upgrades
- Re-Imaging Nodes
- AppStore Errors
- Event Export
- Factory Reset
- Changing Node IP Addresses
- Cluster Configuration Errors
- Two-Factor Authentication (2FA) Not Prompting for Login Info
- Red Hat Enterprise Linux (RHEL) Deployments
- Unable to Connect to Site After APIC Configuration Import
- Re-Adding Same Master Node to Physical Cluster
- Replacing Single Master Node in Virtual Clusters
- Replacing Single Physical Master Node without Standby Node
- Replacing Worker or Standby Nodes
- Initial Cluster Bootstrap Issues
- Multi-Cluster Connectivity Issues
- Generating Private Key, Creating CSR, and Obtaining CA-Signed Certificate
- Generating Private Key and Self-Signed Certificate
Troubleshooting
Useful Commands
You can log in to any of the cluster nodes as rescue-user for a limited access to system data. You can use the following commands to perform various operations in Cisco Nexus Dashboard.
-
acs health— displays cluster health information and any existing issues. -
acs show cluster— displays cluster configuration. -
acs show nodes— displays information about all nodes in the cluster. -
acs show masters— displays information aboutmasternodes in the cluster. -
acs show workers— displays information aboutworkernodes in the cluster. -
acs show standbys— displays information aboutstandbynodes in the cluster. -
acs ntp show— displays NTP information. -
acs techsupport collect -s system— collects Infra tech support information. -
acs techsupport collect -s cisco-mso— collects Nexus Dashboard Orchestrator service tech support information. -
acs techsupport collect -s cisco-nir— collects Nexus Dashboard Insights service tech support information. -
acs techsupport collect -s cisco-appcenter— collects App Store tech support information. -
acs version— returns the Nexus Dashboard version.
-
acs reboot— reboots the node with all services and configurations intact. -
acs reboot clean— removes all data for Nexus Dashboard and applications, but preserves the Nexus Dashboard bootstrap configuration and pod images.When you first bring up your Nexus Dashboard cluster, initial deployment process installs all required pod images. Retaining pod images will speed up cluster bring up after reboot.
If you plan to re-install all the nodes in the cluster, you must clean up the site and app information first. In this case, ensure that the sites are disabled in all applications and removed from the ND cluster.
-
acs reboot clean-wipe— removes all data for Nexus Dashboard and applications including application images, but preserves the Nexus Dashboard bootstrap configuration.When the cluster boots up again, pod images will be re-installed.
If you plan to re-install all the nodes in the cluster, you must clean up the site and app information first. In this case, ensure that the sites are disabled in all applications and removed from the ND cluster.
-
acs reboot factory-reset— removes all data for Nexus Dashboard and applications including cluster bootstrap configuration, but preserves application images.When you first bring up your Nexus Dashboard cluster, initial deployment process installs all required pod images. Retaining pod images will speed up cluster bring up.
If you plan to re-install all the nodes in the cluster, you must clean up the site and app information first. In this case, ensure that the sites are disabled in all applications and removed from the ND cluster.
-
acs reboot factory-wipe— removes all data for Nexus Dashboard and applications, including application images and cluster bootstrap configuration.When the cluster boots up again, the pod images will be re-installed.
If you plan to re-install all the nodes in the cluster, you must clean up the site and app information first. In this case, ensure that the sites are disabled in all applications and removed from the ND cluster.
-
The
/logsdirectory is mounted into therescue-usercontainer and can be inspected with standard tools. -
pingcommand is supported with most options. -
ipcommand supports a read-only subset of commands, includingip addr showandip route show. -
kubectlcommand can be used to support read-only kubectl commands. -
esctlcommand invokes a custom utility that allows you to get debug information about the Elasticsearch service.The following arguments are supported:
-
esctl help— returns usage information and available arguments described below. -
esctl get nodes— returns Elasticsearch cluster’s nodes information$ esctl get nodes ip heap.percent ram.percent [...] node.role master name 172.17.251.227 24 41 [...] mdi * es-data-1 172.17.251.243 21 39 [...] mdi - es-data-2 172.17.251.154 22 35 [...] mdi - es-data-0
-
esctl get health— returns Elasticsearch cluster’s health information$ esctl get health { "cluster_name" : "elasticsearch", "status" : "green", "timed_out" : false, "number_of_nodes" : 3, "number_of_data_nodes" : 3, "active_primary_shards" : 169, "active_shards" : 498, "relocating_shards" : 0, "initializing_shards" : 0, "unassigned_shards" : 0, "delayed_unassigned_shards" : 0, "number_of_pending_tasks" : 0, "number_of_in_flight_fetch" : 0, "task_max_waiting_in_queue_millis" : 0, "active_shards_percent_as_number" : 100.0 } -
esctl get indices— returns information about which indices exist in the cluster, number of docs inside and docs deleted, and the size of the index store.$ esctl get indices health status index ... green open cisco_nir-enrich_appdynamicsdb-2021.03.26 ... green open cisco_nir-svcstatsdb ... green open cisco_nir-operdb ... ...
-
esctl get allocexplain— provides explanations for shard allocations in the cluster and for any corresponding failures. -
esctl get shards— returns information about shards and to which nodes they belong.
There are two different instances of Elasticsearch service that can be running in your Nexus Dashboard:
-
elasticsearch— Elasticsearch used by most applications running in your Nexus Dashboard.This is the service for which
esctlcommand provides information by default. -
elasticsearch-nir— Elasticsearch used specifically by the Network Insights application. This service starts when the Network Insights application is enabled.You can use the
--name=elasticsearch-nirargument to have theesctlcommand display information about this instance, for example:$ esctl --name=elasticsearch-nir get health
-
-
acs apps instancescommand displays all applications running on the cluster. -
acs apps actionscommand displays the history operations done on the applications, such as installations, upgrades, or deletions.
Upgrading CIMC
When you upgrade Cisco Nexus Dashboard software, you may also have to upgrade the version of Cisco Integrated Management Controller (CIMC) that is running in your Nexus Dashboard nodes.
We recommend that you check the Release Notes for the list of the supported CIMC software versions.
The following steps describe how to upgrade the Nexus Dashboard CIMC using the Cisco Host Upgrade Utility (HUU). Additional details about the Host Upgrade Utility are available at Upgrading the Firmware on a Cisco UCS C-Series Server Using the HUU.

Note ![]() If you’re upgrading a single node that is running an older firmware to add it to an existing cluster, you will perform the following steps on that node only and not on all nodes in the cluster.
If you’re upgrading a single node that is running an older firmware to add it to an existing cluster, you will perform the following steps on that node only and not on all nodes in the cluster.
-
Review the information that is provided in the Cisco Nexus Dashboard Release Notes and confirm which CIMC software image is compatible with your Nexus Dashboard release. The Cisco Nexus Dashboard Release Notes are available on the Nexus Dashboard documentation page.
-
Allow for the appropriate amount of time for the upgrade.
The time needed for the process of upgrading a CIMC version varies, based on the speed of the link between the local machine and the UCS-C chassis, and the source/target software image, as well as other internal component versions.
-
Updating CIMC may also require updating your browser and/or Java software version to run the vKVM used to upgrade the CIMC.
Note ![]() Upgrading the CIMC version does not affect your production network as the Nexus Dashboard nodes are not in the data path of the traffic.
Upgrading the CIMC version does not affect your production network as the Nexus Dashboard nodes are not in the data path of the traffic.
To upgrade the Nexus Dashboard CIMC software:
-
Log in to the CIMC using the CIMC credentials.
Note that the CIMC credentials may be different from the Nexus Dashboard GUI credentials.
-
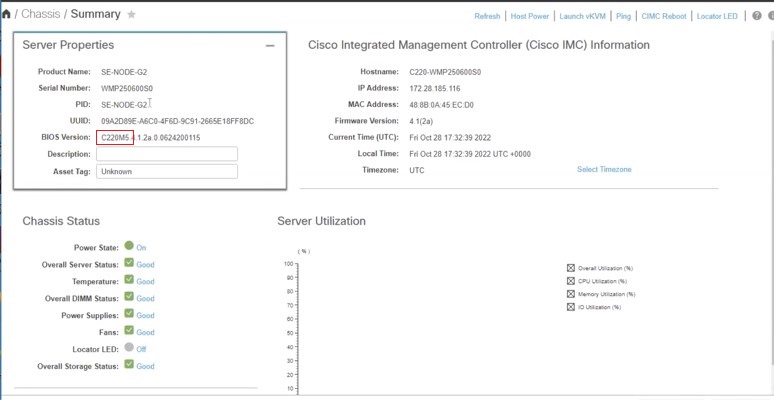
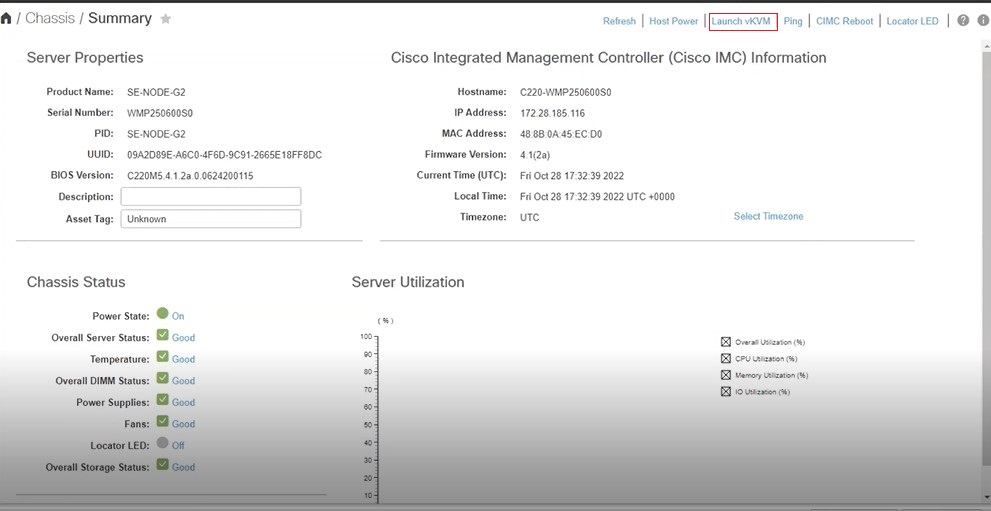
Determine the model of UCS platform for your Cisco Nexus Dashboard by locating the first part of the BIOS version under Server > Summary .
-
Locate the appropriate HUU ISO image at https://software.cisco.com/download.
-
In the search window in https://software.cisco.com/download, enter the UCS platform model that you found for your Cisco Nexus Dashboard in the previous step, without the dashes.
-
Click on the link from the search result to show the software that is available for your UCS platform.
-
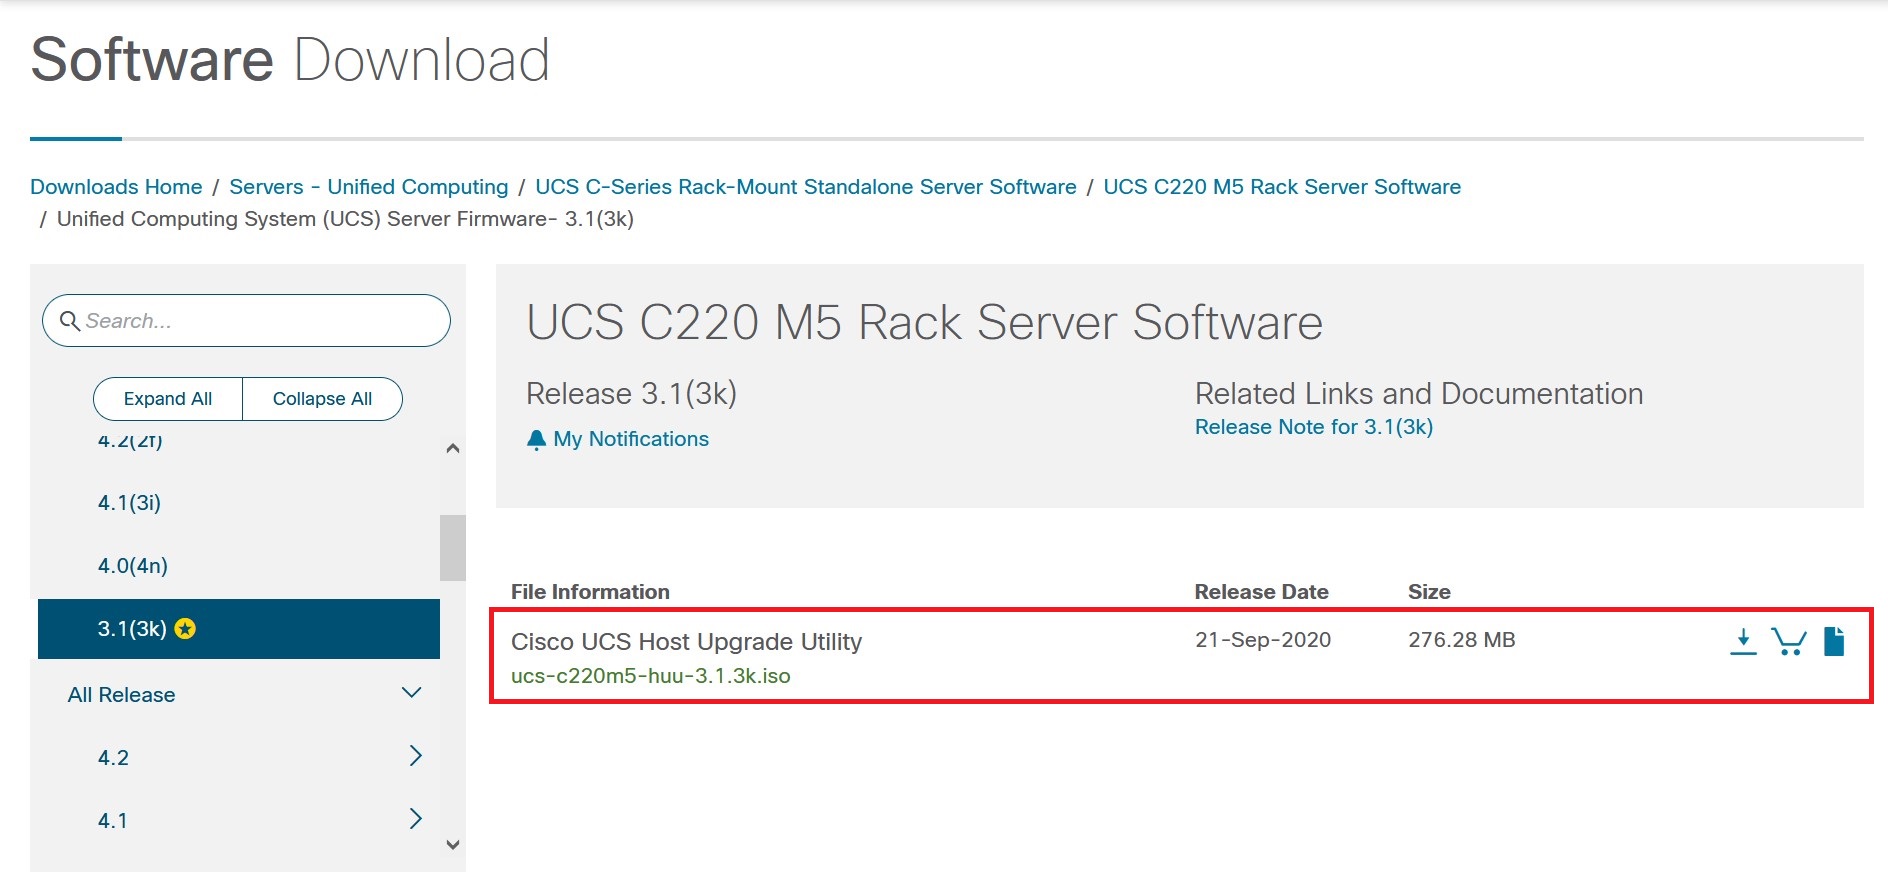
In the list of software available for your server, locate the firmware entry, which will be shown with an entry such as Unified Computing System (UCS) Server Firmware, and click on that firmware link.
-
Locate the Cisco UCS Host Upgrade Utility .iso image link and make a note of the release information for this image.
-
-
Download the appropriate HUU .iso image from the https://software.cisco.com/download site.
-
Launch the KVM console from CIMC GUI.
Note
 If you are unable to open the KVM console, you may need to update Java version.
-
In the KVM console, click Virtual Media > Activate Virtual Devices and accept the session.
-
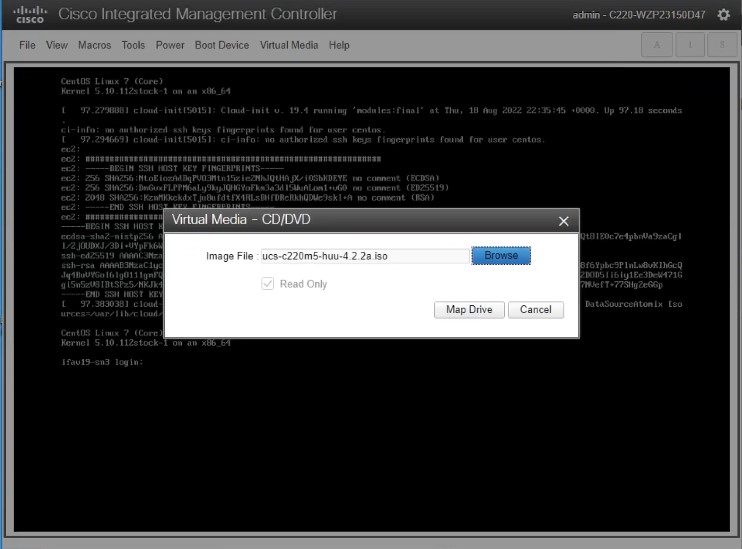
Click Virtual Media > Map CD/DVD and navigate to the downloaded HUU .iso image on your PC.
-
Select the downloaded HUU .iso image, then click Map Drive to map the downloaded ISO on your PC.
-
Click Faults and Logs > System Event Log to check the logs. If the logs are full, clear them by selecting and clicking Clear Log.
-
Click Power > Power cycle system to perform a cold reboot.
-
Press F6 to enter the boot menu so that you can select the mapped DVD that you want to boot from.
-
When prompted, enter the password. The default password is password.
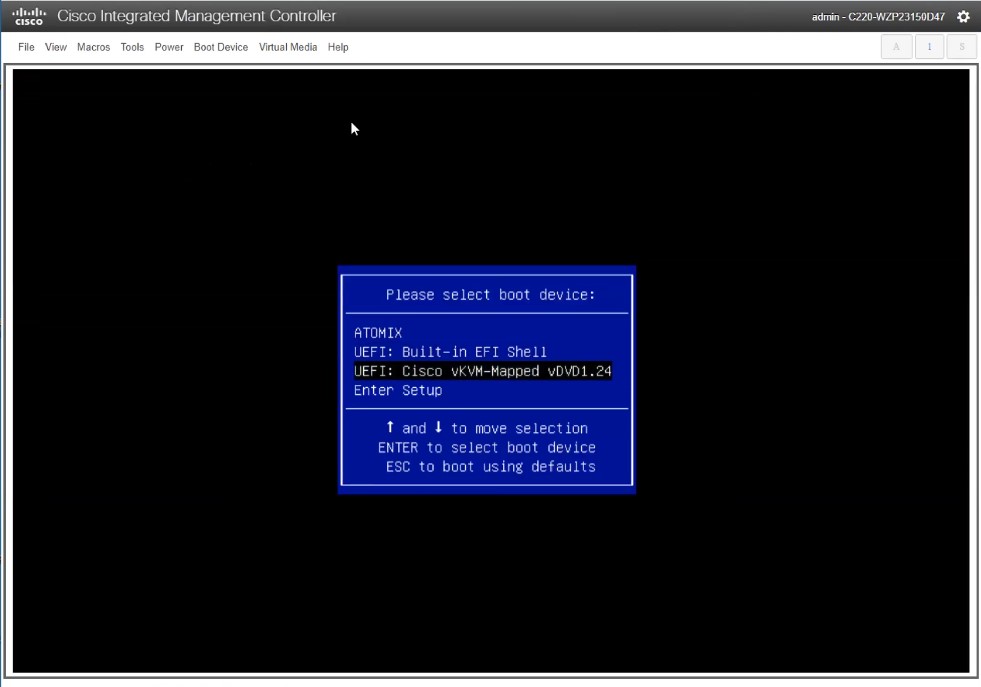
-
When prompted to select the boot device, select the Cisco vKVM-Mapped vDVD option, as shown in the figure below.
-
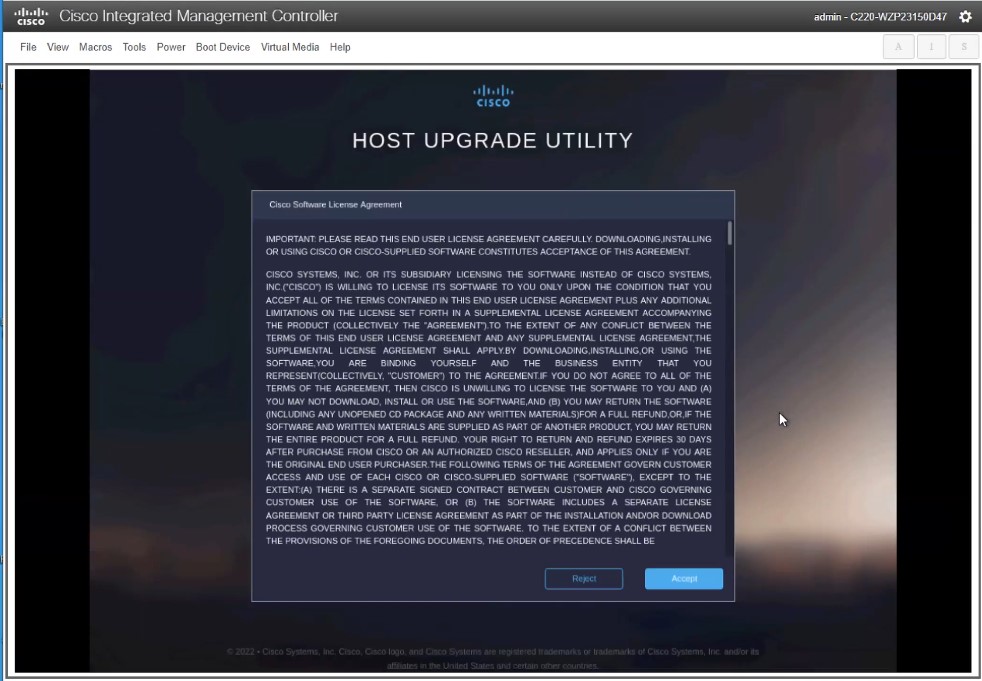
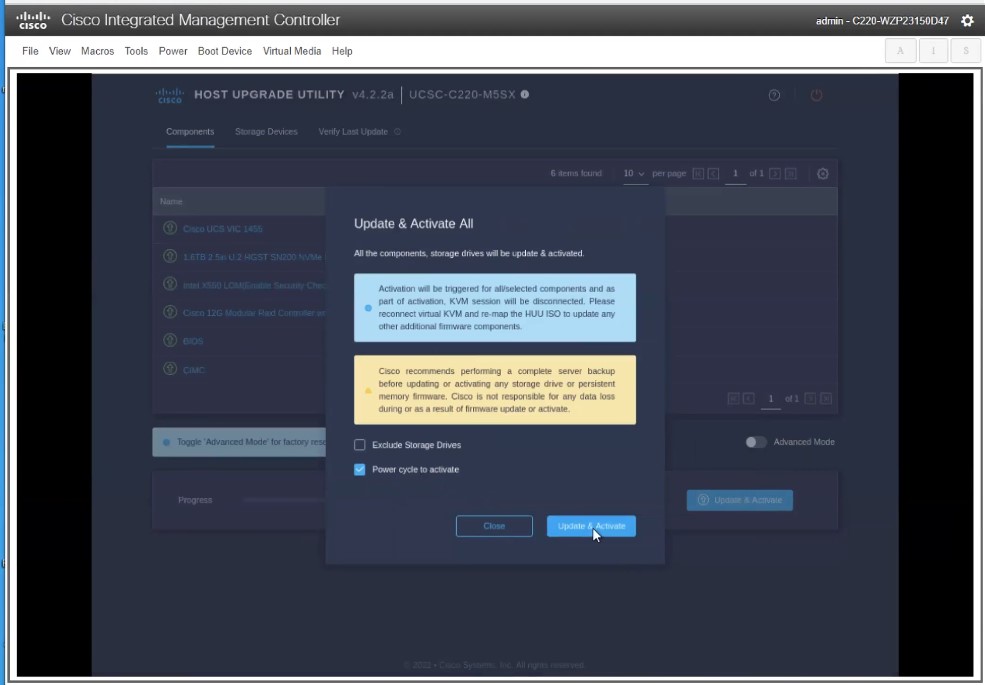
Wait for the proces to complete, then accept the terms and conditions when prompted. Click Accept and then click Update & Activate.
You can verify that the upgrade was completed successfully through the GUI or by booting up the CIMC HUU and selecting Last Update Verify to ensure that all of the components passed the upgrade successfully.
-
After upgrade is completed, check if Trusted Platform Module State (TPM) is enabled. If it is not enabled, navigate to BIOS > Configure BIOS > Security, enable the Trusted Platform Module State option and click Save.
Manual Upgrades
We recommend using the procedure described in Firmware Management (Cluster Upgrades) section to upgrade your cluster.
However, if you want to perform a manual upgrade of an single node (if you’re adding a new node to the cluster but the node is running older firmware) or entire cluster (in case the GUI upgrade did not succeed), you can use the following steps instead.
Note ![]() If you’re upgrading a single node that is running an older firmware to add it to an existing cluster, you will perform the following steps on that node only and not on the entire cluster.
If you’re upgrading a single node that is running an older firmware to add it to an existing cluster, you will perform the following steps on that node only and not on the entire cluster.
-
Log in to the nodes you want to upgrade as
rescue-user. -
Copy the upgrade ISO image file into the
/tmpdirectory on each node. -
Start the upgrade on all nodes.
You can upgrade all nodes in parallel.
# acs installer update -f /tmp/nd-dk9.2.1.1a.iso
Warning: This command will initiate node update to new version.
Proceed? (y/n): y
Update in Progress ... Do not press Ctrl^C
-
Wait for the upgrade to complete.
Note
You must wait for all nodes to finish upgrading before proceeding to the next step.
Update succeeded, reboot your host
-
Reboot one of the nodes.
Ensure that the upgrade is completed on all nodes as mentioned in the previous step before restarting any one node.
# acs reboot
This command will restart this device, Proceed? (y/n): y
-
Verify the node is healthy.
# acs health
All components are healthy
-
After the first node is successfully upgraded and healthy, reboot the other two nodes one at a time.
Note
You must wait for the rebooted node to come up and ensure that the node is healthy using the acs healthcommand before restarting the next node.
-
Once all nodes are up running the new version and are healthy, run post-upgrade tasks.
You can run the following command on all nodes in parallel.
# acs installer post-update
Warning: This command will run the post-update scripts. Proceed? (y/n): y
Update in Progress ... Do not press Ctrl^C
Post-update succeeded
-
Wait for the post-upgrade tasks to complete.
During this stage, the UI will show the progress, which looks similar to the initial cluster deplyment. After the post-upgrade processes finish, you will be able to log in to the node as usual.
Re-Imaging Nodes
When you first receive the Nexus Dashboard physical hardware, it comes preloaded with the software image. If you simply want to configure the existing software, skip this section and proceed to Managing Worker Nodes or Managing Standby Nodes.
If you are looking to manually upgrade the node to the latest software version, follow the instructions in Manual Upgrades instead.
This section describes how to redeploy the software stack on the Nexus Dashboard hardware. You may need to use the following steps in case of a catastrophic failure where you are no longer able to access the server’s operating system and GUI, or in case you want to deploy a different release that does not support direct upgrade or downgrade from your existing cluster.
Note ![]() If you are planning to re-install an existing Nexus Dashboard cluster, you must clean up the site and app information first. In this case, ensure that the sites are disabled in all applications and removed from the ND cluster before bringing it down.
If you are planning to re-install an existing Nexus Dashboard cluster, you must clean up the site and app information first. In this case, ensure that the sites are disabled in all applications and removed from the ND cluster before bringing it down.
-
You must be able to connect to the server’s CIMC using the Serial over LAN (SoL) port, so ensure that you have the server’s CIMC IP address and an SSH client.
Detailed information about CIMC configuration is available at https://www.cisco.com/c/en/us/support/servers-unified-computing/ucs-c-series-integrated-management-controller/products-installation-and-configuration-guides-list.html
-
Ensure that you are running a supported version of Cisco Integrated Management Controller (CIMC).
-
Recommended version: CIMC, Release 4.1(3b).
-
Minimum supported version: CIMC, Release 4.0(1a).
-
To re-install the Nexus Dashboard software:
-
Download the Cisco Nexus Dashboard image.
-
Browse to the Nexus Dashboard page and download the image.
https://www.cisco.com/c/en/us/support/data-center-analytics/nexus-dashboard/series.html
-
Click the
Downloadstab. -
Choose the Nexus Dashboard version you want to download.
-
Download the Cisco Nexus Dashboard image (nd-dk9.<version>.iso).
-
Host the image in a web server in your enviornment
You will need to provide an
httpURL when mounting the image.
-
-
Deploy the ISO to the server.
This step requires you to connect to the server’s CIMC. Detailed information about CIMC configuration is available at https://www.cisco.com/c/en/us/support/servers-unified-computing/ucs-c-series-integrated-management-controller/products-installation-and-configuration-guides-list.html.
-
SSH into the server’s CIMC.
-
Connect to the virtual media.
C220-WZP21510DHS# scope vmedia
C220-WZP21510DHS /vmedia #
-
Map the Nexus Dashboard image you downloaded to the
CIMC-Mapped vDVD.C220-WZP21510DHS /vmedia # map-www image http://<ip-address>/<path> <image>
For example:
C220-WZP21510DHS /vmedia # map-www image http://172.31.131.47/images nd-dk9.2.0.1.iso
-
Verify that the image is mounted.
C220-WZP21510DHS /vmedia # show mappings
Volume  Map-Status  Drive-Type  Remote-Share   Remote-File       Mount-Type
------- ----------- ----------- -------------- ----------------- --------
image   OK          CD          [<ip>/<path>]  nd-dk9.2.0.1.iso  www
-
Reboot the server and connect to its console.
C220-WZP23150D4C /vmedia # exit
C220-WZP23150D4C# scope chassis
C220-WZP23150D4C /chassis # power cycle
C220-WZP23150D4C /chassis # exit
C220-WZP23150D4C# connect host
CISCO Serial Over LAN:
Press Ctrl+x to Exit the session
-
Select the boot device.
Watch the boot process until you see the following message:
Press <F2> Setup, <F6> Boot Menu, <F7> Diagnostics, <F8> Cisco IMC Configuration, <F12> Network Boot
Then press F6 and select the virtual media device where you mounted the image (
Cisco CIMC-Mapped vDVD1):/------------------------------------\ | Please select boot device: | |------------------------------------| | (Bus 05 Dev 00)PCI RAID Adapter | | UNIGEN PHF16H0CM1-DTE PMAP | | Cisco vKVM-Mapped vHDD1.22 | | Cisco CIMC-Mapped vHDD1.22 | | Cisco vKVM-Mapped vDVD1.22 | | Cisco CIMC-Mapped vDVD1.22 | | Cisco vKVM-Mapped vFDD1.22 | | UEFI: Built-in EFI Shell | | IBA GE Slot 0100 v1585 | | IBA GE Slot 0101 v1585 | | Enter Setup | |------------------------------------| | ^ and v to move selection | | ENTER to select boot device | | ESC to boot using defaults | \------------------------------------/
-
Configure the networking.
When the server first boots, you will see the following output:
+ '[' -z http://172.31.131.47/nd-dk9.2.0.1.iso ']'
++ awk -F '/|:' '{print $4}'
+ urlip=172.31.131.47
+ '[' -z 172.31.131.47 ']'
+ break
+ '[' -n http://172.31.131.47/nd-dk9.2.0.1.iso ']'
+ set +e
+ configured=0
+ '[' 0 -eq 0 ']'
+ echo 'Configuring network interface'
Configuring network interface
+ echo 'type static, dhcp, bash for a shell to configure networking, or url to re-enter the url: '
type static, dhcp, bash for a shell to configure networking, or url to re-enter the url:
+ read -p '? ' ntype
? static (1)
+ case $ntype in
+ configure_static
+ echo 'Available interfaces'
Available interfaces
+ ls -l /sys/class/net
total 0
lrwxrwxrwx. 1 root root 0 Apr 26 01:21 eno1 -> ../../devices/pci0000:3a/0000:3a:00.0/0000:3b:00.0/net/eno1
lrwxrwxrwx. 1 root root 0 Apr 26 01:21 eno2 -> ../../devices/pci0000:3a/0000:3a:00.0/0000:3b:00.1/net/eno2
lrwxrwxrwx. 1 root root 0 Apr 26 01:21 eno5 -> ../../devices/pci0000:5d/0000:5d:00.0/0000:5e:00.0/0000:5f:01.0/0000:61:00.0/0000:62:00.0/0000:63:00.0/net/eno5
lrwxrwxrwx. 1 root root 0 Apr 26 01:21 eno6 -> ../../devices/pci0000:5d/0000:5d:00.0/0000:5e:00.0/0000:5f:01.0/0000:61:00.0/0000:62:00.0/0000:63:00.1/net/eno6
lrwxrwxrwx. 1 root root 0 Apr 26 01:21 lo -> ../../devices/virtual/net/lo
+ read -p 'Interface to configure: ' interface
Interface to configure: eno1  (2)
+ read -p 'address: ' addr
address: 172.23.53.59/21  (3)
+ read -p 'gateway: ' gw
gateway: 172.23.48.1  (4)
+ ip addr add 172.23.53.59/23 dev eno1
+ ip link set eno1 up
+ ip route add default via 172.23.48.1
RTNETLINK answers: Network is unreachable
++ seq 1 2
+ for count in '$(seq 1 2)'
+ ping -c 1 172.31.131.47
1 For IP address, enter dchpif there is a DHCP server in your environment orstatic.2 For the interface, enter the first management port ( eno1).3 If you chose static, provide the IP address for the connection.4 If you chose static, provide the gateway for the connection.
-
-
After the server boots from the provided image, select the only available installation option.
It may take up to 20 minutes for the installation process to complete.
After the image is deployed, you can add the node to your cluster as described in Managing Worker Nodes or Managing Standby Nodes.
AppStore Errors
When attempting to access the Services > AppStore tab in the Nexus Dashboard GUI, you may encounter the following error:
{
  "error": "There was a problem proxying the request"
}
When a master node where the AppStore service is running fails, it may take up to 5 minutes for the AppStore services to relocate to another master node
Simply wait for the services to recover and refresh the page.
Event Export
Syslog events are not reaching the intended external events monitoring service.
Most common cause of this issue is not configured or improperly configured Syslog destination server.
Ensure that the external server configuration in Cluster Configuration > Syslog is correct. For more information, see Cluster Configuration.
Remote server is allowing traffic from only a specific set of IP addresses and the traffic from the Nexus Dashboard nodes' IP addresses is not allowed.
Update your external server’s configuration to allow traffic from the Nexus Dashboard cluster nodes.
Factory Reset
You can reset the entire physical cluster by running the following command on each node:
# acs reboot factory-reset
Note ![]() Doing this will lose all cluster configuration and applications and you will need to rebuild the cluster.
Doing this will lose all cluster configuration and applications and you will need to rebuild the cluster.
If you have a virtual or cloud Nexus Dashboard cluster, we recommend simply deleting the existing VMs and re-deploying the entire cluster instead of reseting all the nodes, as described in the Cisco Nexus Dashboard Deployment Guide.
Changing Node IP Addresses
Changing the data network IP address is not supported. If you want to change the data IP address for the cluster nodes, you must re-create the cluster.
If you are running a single-node cluster, changing the management IP address is also not supported without re-creating the cluster.
If you are running a multi-node cluster, you can change the management IP addresses of one or more nodes as follows:
-
Navigate to your Nexus Dashboard’s Admin Console.
-
From the main navigation menu, select System Resources > Nodes.
-
From the (…) menu next to the node, choose Edit Node.
Note that you can only change the IP address of a node that you are not currently logged in to. To change the IP of the current node, navigate to a different node’s management IP address, log in, and repeat this procedure for the last node.
-
Update the Management Network Address and Management Network Gateway for the node.
For example,
172.31.140.58/24and172.31.140.1respectively. -
Click Save.
The changes will take effect immediately and you can access the nodes using the new IP addresses.
Cluster Configuration Errors
When you configure or change the proxy server in Nexus Dashboard, you may see a number of cisco-mso service: Replicaset() not in desired state errors in the Cluster Configuration page.
The errors are displayed while the service is restarting and will resolve on their own within 30-60 seconds.
Simply wait for the services to recover and refresh the page.
Two-Factor Authentication (2FA) Not Prompting for Login Info
After the initial login using two-factor authentication, subsequent login attempts do not ask for username and password information and present a blank page instead.
The cookie timeout configured for the OIDC application is longer than the authentication token timeout set in the Nexus Dashboard.
Clear your browser cache and the authentication process will work as expected.
Red Hat Enterprise Linux (RHEL) Deployments
You can view the installation logs by logging into your RHEL system and checking the /logs/ndlinux/ directory.
In order to run the common Nexus Dashboard troubleshooting commands described in the Troubleshooting sections, you must first access the Nexus Dashboard environment.
To access the Nexus Dashboard environment from your RHEL system:
-
Log in to your RHEL system using the Nexus Dashboard user you provided in the YAML configuration file during installation.
-
Run the
attach-ndcommand to access the Nexus Dashboard environment./usr/bin/attach-nd
After you access the Nexus Dashboard environment, you can use all the common Nexus Dashboard commands described in the Troubleshooting section of this guide.
Unable to Connect to Site After APIC Configuration Import
When you onboard a Cisco APIC site to Nexus Dashboard, APIC configuration is updated to reflect the onboarding. If you subsequently import an earlier configuration in APIC, the site may show as unavailable in Nexus Dashboard or services.
Earlier site configuration does not contain information specific to the Nexus Dashboard cluster where it is onboarded.
We recommend exporting APIC configuration after the site is onboarded in Nexus Dashboard for any future config restores.
To resolve the issue after it occurs, you can re-register the site in the Nexus Dashboard GUI:
-
Log in to your Nexus Dashboard cluster.
-
Navigate to Admin Console > Sites
-
From the Actions (…) menu next to the site, select Edit Site.
-
In the Site Edit screen, check the
Re-register Sitecheckbox and provide the site details again. -
Click Save.
Re-Adding Same Master Node to Physical Cluster
This section describes how to re-add a master node to a physical cluster. This scenario can happen if the node was accidentally or deliberately removed via configuration reset (such as acs reboot factory-reset) or vMedia re-install.
If you have a standby node in your cluster, simply convert the standby into a master node as described in Replacing Single Master Node with Standby Node and then add the old master node as a new standby node as described in Adding Standby Nodes.
If you need to completely replace (RMA) a master node due to hardware failure and do not have a standby node available, follow the procedure described in Replacing Single Physical Master Node without Standby Node instead.
To re-add the master node to the same cluster:
-
Ensure that the node is reset to factory settings.
If the node is in a bad state, log in to the node as
rescue-userand reset the node using the following command:# acs reboot factory-reset
-
Log in to the Nexus Dashboard GUI using the management IP address of one of the healthy nodes.
-
Navigate to System Resoruces > Nodes.
The node you want to replace will be listed as
Inactivein the UI. -
From the actions (…) menu for the node, select Register.
Register Node page will open.
-
In the Register Node page, provide the required information and click Validate.
For physical nodes, you need to provide the CIMC IP address and login information.
For virtual nodes, the management IP address will be retained and you need to provide only the password for the
rescue-user. -
Ensure the rest of the node information is accurate.
-
Click Register to re-register the node and re-add it as a
masternode to the cluster.It will take up to 20 minutes to bootstrap, configure, and re-add the node. After it’s done, the node will show as an
Activemaster node in the UI.
Replacing Single Master Node in Virtual Clusters
This section describes how to recover from a master node failure in a VMware ESX or Linux KVM virtual Nexus Dashboard cluster. The procedure involves deploying a brand new Nexus Dashboard node using the same form factor as the node which you are replacing and joining it as a master node to the remaining cluster.
-
Ensure that the failed node’s VM is powered down.
-
Bring up a new Nexus Dashboard node.
Bringing up an additional node in VMware ESX is described in Deploying Additional Virtual Nodes in VMware ESX. Note that you must bring up a node of the same type (
OVA-ApporOVA-Data) as the node you are replacing.Bringing up an additional node in Linux KVM is described in Deploying Additional Virtual Nodes in Linux KVM.
Note
Ensure that you use the same exact network configuration settings as you used for the failed node.
-
Power on the new node’s VM and wait for it to boot up.
-
Log in to the Nexus Dashboard GUI.
You can use the management IP address of one of the remaining healthy
masternodes. -
Replace the node.
-
From the left navigation pane, select System Resources > Nodes.
The node you are replacing will be listed as
Inactive. -
Click the (…) menu next to the inactive master node you want to replace and select Replace.
The Replace window will open.
-
Provide the Management IP Address and Password for the node, then click Verify.
The cluster will connect to the node’s management IP address to verify connectivity.
-
Click Replace.
It may take up to 20 minutes for the node to be configured and join the cluster.
-
Replacing Single Physical Master Node without Standby Node
The following section describes how to recover from a single master node failure in a physical Nexus Dashboard cluster without a standby node. This procedure is for hardware issues that require it to be physically replaced. If the node is simply in a bad software state, you can use the acs reboot clean commands instead and re-add the same node to the cluster as described in Re-Adding Same Master Node to Physical Cluster.
If your cluster has a standby node configured, we recommend using the steps described in Replacing Single Master Node with Standby Node instead.
-
Ensure that at least 2 master nodes are healthy.
If two of the master nodes are unavailable, you will need to manually restore the cluster as described in Replacing Two Master Nodes with Standby Nodes
-
Ensure that the master node you want to replace is powered off.
-
Prepare and deploy the new node as described in Deploying Additional Physical Nodes.
-
Ensure that you have the same CIMC IP address and login information on the new node as you configured for the failed node.
The remaining master node will use the CIMC information to restore configuration to the new node.
-
Ensure that the new node is powered on and note down its serial number.
To replace a single failed master node:
-
Log in to your Nexus Dashboard GUI using the management IP of one of the other
masternodes. -
From the main navigation menu, select System Resources > Nodes.
-
In the nodes list, find the Serial number of the node you want to replace and ensure that the node’s Status shows
Inactive. -
In the Nexus Dashboard’s Nodes screen, select the inactive node by clicking the checkbox next to it.
-
From the Actions menu, select Replace.
-
In the New Serial Number field, provide the serial number of the new node and click Replace.
After the process is completed, you will see the serial number of the old node updated to the new node’s serial number and the status will change to
Activeonce the new master has successfully joined the cluster.
Replacing Worker or Standby Nodes
When replacing a failed work node, you simply delete the Inactive node from the GUI and then deploy a brand new worker node as you typically would.
-
Ensure that the worker node you want to replace is powered off.
To replace a failed worker node:
-
Navigate to your Nexus Dashboard’s Admin Console.
-
From the main navigation menu, select System Resources > Nodes.
-
In the nodes list, find the Serial number of the node you want to replace and ensure that the node’s Status shows
Inactive. -
Select the inactive node by clicking the checkbox next to it.
-
From the Actions menu, select Delete.
This will remove the node from the list.
-
Power on the new node and add it as a new
workerorstandbynode to the cluster as described in Managing Worker Nodes or Managing Standby Nodes.Use the same configuration parameters as you used to set up the old node.
Initial Cluster Bootstrap Issues
This section describes the different stages of the initial cluster bootstrap process and summarizes some common issues you may run into when first deploying your Nexus Dashboard cluster.
After you bring up the nodes and provide each node’s information during the GUI setup, the initial bootstrap process goes through a number of stages to bring up the nodes, configure the required information, and create the cluster. The bootstrap screen allows you to track the progress and indicates any issues that may come up:
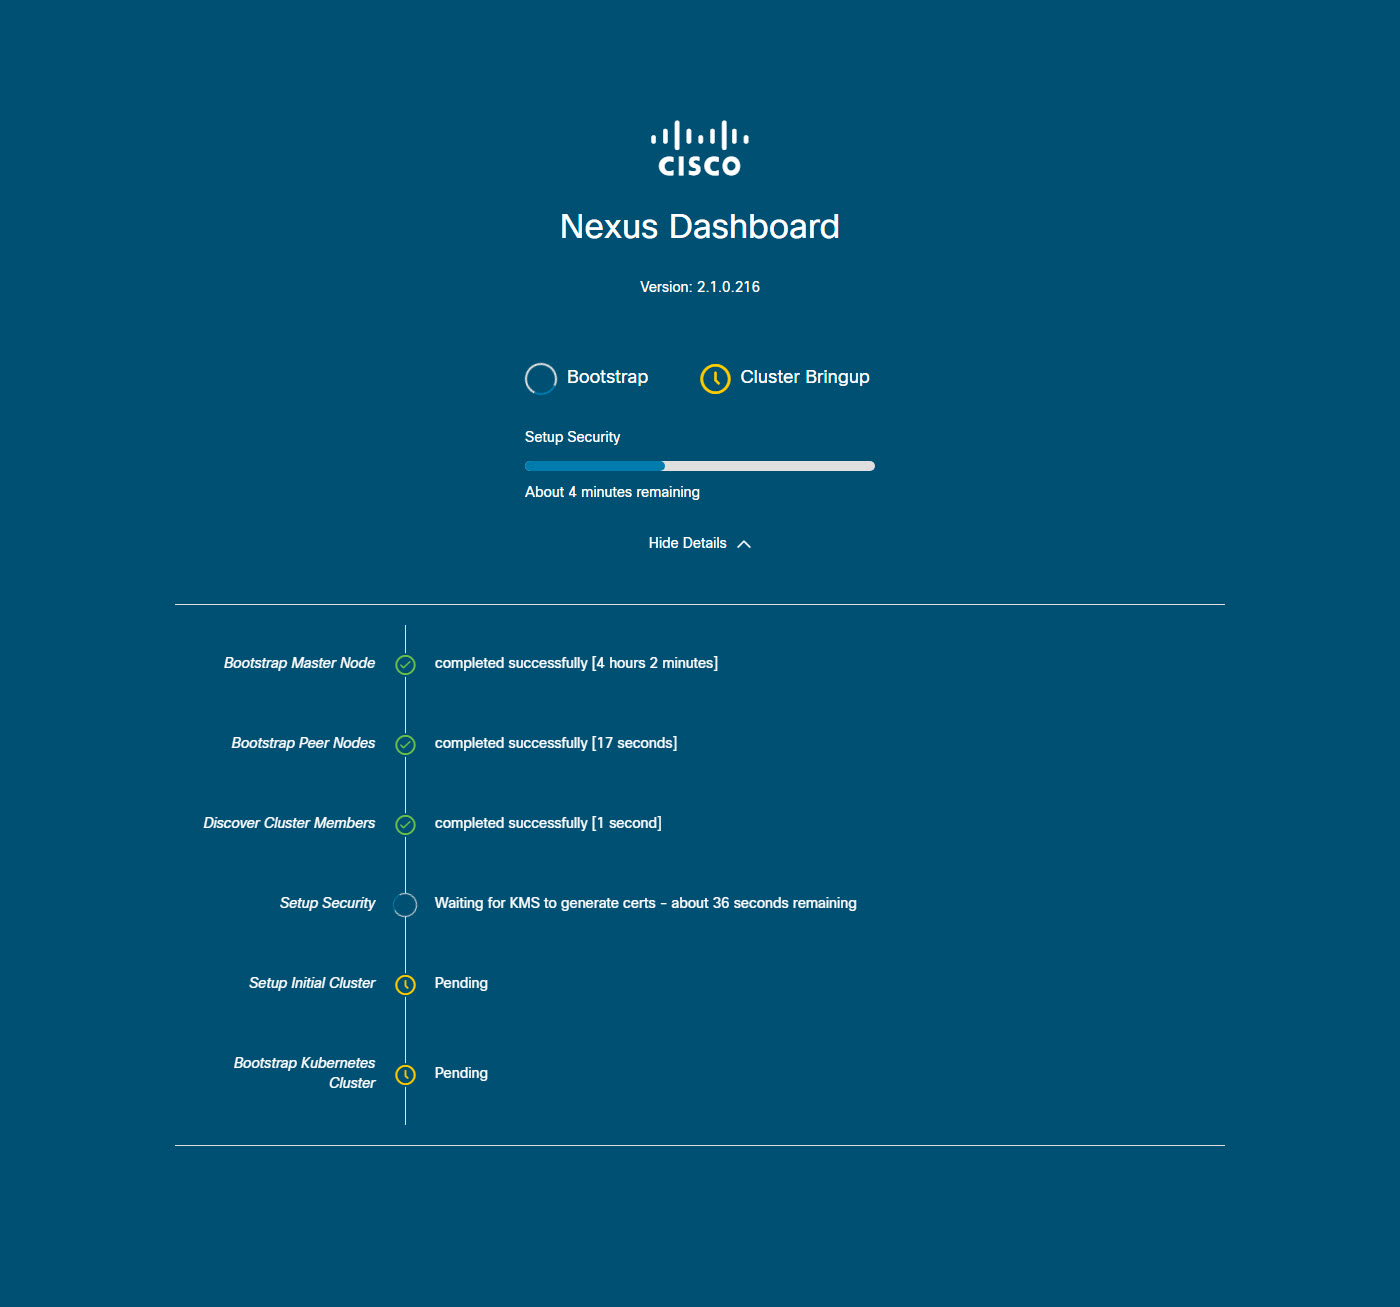
-
Bootstrap Master NodeandBootstrap Peer Nodes— bring up the first master node with the management and data networks IP addresses you provided. Then brings up the 2nd and 3rd master nodes with their respective IPs.If the process fails at one of these stages, connect to each node’s console and verify that all the information you provided is correct. You can view the configuration you provided using the
acs system-configcommand.You can also check the bootstrap logs (
/logs/k8/install.log) for additional details.Typically, you can resolve any issues caused by misconfiguration by resetting the node using
acs reboot factory-resetand restarting the setup process. -
Discover Cluster Members— establishes connectivity between all master nodes in the cluster over the data network.Failures at this stage typically indicate misconfiguration of the data network IP address and the node being unable to reach its other 2 peers.
You can use
acs cluster masterscommand on any of the nodes to confirm the data IP you have provided.If the command does not return any information, use
ip addrto check the data interface’s (bond0br) IP adress and ensure that all nodes' IPs are reachable from the other nodes.$ ip addr [..] 6: bond0br: <BROADCAST,MULTICAST,UP,LOWER_UP> mtu 1500 qdisc noqueue state UP group default qlen 1000 link/ether 52:54:00:e1:93:06 brd ff:ff:ff:ff:ff:ff inet 10.195.255.165/24 brd 10.195.255.255 scope global bond0br valid_lft forever preferred_lft forever inet6 fe80::5054:ff:fee1:9306/64 scope link valid_lft forever preferred_lft forever [..] -
Setup Security— sets up Key Management Service (KMS) to enable data encryption between the nodes.If the
acs cluster masterscommand returnsca cert not founderror, it indicates a KMS issue. For additional details, check the/logs/kmslogs. -
Setup Initial ClusterandBootstrap Kubernetes Cluster— any failures during these stages typically indicate Kubernetes issues.You can get additional details from the logs in
/logs/k8on each node. -
After the Bootstrap stages are complete, the process advances go to the Cluster Bringup stages.
From
Initialize Systemto theWait for infra services to be readystages finalize the cluster creation by bringing up the remaining services.At this stage, you can use the
acs healthcommand on any of the nodes to see which service is not coming up correctly. Then check the specific service’s logs in/logs/k8_infra/<service>
Multi-Cluster Connectivity Issues
The following sections list common issues with multi-cluster connectivity.
For additional information about connecting multiple clusters together, see Multi-Cluster Connectivity.
Non-Primary Cluster Unable to Reconnect
If you clean reboot and redeploy a cluster that was part of a multi-cluster connectivity group, the group’s primary cluster will not be able to recognize it and will indicate that the cluster remains unreachable.
To resolve this issue, disconnect and reconnect the cluster:
-
Log in to the primary cluster.
-
Remove the cluster you re-deployed from the group.
This is described in Disconnecting Clusters.
-
Re-add the cluster to the group.
This is described in Connecting Multiple Clusters.
Non-Primary Cluster Redeployed with Older Version
If for any reason you redeploy one of the non-primary clusters in the group with a version of Nexus Dashboard that does not support this feature, the primary cluster will still be able to connect to that cluster, but will not be able to retrieve any information and the UI will remain blank.
To resolve this issue, remove that cluster from the group:
-
Log in to the primary cluster as a local
adminuser.If you log in with the remote user shared across all clusters, the UI page will remain blank.
-
Remove the cluster you re-deployed from the group.
This is described in Disconnecting Clusters.
-
Log out and log back in using the remote user you use to manage the multi-cluster connectivity and verify that UI loads correctly.
Generating Private Key, Creating CSR, and Obtaining CA-Signed Certificate
This section provides an example of how to generate a private key, creat a certificate signing request (CSR), and obtain a certificate signed by a Certificate Authority (CA) for use in your Nexus Dashboard cluster.
If you want to generate both a key and a self-signed certificate, skip this section and follow the steps described in Generating Private Key and Self-Signed Certificate instead.
The configuration steps required to add the keys and certificates in the Nexus Dashboard GUI are described in the Security chapter.
-
Generate private key.
You can generate the private key on any platform that has OpenSSL installed or you can SSH into one of your Nexus Dashboard nodes as the
rescue-userand perform these steps there.[rescue-user@localhost ~]$ openssl genrsa -out nd.key 2048 Generating RSA private key, 2048 bit long modulus ........................ ............. e is 65537 (0x10001) [rescue-user@localhost ~]$ ls nd.key -
Generate your CSR signed with the private key you generated in the first step.
-
Create the CSR configuration file (
csr.cfg) with the required information.An example configuration file is shown below:
[req] default_bits = 2048 distinguished_name = req_distinguished_name req_extensions = req_ext prompt = no [req_distinguished_name] countryName = US stateOrProvinceName = Texas localityName = Plano organizationName = CSS organizationalUnitName = DC commonName = nd.dc.css emailAddress = no-reply@mydomain.com [req_ext] subjectAltName = @alt_names [alt_names] DNS.1 = *.dc.css IP.1 = 10.0.0.96 IP.2 = 10.0.0.97 -
Generate your CSR.
[rescue-user@localhost ~]$ openssl req -new -key nd.key  -out nd.csr  -config csr.cfg
[rescue-user@localhost ~]$ ls
csr.cfg  nd.csr  nd.key
You can view the generated CSR using the following command:
[rescue-user@localhost ~]$ openssl req -in nd.csr -text -noout
-
-
Obtain a CA-signed certificate.
In production deployments, you will provide the CSR (
ca.csr) from the previous step to a public CA, such as IdenTrust or DigiCert, to obtain the CA-signed certificate (ca.crt). -
Verify the signed certificate.
The following command assumes you copied the CA-signed certificate (
ca.crt) into the same folder as the private key you generated.[rescue-user@localhost ~]$ openssl verify -verbose -CAfile ca.crt nd.crt nd.crt: OK -
Add the contents of the generated files in your Nexus Dashboard’s GUI.
Following the steps described in Security Configuration, where you will need to provide the contents of the following 3 files generated in the previous steps:
-
Private key (
nd.key) -
Certificate Authority’s (CA) public certificate (
ca.crt) -
CA-signed certificate (
nd.crt)
-
Generating Private Key and Self-Signed Certificate
This section provides an example of how to generate a private key and custom certificates should you want to use them in your Nexus Dashboard cluster.
If you want to use a CA-signed certificate, skip this section and follow the steps described in Creating CSR, and Obtaining CA-Signed Certificate.
The configuration steps required to add the keys and certificates in the Nexus Dashboard GUI are described in the Security chapter.
-
Generate private key.
You can generate the private key on any platform that has OpenSSL installed or you can SSH into one of your Nexus Dashboard nodes as the
rescue-userand perform these steps there.[rescue-user@localhost ~]$ openssl genrsa -out nd.key 2048 Generating RSA private key, 2048 bit long modulus ........................ ............. e is 65537 (0x10001) [rescue-user@localhost ~]$ ls nd.key -
Generate Certificate Authority (CA) key.
To generate a self-signed CA, for example for lab and testing purposes, run the following command:
[rescue-user@localhost ~]$ openssl genrsa -out ca.key 2048 Generating RSA private key, 2048 bit long modulus .................. ............. e is 65537 (0x10001) [rescue-user@localhost ~]$ ls ca.key nd.key -
Generate CSR for the CA.
[rescue-user@localhost ~]$ openssl req -new -key ca.key -subj "/CN=Self/C=US/O=Private/ST=Texas" -out ca.csr [rescue-user@localhost ~]$ ls ca.csr ca.key nd.keyYou can view the generated CSR using the following command:
[rescue-user@localhost ~]$ openssl req -in ca.csr -text -noout -
Create self-signed root certificate.
[rescue-user@localhost ~]$ openssl x509 -req -in ca.csr -signkey ca.key -CAcreateserial -out ca.crt -days 3650 Signature ok subject=/CN=Self/C=US/O=Private/ST=Texas Getting Private key [rescue-user@localhost ~]$ ls ca.crt ca.csr ca.key nd.keyYou can view the generated root certificate using the following command:
[rescue-user@localhost ~]$ openssl x509 -in ca.crt -text -noout -
Generate your CSR signed with the private key you generated in the first step.
-
Create the CSR configuration file (
csr.cfg) with the required information.An example configuration file is shown below:
[req] default_bits = 2048 distinguished_name = req_distinguished_name req_extensions = req_ext prompt = no [req_distinguished_name] countryName = US stateOrProvinceName = Texas localityName = Plano organizationName = CSS organizationalUnitName = DC commonName = nd.dc.css emailAddress = no-reply@mydomain.com [req_ext] subjectAltName = @alt_names [alt_names] DNS.1 = *.dc.css IP.1 = 10.0.0.96 IP.2 = 10.0.0.97 -
Generate your CSR.
[rescue-user@localhost ~]$ openssl req -new -key nd.key -out nd.csr -config csr.cfg [rescue-user@localhost ~]$ ls ca.crt ca.csr ca.key csr.cfg nd.csr nd.keyYou can view the generated CSR using the following command:
[rescue-user@localhost ~]$ openssl req -in nd.csr -text -noout
-
-
Self-sign the certificate you generated.
[rescue-user@localhost ~]$ openssl x509 -req -in nd.csr -CA ca.crt -CAkey ca.key -CAcreateserial -out nd.crt -days 3600 Signature ok subject=/C=US/ST=Texas/L=Plano/O=CSS/OU=DC/CN=nd.dc.css/emailAddress=no-reply@mydomain.com Getting CA Private Key [rescue-user@localhost ~]$ ls ca.crt ca.csr ca.key ca.srl csr.cfg nd.crt nd.csr nd.key -
Verify the signed certificate.
[rescue-user@localhost ~]$ openssl verify -verbose -CAfile ca.crt nd.crt nd.crt: OK -
Add the contents of the generated files in your Nexus Dashboard’s GUI.
Following the steps described in Security Configuration, where you will need to provide the contents of the following 3 files generated in the previous steps:
-
Private key (
nd.key) -
Certificate Authority’s (CA) public certificate (
ca.crt) -
CA-signed certificate (
nd.crt)
-
 Feedback