GUI Overview
After you have deployed the Nexus Dashboard cluster, you can perform all remaining actions using its GUI. To access Cisco Nexus Dashboard GUI, simply browse to any one of the nodes' management IP addresses:
https://<node-mgmt-ip>

Note ![]() Depending on the permissions of the user logged in to the Nexus Dashboard GUI, the UI will display only the objects and settings the user is allowed to access. The following sections describe all GUI elements as visible by an
Depending on the permissions of the user logged in to the Nexus Dashboard GUI, the UI will display only the objects and settings the user is allowed to access. The following sections describe all GUI elements as visible by an admin user. For more information on user configuration and permissions, see Users.
Navigation Bar and User Preferences
As you navigate through the Nexus Dashboard UI and any installed services, the top of the screen will always display the common navigation bar:
-
The Home button will return you to the One View page (described in the following section) from any page or service you are currently viewing.
-
The Feedback button allows you to send feedback and suggestions or report issues as you are using the software.
-
The Help menu provides access to the version information, new features in the current release, and the documentation for Nexus Dashboard as well as any services you have installed.
-
The user menu allows you to log out, change the password for the currently logged in user, and configure one or more user-specific preferences:
-
Show Welcome Screen On Login toggles whether the new features screen is shown every time the current user logs in.
-
Time Zone Preference allows you to specify the time zone for the currently logged in user allowing multiple users across different geographical locations to more conveniently view any time-specific information in the UI.
When set to
Automatic, your local browser time zone is used. This is the default and the same behavior as in previous releases of Nexus Dashboard.When set to
Manual, you can pick the geographic location from the map and the closest time zone will be set according to that.The time zone conversion is done in the UI only, the backend and the APIs continue to return timestamps in the format in which they are saved, which is typically UTC.
This release supports the global time zone configuration for Nexus Dashboard and Insights service only, other services may continue to use automatic or internally configured time zone settings. The time zone setting for the Nexus Dashboard Insights service is absolute. In other words, if you have multiple sites across different geographical regions, all source time zones are mapped to the configured time zone.
-
One View Page
The first page you will see when you log into your Nexus Dashboard cluster is the One View. This page provides information about the current Nexus Dashboard cluster’s status, sites, services, and resources usage:
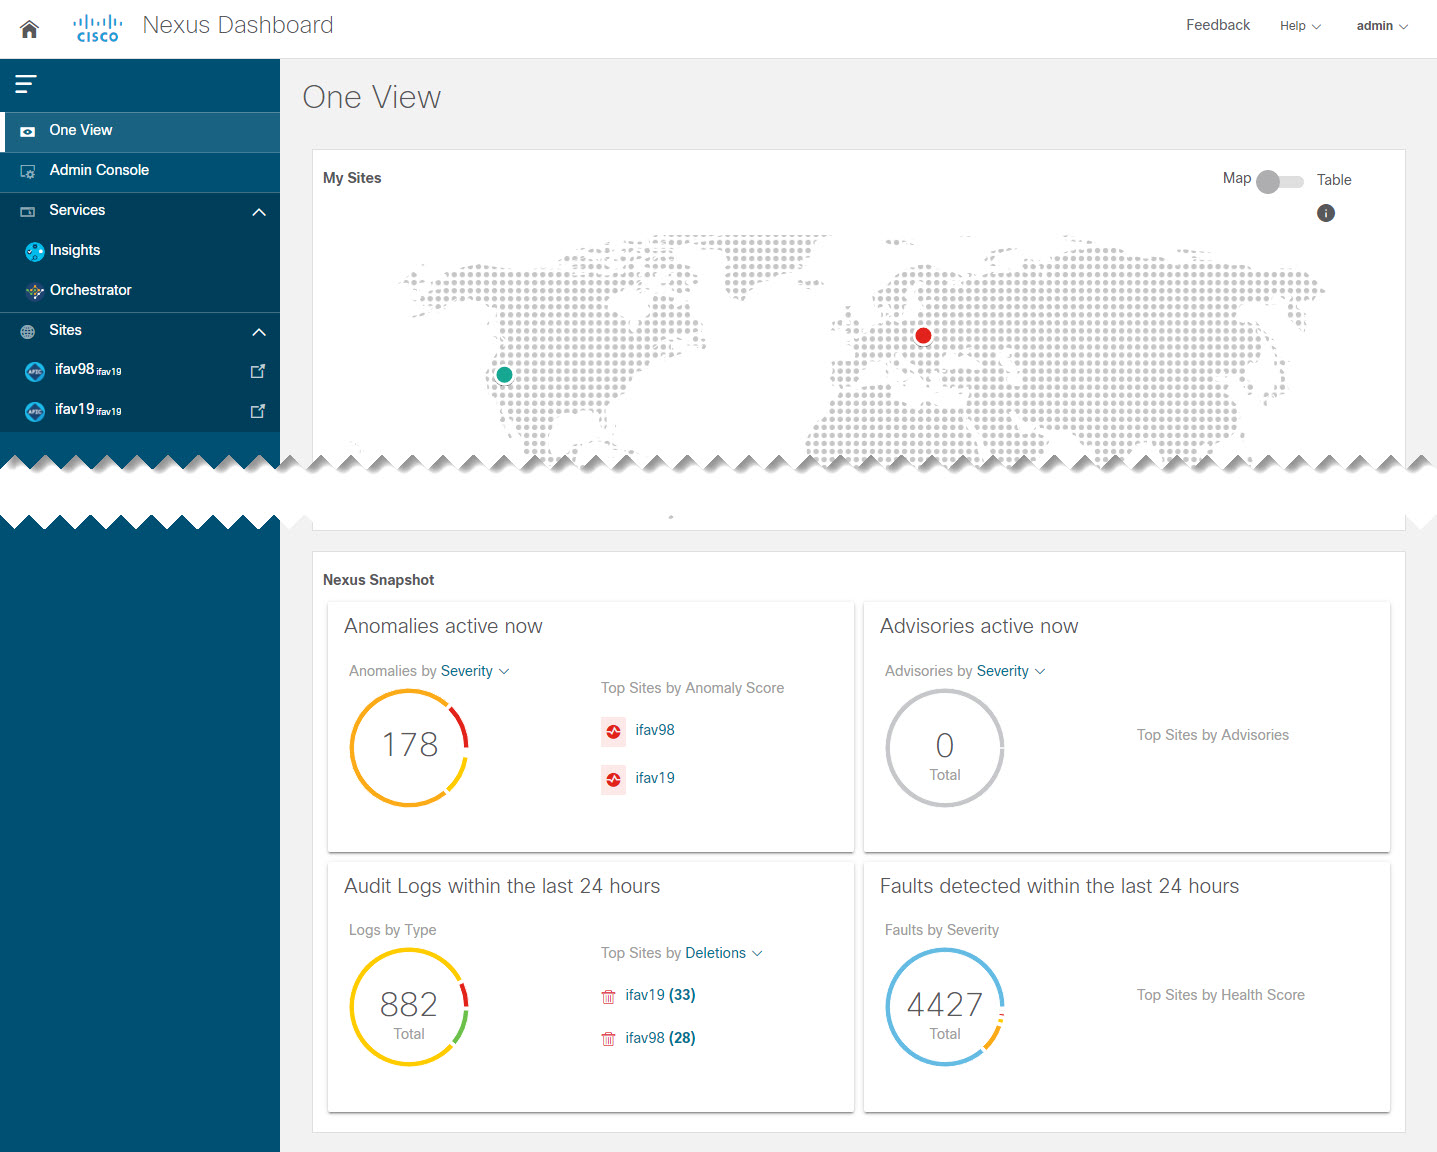
Here you can have a single place for status overview of the entire cluster (or all clusters in case of multi-cluster connectivity) for Dashboard Users. Note that the Nexus Snapshot information is available for Nexus Dashboard Insights service only.
You can always access the One View page by clicking the Home icon in the top left corner of the UI.
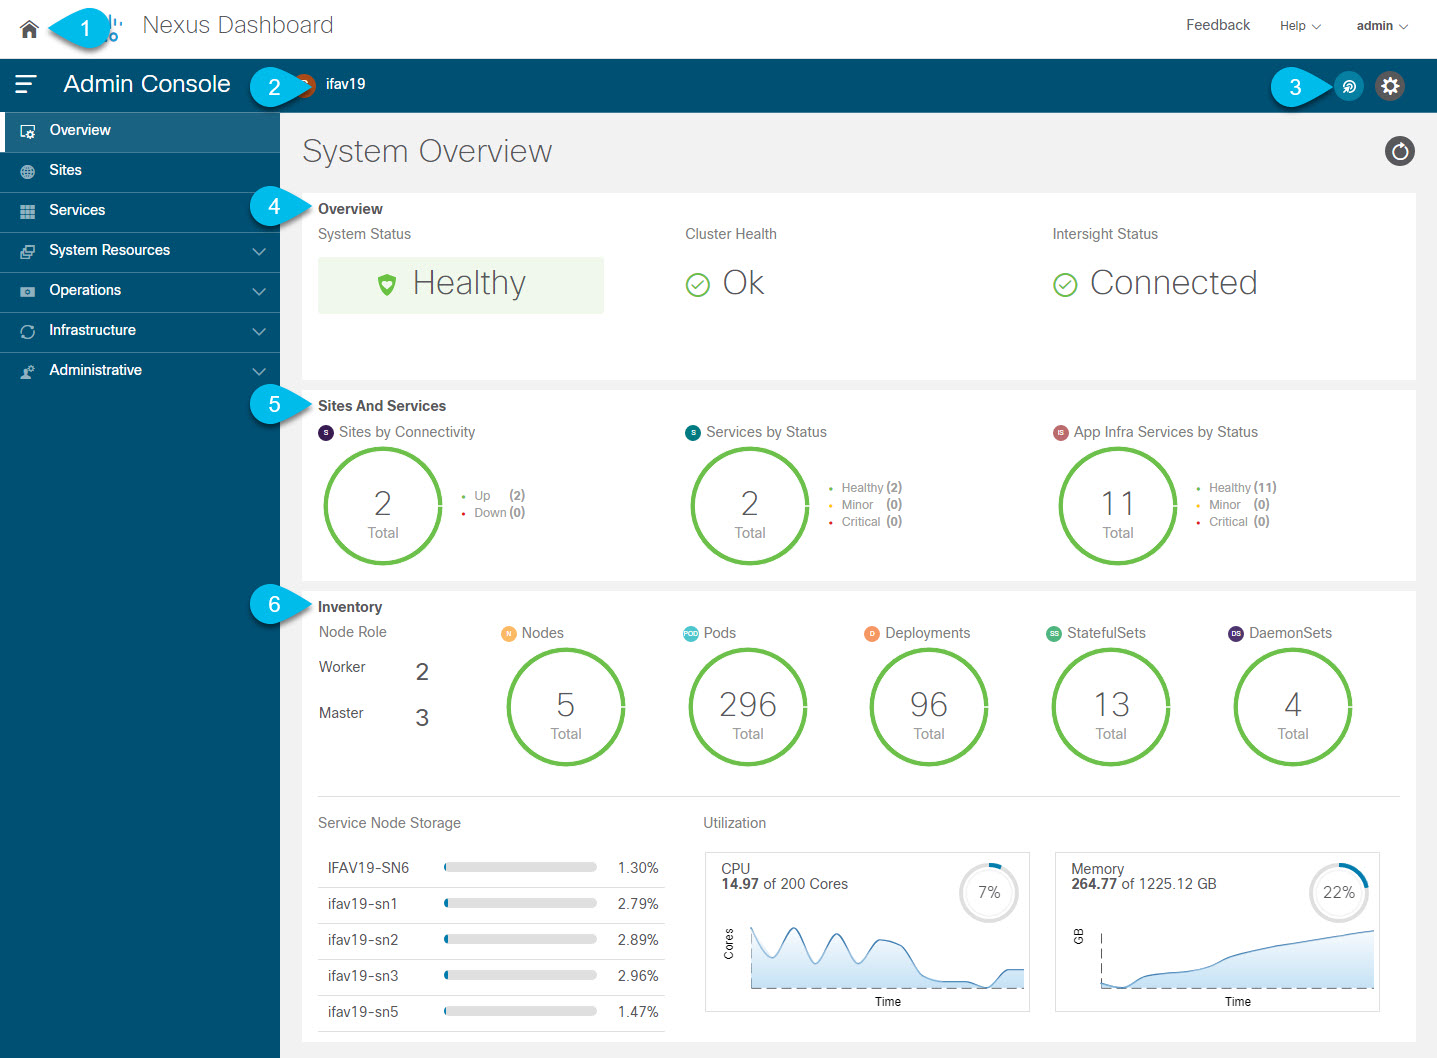
Admin Console Page
You can navigate to your Nexus Dashboard cluster’s Admin Console by clicking Admin Console in the One View page after you log in. The Overview page of the admin console provides information about the current Nexus Dashboard cluster’s status, sites, services, and resources usage.
-
The global Home icon provides a convenient way of returning to the Nexus Dashboard’s home screen that allows you to navigate between different components:
-
One View page (described above), which provides a Single Pane of Glass (SPOG) view into all your connected cluster, sites, and services.
In multi-cluster deployments, One View will show all available resources and services across all of your clusters. For more information, see Multi-Cluster Connectivity.
-
Admin Console (pictured above), where you can configure and administer your Nexus Dashboard cluster.
-
Services for one-click access to every service available in your cluster.
In multi-cluster deployments, Services will include all services across all of your clusters.
-
Sites for one-click access to the controller UI of any site onboarded to your cluster.
In multi-cluster deployments, Sites will include all sites across all of your clusters.
-
-
Current Cluster displays the name of the currently viewed cluster.
In multi-cluster deployments, you can click the name of the cluster to quickly switch to another connected cluster.
-
Intent icon allows you to access the most common tasks, such as adding sites or nodes, upgrading the cluster, creating users, and so on.
-
Overview tile displays System Status, Cluster Health, and Cisco Intersight Status.
You can click on the Cluster Health status to view specific details of any issues in your cluster.
-
Sites and Services tile displays the
Sitesby connectivity, as well asServicesandInfra Servicesby status.Connectivity indicates whether the sites are up (
Up) or down (Down).Status is displayed in number of services that are
healthy, haveminorfaults, or havecriticalfaults. -
Inventory tile provides details of the
nodes,pods,deployments, and other statistics about the currently selected cluster.
Note ![]() You can click different areas in the System Overview tab to open the corresponding GUI screens where you can see additional details or make configuration changes.
You can click different areas in the System Overview tab to open the corresponding GUI screens where you can see additional details or make configuration changes.
Sites Page
The Sites page in the left navigation pane allows you to onboard sites from a single location and then use those sites from any service deployed in your cluster.
Any site that is already onboarded is listed on this page, including the following:
-
Health Score — current health status of the site as reported by the site’s controller.
-
Name — the name of the site as you provided it during onboarding.
-
Connectivity Status — indicates whether the site’s connectivity is establish (
Up) or not (Down). -
Firmware Version — the version of the controller software currently running in the site.
-
Services Used — list of services currently using the specific site.
For additional information on onboarding sites, see Site Management.
Services Page
The Services page in the left navigation pane allows you to access and manage services in your Nexus Dashboard.
Any service that is already installed and enabled is listed under the Installed Services tab, while the App Store tab provides an easy way to deploy additional services directly from the Cisco’s Data Center App Center page.
For additional information on managing services, see Services Management.
System Resources Pages
The System Resources category in the left navigation pane displays the cluster resources, such as the nodes that make up you cluster and the Kubernetes API objects utilized by the cluster.
The category contains the following subcategories:
-
Nodes — provides information about all
master,worker, andstandbynodes in your cluster along with their networking configuration and CPU/Memory utilization. -
Pods — provides information about pods, which are a fundamental unit of compute.
A pod is a group of containers that are scheduled together and are generally static. When a service requires a change in how it is deployed, new pods are created with the new configuration and the old pods are destroyed instead of changing the configuration of the existing pods in place.
-
Namespaces — provides information about Kubernetes namespaces used to organize groups of other API objects.
Namespaces can be used to operate on all objects in the namespace at once or to restrict access to particular users or roles.
-
Services — provides information about services (or set of dynamically-changing pods and containers) running in the cluster.
Each service consists of multiple pods and containers, which may be created, destroyed, or changed during cluster scaling or recovery, but the service’s names provide a static way of accessing the specific service irrespective of its underlying configuration.
-
Deployments, StatefulSets and DaemonSets provide the service developers with ways to describe how and where to deploy sets of Pods.
-
Deployments — Deployments are the most general of these objects and simply define a set of pods with the ability to set constraints about how many copies of the pod are deployed and on what type of node.
-
DaemonSets — define a Pod that runs on every host in the Kubernetes cluster and is automatically created whenever a Node is added to the cluster.
-
StatefulSets — define Pods that need to be run on a predictable host with a specific storage volume. If these pods go down, they are recreated in the same place with the same persistent identifier, so that they can use the same storage volume as their previous incarnation.
-
Operations Pages
The Operations category in the left navigation pane displays the actions that can be performed on Nexus Dashboard.
The category contains the following subcategories:
-
Firmware Management — Firmware Management is used to perform cluster (firmware) upgrade or downgrade.
-
Tech Support — An administrator can perform technical support collections.
-
Audit Logs — Audit Logs are user triggered configuration changes.
-
Backup and Restore — Backup and Restore displays the backed up and restoredconfiguration.
Infrastructure Pages
The Infrastructure category in the left navigation pane allows you to management the Nexus Dashboard cluster, Cisco Intersight connector, and application Infra services.
-
Cluster Configuration — provides cluster details (such as name, app subnet, and service subnet), allows you to configure cluster-wide settings (such as DNS and NTP servers, persistent IP addresses, and routes), and displays any current issues in the cluster.
-
Resource Utilization — provides real-time information about the resource utilization of your Nexus Dashboard cluster.
-
Intersight — provides access to Cisco Intersight device connector configuration.
The Cisco NI service depends on the Intersight Device Connector for service to be configured and available on the service node.
-
App Infra Services — provides information about the infra services running on your Nexus Dashboard and allows you to restart individual microservices if needed.
Administrative Pages
The Administrative category in the left navigation pane allows you to manage authentication and users.
-
Authentication — allows you to configure remote authentication domains as described in Remote Authentication.
-
Security — allows you to view and edit the security configurations, such keys and certificates.
-
Users — allows you to create and update local Nexus Dashboard users as described in Users or view the users configured on any remote authentication servers you added to the Nexus Dashboard.
 Feedback