Overview of the SAN Analytics Solution
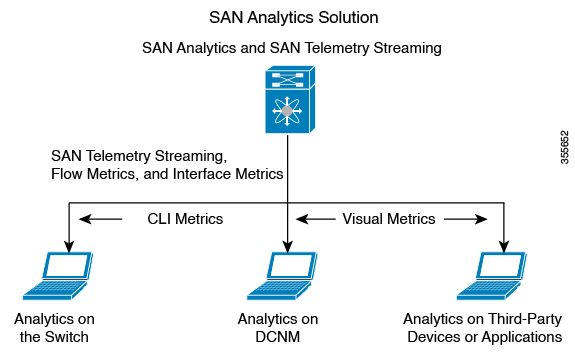
The SAN Analytics solution provides insights into your fabric by allowing you to monitor, analyze, identify, and troubleshoot performance issues. This solution consists of the following components:
-
SAN Analytics—The SAN Analytics feature collects performance and error metrics by inspecting data frames on switch ports. It also allows on-switch display of these metrics through the SAN Analytics CLI.
-
SAN Telemetry Streaming—The SAN Telemetry Streaming feature is used to stream the data of interest to one or more receivers such as Cisco Data Center Network Manager (DCNM) for analysis.
Currently, there are two types of data that are supported for streaming:
-
Flow Metrics—Small Computer System Interface (SCSI) and Non-Volatile Memory Express (NVMe) flow metrics that comprise of key components of Fibre Channel exchanges.
-
Interface Metrics—Statistical information of interfaces.
-
-
Cisco DCNM SAN Insights—The Cisco DCNM SAN Insights feature represents the data of interest in a visual manner for analysis. For more information, see the Cisco DCNM SAN Management User Guide.
-
Third-Party Devices or Applications—The data of interest can also be streamed and analyzed visually on supported third-party devices (such as VirtualWisdom from Virtual Instruments) or applications.
The following figure depicts the workflow of the SAN Analytics solution:

 Feedback