Configuring SAN Telemetry Streaming

This chapter provides information about the SAN Telemetry Streaming feature and how to configure it:

Feature History for Configuring SAN Telemetry Streaming

Table 1. Feature History for Configuring SAN Telemetry Streaming

Feature Name

Release

Feature Information

Transceiver parameters streaming

9.2(2)

Added support for FC transceiver parameters streaming.

SAN Telemetry Streaming

8.4(1)

Updated the fabric_telemetry.proto file with NVMe flow metrics.

SAN Telemetry Streaming

8.3(2)

Supports compact Google Protocol Buffers (GPB) encoding.

SAN Telemetry Streaming

8.3(1)

Provides capability to stream analytics and interface statistics to receivers such as Cisco DCNM.

The following commands have been introduced:

  • certificate certificate_path host_name

  • destination-group id

  • destination-profile

  • dst-grp id

  • feature telemetry

  • {ip | ipv6} address address port number [protocol procedural-protocol encoding encoding-protocol]

  • path sensor_path

  • sensor-group id

  • show run telemetry

  • show telemetry {control {database [destination-groups | destinations | sensor-groups | sensor-paths | subscriptions] | stats} | data collector {brief | details} | pipeline stats | transport session_id [errors | stats]}

  • snsr-grp id sample-interval interval

  • subscription id

  • telemetry

  • use-retry size buffer_size

Interface Statistics

8.3(1)

Allows you to stream traffic and error counters data from Fibre Channel interfaces.

SAN Telemetry Streaming Overview

Cisco NX-OS provides several mechanisms such as Simple Network Management Protocol (SNMP), CLI, and syslog to collect data from a network. The SAN Telemetry Streaming feature is used to stream the data of interest to one or more upstream receivers such as Cisco DCNM for analysis. The pull model that is used in SAN analytics is used to send data from the server only when clients request for it.

In general, data is collected from switches using the push (fetch) model streams data to the client continuously. SAN Telemetry Streaming enables the push model, which provides near-real-time access to monitor data.

Data collected from sensors can be streamed to Cisco DCNM or third-party devices or apps, by adding a sensor path to a sensor group in the SAN Telemetry Streaming configuration. For more information, see Configuring SAN Telemetry Streaming.


Note


In Cisco MDS NX-OS Release 8.3(1), the version number added in the telemetry payload is 1.0.0.1.


Interface Statistics Streaming

Interface statistics streaming allows you to stream traffic and error counters data from Fibre Channel interfaces. Collection of traffic and error counters are enabled by default and cannot be configured or disabled. There are more than 65 interface statistics counters available. For information on the modules that support interface statistics, see Hardware Requirements for SAN Analytics.

For information on the list of supported interface counters, see Interface Counters.

Transceiver Parameters Streaming

Transceiver parameters streaming periodically collects information about transceivers and streams it to receivers. The information is comprised of both operational Diagnostic Optical Monitoring (DOM) data as well as static data about the vendor name, model number, and serial number of each monitored transceiver, along with the switch timestamp. This allows centralized and enhanced transceiver monitoring over the local NX-OS on-switch transceiver parameter threshold monitoring.

Analyzing transceiver DOM operating parameters over time can be used to identify transceiver performance issues. For example, correlating interface errors such as bit errors or frame CRCs with transceiver receive power level could lead to identification of intermittent cable issues which might otherwise be difficult to identify. The timestamp can be used for time sequencing and correlation with other data or logs.

Transceiver parameters streaming sensors may be defined to collect either local switch transceiver data only, or both local and peer transceiver data.


Note


Monitoring peer transceiver data requires that the peer device supports inband FC Read Diagnostic Parameters (RDP) ELS requests.


This feature is comprised of the following components:

  • Collection on the switch: The transceiver parameters listed in Table 1 are periodically collected. These are monitored locally by NX-OS on the switch, independently of transceiver parameter streaming.

  • Streaming to receivers: Telemetry configuration commands are used to specify the range of interfaces to stream and the streaming interval for the transceiver parameters. Streaming starts from 10 minutes after the transceiver is operational to avoid stale data being streamed. The receiver may then monitor and analyze the data.


Note


Transceiver parameters streaming is supported only on Fibre Channel ports.


Table 1 displays the list of transceiver parameters that are streamed:

Table 2. Streamed Transceiver Parameters

Transceiver Parameters

Unit

Temperature

Celsius (C)

Voltage

Volts (V)

Current

Milliampere (mA)

Tx Power

Decibel milliwatt (dBm)

Rx Power

Decibel milliwatt (dBm)

Vendor Name

Model Number

Serial Number

Switch Timestamp

Guidelines and Restrictions for SAN Telemetry Streaming

  • If the feature telemetry command is enabled, ensure that you disable this feature using the no feature telemetry command before downgrading to a release earlier than Cisco MDS NX-OS Release 8.3(1).

  • Before Cisco MDS NX-OS Release 8.3(2), SAN Telemetry Streaming only supported Google Protocol Buffers (GPB) encoding over Google remote procedure call (gRPC) transport. From Cisco MDS NX-OS Release 8.3(2), compact GPB encoding support was added. Ensure that all the destinations under a destination group and all the destination groups under a subscription are of the same encoding type.


    Note


    GPB key value encoding is referred to as just GPB. GPB is used instead of GPB key value in configuration and show commands.


  • If you are using Cisco DCNM SAN Insights, configure the SAN Telemetry Streaming feature in Cisco DCNM SAN Insights; there is no need to configure this feature on the switch. For more information, see the "Configuring SAN Insights" section in the Cisco DCNM SAN Management Configuration Guide.

  • We recommend that the streaming-sample interval (snsr-grp id sample-interval interval ), port-sampling interval (analytics port-sampling module number size number interval seconds ), and push-query interval (analytics query “query_string” name query_name type periodic [interval seconds] [clear] [differential] ) be configured with the same value. We also recommend that you change or configure the push-query interval first, then the port-sampling interval, and finally, the streaming-sample interval.

  • The smallest streaming sample interval that is supported is 30 seconds. We recommend that you set the push query interval, port sampling interval, and streaming sample interval to be equal to or more than the minimum recommended value of 30 seconds and to be the same value. Configuring intervals below the minimum value may result in undesirable system behavior.

  • Streaming of interface statistics is not supported on Cisco MDS 9132T switches that operate in the Cisco NPV mode.

  • Up to two management receivers (destinations) are supported. However, we recommend that you configure only one receiver for optimal performance.

  • If you are configuring multiple receivers (Cisco DCNM or third-party devices or apps), we recommend that you configure them under the same destination group. If there are multiple Cisco DCNM receivers, you must manually configure the receivers in the same destination group.

  • When an SAN Telemetry Streaming receiver stops functioning, other receivers experience interruption in data flow. Restart the failed receiver. For information on how to restart the receiver, see your receiver documentation.

    Telemetry data streaming is uniform if the receiver is running without any delays and the management port is free from packet drops. If there are gRPC transport delays because of slowness in the receiver or network, there is a possibility of data collection getting interrupted, and the data getting dropped on the switch because of system memory limitations. The occurrence of this issue depends on the number of ITLs being streamed out and the delay in or slowness of the network. Use the show telemetry control database sensor-groups , show telemetry transport session_id errors , and any telemetry syslog command to check the drops at a sensor group level and transport status for transport delays, if any. For more information, see Troubleshooting SAN Telemetry Streaming.


    Note


    If the slowness in the network is not fixed, or if there are continuous network drops that are slowing the transmission or streaming of analytics data for a duration of 25 hours or more, the transport session is disabled permanently and a syslog message is generated. After you fix the issue, the streaming can be resumed by removing and configuring the IP address under the corresponding destination group. For configuration details, see Configuring SAN Telemetry Streaming.


  • SAN Telemetry and Streaming is supported on MDS 9124V and MDS 9148V from Release 9.4(1). To downgrade to an earlier release, you must disable SAN telemetry before the downgrade.

  • In Releases before 9.4(1), read and write IO bandwidth metrics for line rate traffic of 64 Gbps was truncated. From Release 9.4(1), MDS NX-OS accurately reports bandwidth metrics of upto 64 Gbps line rate traffic.

  • For telemetry, the original bandwidth fields are renamed to *_deprecated and the new bandwidth fields are renamed to the original names. Therefore, the bandwidth fields that are streamed are:

    • read_io_bandwidth

    • peak_read_io_bandwidth

    • write_io_bandwidth

    • peak_write_io_bandwidth

    • read_io_bandwidth_deprecated

    • peak_read_io_bandwidth_deprecated

    • write_io_bandwidth_deprecated

    • peak_write_io_bandwidth_deprecated

gRPC Error Behavior

A switch client disables connection to a gRPC receiver after the gRPC receiver sends 20 errors, one of the gRPC errors or both, to the switch. If the response from the receiver takes more than 30 seconds, and if this condition persists for 25 hours continuously, the respective transport session is marked as disabled. You must unconfigure and reconfigure the destination IP address under the destination group to enable the gRPC receiver. Use the show telemetry transport session_id errors command to view the errors generated. For configuration details, see Configuring SAN Telemetry Streaming and for errors, see Troubleshooting SAN Telemetry Streaming.

The following are gRPC errors:

  • The gRPC client sends the wrong certificate for secure connections.

  • The gRPC receiver takes too long to handle client messages and incurs a timeout. Avoid timeouts by processing messages using a separate message-processing thread.

SAN Telemetry Streaming Encoding

The following encoding are used in SAN Telemetry Streaming:

  • GPB Key Value—Before Cisco MDS NX-OS Release 8.3(2), GPB key value was the only supported encoding. The key that is used in this encoding is a string and is self-describing. However, the data size that is used in this encoding is larger than the compact GPB encoding. In this type of encoding, the data can be easily analyzed without any intermediate process. For more information on the key fields, see Flow Metrics.

  • Compact GPB—From Cisco MDS NX-OS Release 8.3(2), compact GPB encoding support was added. The key that is used in this encoding is an integer. Hence, the data size that is used in this encoding is smaller than the GPB-KV encoding. However, a decoding table is required to decode integers to their respective metrics. The decoding table for compact GPB is a .proto file. With compact GPB, you must use the telemetry_bis.proto file for all path analytics: query_name queries and upload it to your collector for parsing the data stream.


Note


For interface statistics streaming (path show_stats), only GPB-KV encoding is supported.


The following example displays a snippet of the telemetry fields that are used in compact GPB .proto file:


message Telemetry {
...
repeated TelemetryField data_gpbkv = 11;
TelemetryGPBTable data_gpb = 12;
...}
message TelemetryGPBTable {
repeated TelemetryRowGPB row = 1;
}
message TelemetryRowGPB {
uint64 timestamp = 1;
bytes keys = 10;
bytes content = 11;
}

In this example, the fields that are used in the .proto file of compact GPB are included under the data_gpb field. The key field in the TelemetryRowGPB message structure carries the .proto filename (fabric_telemetry) and the content field carries the fields from the .proto file.

For information on the .proto files that are used in compact GPB, see SAN Telemetry Streaming Proto Files — Prior to Release 9.4(1).

Configuring SAN Telemetry Streaming


Note


If you are using Cisco NDFC or DCNM SAN Insights, you can configure the SAN Telemetry Streaming feature in Cisco DCNM SAN Insights; there is no need to configure this feature on the switch. There is no need to configure this feature on the switch as NDFC (or DCNM) does all the necessary switch configuration. For more information, see the "Configuring SAN Insights" section in the Cisco DCNM SAN Management Configuration Guide.


The following images display the different ways of configuring sensor and destination groups:

Figure 1. Sensor Group Mapped to the Same Destination Group
Figure 2. Sensor Group Mapped to a Different Destination Group
Figure 3. One Sensor Group Mapped to Multiple Destination Groups
Figure 4. Multiple Sensor Groups Mapped to a Single Destination Group

To configure SAN Telemetry Streaming, perform the following procedure.

Before you begin

  • Ensure that your switch is running Cisco MDS NX-OS Release 8.3(1) or a later release.

  • Enable the SAN Analytics feature. See Enabling SAN Analytics.

  • Ensure that the timezone on the telemetry source switch is set correctly with the clock configuration command. Otherwise, SAN telemetry receivers will be unable to correlate the received analytics timestamps. For more information about this command, see the Cisco MDS 9000 Series Command Reference.

Procedure


Step 1

Enter global configuration mode:

switch# configure terminal

Step 2

Enable the SAN Telemetry Streaming feature:

switch(config)# feature telemetry

Step 3

Enter SAN Telemetry Streaming configuration mode:

switch(config)# telemetry

Step 4

(Optional) Use an existing SSL or TLS certificate:

switch(config-telemetry)# certificate certificate_path host_name

Note


On Cisco MDS 9700 Series switches, ensure that the client certificate is available on both active and standby supervisors for secure telemetry configuration. Otherwise, the SAN Telemetry Streaming will fail after an upgrade or downgrade. Use the copy bootflash:<client certificate file> bootflash://sup-standby/<client certificate file> command to copy the client certificate from an active supervisor to the standby supervisor.

Step 5

(Optional) Enter destination profile configuration mode and specify the send retry details for the gRPC transport protocol:

  1. switch(config-telemetry)# destination-profile

  2. switch(conf-tm-dest-profile)# use-retry size buffer_size

A destination profile can configure parameters, for example, the transport retry buffer size specific to all the destinations.

Note


Buffer size is in MB and ranges from 10 to 1500.

Step 6

Create a sensor group with an ID and enter sensor group configuration mode:

switch(conf-tm-dest-profile)# sensor-group id

A sensor group is a collection of one or more sensor paths.

Currently, only numeric sensor group ID values are supported. The sensor group defines nodes that are monitored for telemetry reporting.

Step 7

Add a sensor path to the sensor group:

switch(conf-tm-sensor)# path sensor_path

A sensor_path is where the specific interface statistics and the push queries that are streamed are specified. Multiple sensor paths can be configured in a sensor group. Valid vaues are as follows:

  • path analytics:query_name : This telemetry sensor path is for analytics. The query name is a configured analytics query or a push query.

  • path show_stats_fc slot/port[-end_port] : This telemetry sensor path is for interface statistics streaming. slot/port[-end_port] specifies a single port or a range of ports on the slot (module) for which the interface statistics are streamed.

  • interface range : This telemetry sensor path is for transceiver parameters streaming. Interface range is the range of fc interface that have the transceiver parameters streamed.

Note


The syntax of the sensor path is not validated during configuration. Incorrect sensor path may result in data-streaming failure.

Step 8

Create a destination group and enter destination group configuration mode:

switch(conf-tm-sensor)# destination-group id

Currently, destination group ID supports only numeric ID values.

Note


A destination group is a collection of one or more destinations.

Step 9

Create a destination profile for the outgoing data:

switch(conf-tm-dest)# {ip | ipv6} address address port number [protocol procedural-protocol encoding encoding-protocol]

Note


As of Cisco MDS NX-OS Release 8.3(2), gRPC is the only supported transport protocol; GPB and compact GPB are the only supported encoding.

When the destination group is linked to a subscription node, telemetry data is sent to the IP address and port that are specified in the destination profile.

Step 10

Create a subscription node with an ID and enter subscription configuration mode:

switch(conf-tm-dest)# subscription id

A subscription maps a sensor group to a destination group.

Currently, subscription ID supports only numeric ID values.

Step 11

Link the sensor group with an ID to the subscription node and set the data streaming sample interval in milliseconds:

switch(conf-tm-sub)# snsr-grp id sample-interval interval

Note


The minimum streaming sample interval that is recommended is 30000.

Currently, sensor group ID supports only numeric ID values. Specify the streaming sample interval value; the value must be in milliseconds. The minimum streaming sample interval that is supported is 30000 milliseconds. An interval value that is greater than the minimum value creates a frequency-based subscription where the telemetry data is sent periodically at the specified interval.

Step 12

Link the destination group with an ID to this subscription:

switch(conf-tm-sub)# dst-grp id

Currently, destination group ID supports only numeric ID values.


Examples: Configuring SAN Telemetry Streaming

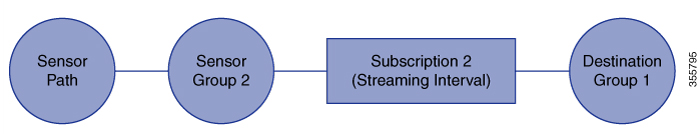
This example displays how to create a subscription that streams data from Fibre Channel interface 3/1 and 4/1 every 30 seconds to IP 1.2.3.4 port 50003 and IP 1:1::1:1 port 50009, and encrypts the stream using GPB encoding that is verified using test.pem:


switch# configure terminal
switch(config)# telemetry
switch(config-telemetry)# certificate /bootflash/test.pem foo.test.google.fr

switch(conf-tm-telemetry)# destination-group 100
switch(conf-tm-dest)# ip address 1.2.3.4 port 50003 protocol gRPC encoding GPB

switch(conf-tm-dest)# destination-group 1
switch(conf-tm-dest)# ipv6 address 1:1::1:1 port 50009 protocol gRPC encoding GPB-compact

switch(config-dest)# sensor-group 100
switch(conf-tm-sensor)# path show_stats_fc3/1
switch(conf-tm-sensor)# subscription 100
switch(conf-tm-sub)# snsr-grp 100 sample-interval 30000
switch(conf-tm-sub)# dst-grp 100

switch(config-dest)# sensor-group 1
switch(conf-tm-sensor)# path show_stats_fc4/1
switch(conf-tm-sensor)# subscription 1
switch(conf-tm-sub)# snsr-grp 1 sample-interval 30000
switch(conf-tm-sub)# dst-grp 1

This example displays how to create a periodic collection of show command data every 30 seconds and sends it to receivers 1.2.3.4 and 1.1::1.1:


switch# configure terminal
switch(config)# telemetry

switch(config-telemetry)# destination-group 100
switch(conf-tm-dest)# ip address 1.2.3.4 port 60001 protocol gRPC encoding GPB

switch(conf-tm-sensor)# destination-group 1
switch(conf-tm-dest)# ipv6 address 1:1::1:1 port 60009 protocol gRPC encoding GPB-compact

switch(config-dest)# sensor-group 100
switch(conf-tm-sensor)# subscription 100
switch(conf-tm-sub)# snsr-grp 100 sample-interval 30000
switch(conf-tm-sub)# dst-grp 100

switch(conf-tm-dest)# sensor-group 1
switch(conf-tm-sensor)# subscription 1
switch(conf-tm-dest)# snsr-grp 1 sample-interval 30000
switch(conf-tm-sub)# dst-grp 1

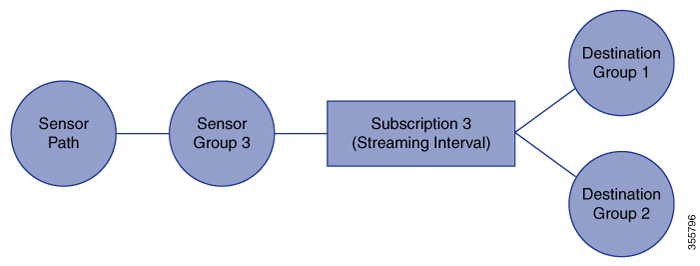
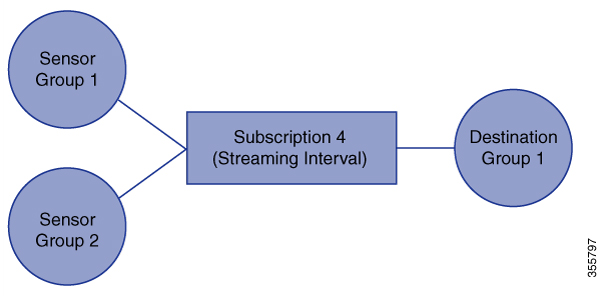
This example displays that a sensor group can contain multiple paths, a destination group can contain multiple destination profiles, and a subscription can be linked to multiple sensor groups and destination groups:


switch# configure terminal
switch(config)# telemetry

switch(config-telemetry)# sensor-group 100
switch(conf-tm-sensor)# path analytics:init
switch(conf-tm-sensor)# path analytics:initit

switch(config-telemetry)# sensor-group 200
switch(conf-tm-sensor)# path analytics:inititl

switch(conf-tm-sensor)# destination-group 100
switch(conf-tm-dest)# ip address 1.2.3.4 port 50004
switch(conf-tm-dest)# ipv6 address 5:6::7:8 port 50005

switch(conf-tm-dest)# destination-group 200
switch(conf-tm-dest)# ip address 5.6.7.8 port 50001

switch(conf-tm-dest)# subscription 600
switch(conf-tm-sub)# snsr-grp 100 sample-interval 30000
switch(conf-tm-sub)# snsr-grp 200 sample-interval 30000
switch(conf-tm-sub)# dst-grp 100
switch(conf-tm-sub)# dst-grp 200

switch(conf-tm-dest)# subscription 900
switch(conf-tm-sub)# snsr-grp 200 sample-interval 30000
switch(conf-tm-sub)# dst-grp 100


Note


The sensor_path is the location where the specific interface statistics and the push queries that are streamed are specified. Multiple sensor paths can be configured in a sensor group. The sensor path for telemetry streaming is path analytics: query_name , and for interface statistics streaming it is path show_stats_fc slot/port . The query names init, initit, and inititl that are specified in the sensor paths are configured in the SAN Analytics feature. For more information, see Configuring a Push Query.


This example shows a sample configuration of transceiver streaming.


switch# configure terminal
switch(config)# telemetry

switch(config-telemetry)# sensor-group 200
switch(conf-tm-sensor)# path transceiver:fc1/1
switch(conf-tm-sensor)# path transceiver:fc13/1-48

switch(conf-tm-sensor)# show telemetry data collector details
--------------------------------------------------------------------------------
Row ID         Successful     Failed         Skipped        Sensor Path(GroupId)
--------------------------------------------------------------------------------
1              398            14             0              show_stats_fc3/1-48(100)
2              30488          0              1              analytics:dcnmtgtITL(2)
3              395            0              0              show_stats_fc5/1-48(100)
4              0              0              0              transceiver:fc1/1(200) 
5              0              0              0              transceiver:fc13/1-48(200) 
6              0              0              0              analytics:dcnmtgtITN(1)

This example shows a sample configuration and how to verify an SAN Telemetry Streaming configuration. You can also check the show telemetry data collector details and show telemetry transport session_id stats command outputs for verifying the SAN Telemetry Streaming configuration. For more information, see Displaying SAN Telemetry Streaming Configuration and Statistics.


switch# configure terminal
switch(config)# telemetry

switch(config-telemetry)# destination-group 100
switch(conf-tm-dest)# ip address 1.2.3.4 port 50003 protocol gRPC encoding GPB
switch(conf-tm-dest)# ip address 1.2.3.4 port 50004 protocol gRPC encoding GPB

switch(config-telemetry)# destination-group 1
switch(conf-tm-dest)# ipv6 address 1:1::1:1 port 50008 protocol gRPC encoding GPB-compact
switch(conf-tm-dest)# ipv6 address 1:2::3:4 port 50009 protocol gRPC encoding GPB-compact

switch(conf-tm-dest)# end

switch# show running-config telemetry
!Command: show running-config telemetry
!Running configuration last done at: Thu Jun 14 08:14:24 2018
!Time: Thu Jun 14 08:14:40 2018
version 8.3(1)
feature telemetry
telemetry
 destination-group 1
  ipv6 address 1:2::3:4 port 50008 protocol gRPC encoding GPB-compact
  ipv6 address 1:1::1:1 port 50009 protocol gRPC encoding GPB-compact
 destination-group 100
  ip address 1.2.3.4 port 50003 protocol gRPC encoding GPB
  ip address 1.2.3.4 port 50004 protocol gRPC encoding GPB


Note


NPU load is based on all ITLs, including the count of active and inactive ITLs. Hence, we recommend that you clear or purge queries before checking the NPU load.


Displaying SAN Telemetry Streaming Configuration and Statistics

Use the following Cisco NX-OS CLI show commands to display SAN Telemetry Streaming configuration, statistics, errors, and session information:

This example displays the internal databases that are reflected in the SAN Telemetry Streaming configuration:

switch# show telemetry control database
Subscription Database size = 1
--------------------------------------------------------------------------------
Subscription ID      Data Collector Type 
--------------------------------------------------------------------------------
100                  SDB

Sensor Group Database size = 1
--------------------------------------------------------------------------------------------
Row ID  Sensor Group ID Sensor Group type Sampling interval(ms) Linked subscriptions SubID 
--------------------------------------------------------------------------------------------
1       100              Timer   /SDB       30000     /Running      1                 100   
Collection Time in ms (Cur/Min/Max): 53/9/81
Encoding Time in ms (Cur/Min/Max): 21/6/33
Transport Time in ms (Cur/Min/Max): 10470/1349/11036
Streaming Time in ms (Cur/Min/Max): 10546/9/11112

Collection Statistics:
  collection_id_dropped      = 0
  last_collection_id_dropped = 0
  drop_count                 = 0


Sensor Path Database size = 4
------------------------------------------------------------------------------------------
Row ID  Subscribed Linked  Sec    Retrieve  Path                   Query:  Filter
                   Groups  Groups level     (GroupId):
------------------------------------------------------------------------------------------
1       No         1       0      Self      analytics:inititl(100): NA :    NA
GPB Encoded Data size in bytes (Cur/Min/Max): 162310/162014/162320
JSON Encoded Data size in bytes (Cur/Min/Max): 0/0/0

2       No         1       0       Self      show_stats_fc1/3(100): NA :    NA
GPB Encoded Data size in bytes (Cur/Min/Max): 2390/2390/2390
JSON Encoded Data size in bytes (Cur/Min/Max): 0/0/0

3       No         1       0       Self      analytics:initit(100): NA :    NA
GPB Encoded Data size in bytes (Cur/Min/Max): 158070/157444/158082
JSON Encoded Data size in bytes (Cur/Min/Max): 0/0/0

4       No         1       0       Self      analytics:init(100):   NA :    NA
GPB Encoded Data size in bytes (Cur/Min/Max): 159200/158905/159212
JSON Encoded Data size in bytes (Cur/Min/Max): 0/0/0


Destination Group Database size = 1
> use-vrf : default
--------------------------------------------------------------------------------
Destination Group ID  Refcount  
--------------------------------------------------------------------------------
100                   1         

Destination Database size = 3
--------------------------------------------------------------------------------
Dst IP Addr     Dst Port   Encoding   Transport  Count     
--------------------------------------------------------------------------------
10.30.217.80    50009      GPB        gRPC       1         
2001:420:301:2005:3::11 
                60003      GPB        gRPC       1         
2001:420:54ff:a4::230:e5 
                50013      GPB        gRPC       1         

switch(conf-tm-dest)# show telemetry control database sensor-groups 
Sensor Group Database size = 1
-------------------------------------------------------------------------------------------
Row ID Sensor Group ID Sensor Group type  Sampling interval(ms) Linked subscriptions SubID 
--------------------------------------------------------------------------------------------
1      100              Timer   /SDB       30000     /Running     1                   100   
Collection Time in ms (Cur/Min/Max): 53/9/81
Encoding Time in ms (Cur/Min/Max): 21/21/33
Transport Time in ms (Cur/Min/Max): 10304/461/15643
Streaming Time in ms (Cur/Min/Max): 10380/9/15720

Collection Statistics:
  collection_id_dropped      = 0
  last_collection_id_dropped = 0
  drop_count                 = 0


Note


In the command output, SDB is a type of SAN data collector. Telemetry also supports DME, NX-API, and YANG data sources on other supported platforms.


This example displays the statistics of internal databases in the SAN Telemetry Streaming configuration:

switch# show telemetry control stats
show telemetry control stats entered

-------------------------------------------------------------------------------
Error Description                                            Error Count
-------------------------------------------------------------------------------
Chunk allocation failures                                    0
Sensor path Database chunk creation failures                 0
Sensor Group Database chunk creation failures                0
Destination Database chunk creation failures                 0
Destination Group Database chunk creation failures           0
Subscription Database chunk creation failures                0
Sensor path Database creation failures                       0
Sensor Group Database creation failures                      0
Destination Database creation failures                       0
Destination Group Database creation failures                 0
Subscription Database creation failures                      0
Sensor path Database insert failures                         0
Sensor Group Database insert failures                        0
Destination Database insert failures                         0
Destination Group Database insert failures                   0
Subscription insert to Subscription Database failures        0
Sensor path Database delete failures                         0
Sensor Group Database delete failures                        0
Destination Database delete failures                         0
Destination Group Database delete failures                   0
Delete Subscription from Subscription Database failures      0
Sensor path delete in use                                    0
Sensor Group delete in use                                   0
Destination delete in use                                    0
Destination Group delete in use                              0
Delete destination(in use) failure count                     0
Sensor path Sensor Group list creation failures              0
Sensor path prop list creation failures                      0
Sensor path sec Sensor path list creation failures           0
Sensor path sec Sensor Group list creation failures          0
Sensor Group Sensor path list creation failures              0
Sensor Group Sensor subs list creation failures              0
Destination Group subs list creation failures                0
Destination Group Destinations list creation failures        0
Destination Destination Groups list creation failures        0
Subscription Sensor Group list creation failures             0
Subscription Destination Groups list creation failures       0
Sensor Group Sensor path list delete failures                0
Sensor Group Subscriptions list delete failures              0
Sensor Group Subscriptions unsupported data-source failures  0
Destination Group Subscriptions list delete failures         0
Destination Group Destinations list delete failures          0
Subscription Sensor Groups list delete failures              0
Subscription Destination Groups list delete failures         0
Destination Destination Groups list delete failures          0
Failed to delete Destination from Destination Group          0
Failed to delete Destination Group from Subscription         0
Failed to delete Sensor Group from Subscription              0
Failed to delete Sensor path from Sensor Group               0
Failed to get encode callback                                0
Failed to get transport callback                             0

This example displays the statistic summary of the data collection:

switch# show telemetry data collector brief

--------------------------------------------------------------------------------
Row ID         Collector Type       Successful        Failed            Skipped 
--------------------------------------------------------------------------------
1              NX-API               0                 0                 0        
2              SDB                  1513              902               0     


Note


Row ID is the table index


This example displays detailed statistics of the data collection, including a breakdown of all sensor paths:

switch# show telemetry data collector details

--------------------------------------------------------------------------------
Row ID         Successful     Failed         Skipped        Sensor Path(GroupId)
--------------------------------------------------------------------------------
1              496            305            0              analytics:inititl(100)
2              16             0              0              show_stats_fc1/3(100)
3              507            294            0              analytics:initit(100)
4              498            303            0              analytics:init(100)


Note


  • The Successful count displays the number of times data collection was successful for the sensor path.

  • The Failed count displays the number of times data collection failed for the sensor path.

  • The Skipped count displays the number of times the sensor path has no data or memory has reached the limits. It can also indicate the outstanding data collection for the sensor path is already in progress. When the sensor path refers to a differential query, the skipped count indicates there were no updated flow metrics in the present streaming interval.


This example displays the statistics of the SAN Telemetry Streaming pipeline. The SAN Telemetry Streaming pipeline provides statistics on collection and transport queues such as queue sizes, queue drops, and so on.


switch# show telemetry pipeline stats
Main Statistics:
    Timers:
        Errors:
            Start Fail        =     0

    Data Collector:
        Errors:
            Node Create Fail  =     0

    Event Collector:
        Errors:
            Node Create Fail  =     0    Node Add Fail     =     0
            Invalid Data      =     0

    Memory:
        Allowed Memory Limit                = 838860800 bytes
        Occupied Memory                     = 53399552 bytes

Queue Statistics:
    Request Queue:
        High Priority Queue:
            Info:
                Actual Size       =    50    Current Size      =     0
                Max Size          =     0    Full Count        =     0

            Errors:
                Enqueue Error     =     0    Dequeue Error     =     0

        Low Priority Queue:
            Info:
                Actual Size       =    50    Current Size      =     0
                Max Size          =     0    Full Count        =     0

            Errors:
                Enqueue Error     =     0    Dequeue Error     =     0

    Data Queue:
        High Priority Queue:
            Info:
                Actual Size       = 160000    Current Size      =     0
                Max Size          =     0    Full Count        =     0

            Errors:
                Enqueue Error     =     0    Dequeue Error     =     0

        Low Priority Queue:
            Info:
                Actual Size       =     2    Current Size      =     0
                Max Size          =     0    Full Count        =     0

            Errors:
                Enqueue Error     =     0    Dequeue Error     =     0

Telemetry uses gRPC connection for sending telemetry messages. The gRPC use HTTP2/TCP on port 50003. On MDS platforms the connection is established through mgmt0 interface using its IP address. Source port is picked by the linux kernel during connection. It uses long lived a TCP connection. This example displays all the configured transport sessions:

switch# show telemetry transport

Session Id      IP Address      Port       Encoding   Transport  Status    
--------------------------------------------------------------------------------
2               192.0.2.1    50009      GPB        gRPC       Connected 
0               2001:420:301:2005:3::11 
                                60003      GPB        gRPC       Connected 
1               2001:420:54ff:a4::230:e5 
                                50013      GPB        gRPC       Transmit Error
--------------------------------------------------------------------------------

Retry buffer Size:             10485760            
Event Retry Messages (Bytes):  0                   
Timer Retry Messages (Bytes):  10272300            
Total Retries sent:            0                   
Total Retries Dropped:         5377  


Note


The IP Address is the destination IP address and the port is the source TCP port.


Note


The Transmit error shows that the telemetry data send has failed. This can happen due to following reasons:

  • Connection with receiver is down. gRPC error code is UNAVAILABLE in this case.

  • Message send failures due to message drops. gRPC error code is DEADLINE_EXCEEDED in this case.

  • The connection will be retried each time the sample-interval expires.


This example displays detailed session information for a specific transport session:

switch# show telemetry transport 0

Session Id:          2                   
IP Address:Port      192.0.2.1:50009  
Transport:           GRPC                
Status:              Connected           
Last Connected:      Fri Jun 22 07:07:12.735 UTC
Last Disconnected:   Never               
Tx Error Count:      0                   
Last Tx Error:       None                
Event Retry Queue Bytes:       0                   
Event Retry Queue Size:        0                   
Timer Retry Queue Bytes:       0                   
Timer Retry Queue Size:        0                   
Sent Retry Messages:           0                   
Dropped Retry Messages:        0  


Note


The Connected status displays that the connection is established successfully and telemetry data send to receiver is successful.


This example displays details of a specific transport session:

switch# show telemetry transport 2 stats

Session Id:                    2                   
Connection Stats                                   
   Connection Count            2                   
   Last Connected:             Fri Jun 22 07:07:12.735 UTC
   Disconnect Count            0                   
   Last Disconnected:          Never               
Transmission Stats                                 
   Compression:                disabled            
   Source Interface:           not set()
   Transmit Count:             44                  
   Last TX time:               Fri Jun 22 07:14:16.533 UTC
   Min Tx Time:                227                 ms
   Max Tx Time:                3511                ms
   Avg Tx Time:                1664                ms
   Cur Tx Time:                227                 ms


Note


The following table shows the description of command outputs in show telemetry transport stats command output:

Table 3. Parameter Description

Command Output

Description

Min Tx Time

Minimum transmit time taken by telemetry to send the msg in that connection.

Max Tx Time

Maximum transmit time taken by telemetry to send the msg in that connection.

Avg Tx Time

Average transmit time taken by telemetry to send the msg in that connection.

Cur Tx Time

Transmit time taken by telemetry for the last message send the msg in that connection.

This command displays detailed error statistics for a specific transport session:

switch# show telemetry transport 2 errors

Session Id:                    1                   
Connection Errors                                  
   Connection Error Count:     0                   
Transmission Errors                                
   Tx Error Count:             1746                
   Last Tx Error:              Fri Jun 22 07:15:07.970 UTC
   Last Tx Return Code:        UNAVAILABLE 


Note


The following is a description of the return codes in the show telemetry transport errors command output:

Table 4. Parameter Description

Command Output

Description

OK

No errors were detected.

UNAVAILABLE

The configured IP address or port is not reachable. Check the configuration to verify if you have configured the correct IP address or port.

DEADLINE_EXCEEDED

Receiver has not responded for more than 30 seconds, or there are network delays.


Troubleshooting SAN Telemetry Streaming

Use the show tech-support telemetry command to collect telemetry data for troubleshooting. If you find any errors, check Configuring SAN Telemetry Streaming to verify the configuration.

Use the following information to troubleshooting telemetry status:

  1. Using the show analytics system-load command, check the NPU load. If the NPU load is high, disable analytics on some ports.

    
    switch# show analytics system-load 
     n/a - not applicable
     ----------------------------------- Analytics System Load Info -------------------------------
     | Module | NPU Load (in %) | ITLs   ITNs   Both  |        Hosts        |       Targets       |
     |        | SCSI NVMe Total | SCSI   NVMe   Total | SCSI   NVMe   Total | SCSI   NVMe   Total |
     ----------------------------------------------------------------------------------------------
     |   1    | 0    0    0     | 0      0      0     | 0      0      0     | 0      0      0     |
     |   4    | 64   0    64    | 20743  0      20743 | 0      0      0     | 346    0      346   |
     |   5    | 0    0    0     | 0      0      0     | 0      0      0     | 0      0      0     |
     |   8    | 0    0    0     | 0      0      0     | 0      0      0     | 0      0      0     |
     |   12   | 0    12   12    | 0      300    300   | 0      0      0     | 0      40     40    |
     |   13   | 0    0    0     | 0      0      0     | 0      0      0     | 0      0      0     |
     |   18   | 0    13   13    | 1      1      2     | 1      1      2     | 0      0      0     |
     | Total  | n/a  n/a  n/a   | 20744  301    21045 | 1      1      2     | 346    40     386   |
    
    As of Mon Apr  1 05:31:10 2019
    
  2. Using the show telemetry control database sensor-groups command, check the command output to verify if the sample interval timer is running. If the timer is not running, check if the timer is configured properly.
    
    switch# show telemetry control database sensor-groups
    Sensor Group Database size = 3
    ----------------------------------------------------------------------------------------------------
    Row ID     Sensor Group ID  Sensor Group type  Sampling interval(ms)  Linked subscriptions  SubID
    ----------------------------------------------------------------------------------------------------
    1          100              Timer   /SDB       5000      /Running      1                     100
    Collection Time in ms (Cur/Min/Max): 0/0/1
    Encoding Time in ms (Cur/Min/Max): 0/0/0
    Transport Time in ms (Cur/Min/Max): 0/0/0
    Streaming Time in ms (Cur/Min/Max): 1/1/4753
    
    Collection Statistics:
      collection_id_dropped      = 0
      last_collection_id_dropped = 0
      drop_count                 = 0
    
    2          1                Timer   /SDB       30000     /Running      1                     1
    Collection Time in ms (Cur/Min/Max): 5/4/16
    Encoding Time in ms (Cur/Min/Max): 2/2/11
    Transport Time in ms (Cur/Min/Max): 644/635/1589
    Streaming Time in ms (Cur/Min/Max): 3223/3168/4964
    
    Collection Statistics:
      collection_id_dropped      = 0
      last_collection_id_dropped = 0
      drop_count                 = 0
    
    
  3. Using the show telemetry data collector details command, check the command output to see if there are errors in collecting data. If you find errors, the sensor_path specified while configuring SAN Telemetry Streaming is incorrect and you must correct the sensor path.
    
    switch# show telemetry data collector details
    
    -----------------------------------------------------------------------
    Row ID         Successful  Failed Skipped  Sensor Path(GroupId)
    -----------------------------------------------------------------------
    1              0            2994     0       analytics:panup(1)
    2              2994         0        0       show_stats_fc2/2(1)
    3              0            2994     0       analytics:port(1)
    4              2994         0        0       show_stats_fc2/6(1)
    5              2994         0        0       show_stats_fc2/1(1)
    
    
  4. Using the show logging logfile | grep -i telemetry command, check for errors in the syslog message:

    
    switch# show logging logfile | grep -i telemetry
    2018 Jun 28 16:26:17 switch %TELEMETRY-4-TRANSPORT_SEND_ERROR: GRPC send to 172.20.30.129:60002 failed. (DEADLINE_EXCEEDED(len:2876013))


  5. If no issues are found using in step 1, step 2, and step 3, the issue is likely to be with the transport protocol. Using the show telemetry transport 0 errors command, check the command output to see if there are any transport protocol errors.

    The following reasons can cause transport protocol errors:

    • Configuring an incorrect IP address or port in the destination profile or subscription. Correct the IP address or port in the destination profile or subscription.

    • Receiver has not started. Check if the receiver is active and listening to the gRPC port.

    • Receiver has started, but is not processing the message. Check the receiver application for errors.

    • Problems exists with the management IP. Use the telnet command to test if the IP address and port can be reached.

    
    switch# show telemetry transport 1 errors
    
    Session Id:                    1
    Connection Errors
       Connection Error Count:     0
    Transmission Errors
       Tx Error Count:             0
       Last Tx Error:              None
       Last Tx Return Code:        OK