Configuring SAN Analytics

This chapter provides information about the SAN Analytics feature and how to configure it:

Feature History for Configuring SAN Analytics

Table 1. Feature History for Configuring SAN Analytics

Feature Name

Release

Feature Information

Reset AMC

9.3(1)

Added support for non-disruptive recovery of analytics by resetting the AMC.

SAN Analytics

9.2(2)

Added the Cisco MDS 9700 48-Port 64-Gbps Fibre Channel Switching Module to the list of supported hardware.

Some flow metrics were added and some flow metrics were deprecated. For more information, see Appendix.

Virtual Machine Identifier (VMID) Analytics

8.5(1)

The VMID Analytics feature was introduced to monitor, analyze, identify, and troubleshoot performance issues at VM level.

The analytics vm-tag veid command was introduced.

SAN Analytics

8.5(1)

Analysis of NVMe traffic was changed to count only IO frames. Previously, admin frames were also included.

ShowAnalytics Overlay CLI

8.5(1)

Added the --appendfile and --outfile options for the ShowAnalytics command.

The ShowAnalytics --help command output was modified.

ShowAnalytics Overlay CLI

8.4(2)

Added the option to list the command keywords and variables for the ShowAnalytics command and its options.

Added support for the Non-Volatile Memory Express (NVMe) metrics in the ShowAnalytics command.

ShowAnalytics Overlay CLI

8.4(1a)

Added the --alias argument for the --top option of the ShowAnalytics command.

SAN Analytics

8.4(1)

Added support for NVMe analytics type.

New NVMe view instances and flow metrics were added. For more information, see Flow Metrics.

The following commands were modified:

  • Added the fc-all and fc-nvme keywords to the [no] analytics type {fc-all | fc-nvme | fc-scsi } command.

  • Removed the type fc-scsi keyword from the show analytics flow congestion-drops [vsan number] [module number port number] command.

  • Added the --errorsonly , --evaluate-npuload , --minmax , --outstanding-io , --top , --vsan-thput , --alias , --limit , --key , --module , --progress , and --refresh options to the ShowAnalytics command.

The show analytics schema {fc-nvme | fc-scsi} {view-instance instance-name | views} command was introduced to display schema for the SCSI and NVMe analytics types.

Query Syntax

8.4(1)

Added support for NVMe analytics type.

The following query syntax supports fc-nvme analytics type:

select all | column1[, column2, column3, …] from analytics_type.view_type [where filter_list1 [and filter_list2 …]] [sort column [asc | desc]] [limit number]

SAN Analytics

8.4(1)

The following command outputs were modified:

  • show analytics port-sampling module number

  • show analytics system-load

  • ShowAnalytics

SAN Analytics

8.4(1)

Added the Cisco MDS 9396T 32-Gbps 96-Port Fibre Channel Fabric Switch and Cisco MDS 9148T 32-Gbps 48-Port Fibre Channel Fabric Switch to the list of supported hardware.

Query Syntax

8.3(2)

Added support for sorting the metrics and metadata fields in ascending or descending order.

The asc and desc options were added to the query syntax:

select all | column1[, column2, column3, …] from analytics_type.view_type [where filter_list1 [and filter_list2 …]] [sort column [asc | desc] ] [limit number]

The show analytics system-load command was introduced.

SAN Analytics

8.3(1)

The following command was introduced:

no analytics name query_name

See the Table 1 for commands that have changed from Cisco MDS NX-OS Release 8.2(1) to Cisco MDS NX-OS Release 8.3(1).

Port Sampling

8.3(1)

The Port Sampling feature allows you to gather data from a subset of ports in a module that is being monitored, cycle through multiple subsets of ports, and stream data from these ports at a regular port-sampling interval.

The following commands were introduced:

  • analytics port-sampling module number size number interval seconds

  • show analytics port-sampling module number

SAN Analytics

8.3(1)

Some flow metrics were introduced. For more information, see Flow Metrics.

SAN Analytics Support for Cisco MDS 9132T 32-Gbps 32-Port Fibre Channel Switch

8.3(1)

Added the Cisco MDS 9132T 32-Gbps 32-Port Fibre Channel switch to the list of supported hardware.

SAN Analytics Support for Cisco N-Port Virtualizer (Cisco NPV) switches

8.3(1)

Added guidelines and limitations for using the SAN Analytics feature on Cisco NPV switches.

SAN Analytics

8.2(1)

Added the Cisco MDS 9700 48-Port 32-Gbps Fibre Channel Switching Module to the list of supported hardware.

SAN Analytics

8.2(1)

The SAN Analytics feature allows you to monitor, analyze, identify, and troubleshoot performance issues on Cisco MDS 9000 Series Multilayer Switches.

The following commands were introduced:

  • analytics type fc-scsi

  • analytics query “query_string” type timer timer_val

  • clear analytics “query_string”

  • feature analytics

  • purge analytics “query_string”

  • ShowAnalytics

  • show analytics {query {“query_string” | id result} | type fc-scsi flow congestion-drops [vsan number] [module number port number]}

SAN Analytics Overview


Note


We recommended that you use the SAN Analytics feature in Cisco MDS NX-OS Release 8.3(1) or later releases.


The SAN Analytics feature allows you to monitor, analyze, identify, and troubleshoot performance issues on Cisco MDS switches. For a list of supported switches, see the Hardware Requirements for SAN Analytics.

In a Fibre Channel SAN environment, it is important to provision and monitor the performance of all devices to be able to resolve any issues that can hinder the performance of such devices. The SAN Analytics feature monitors flows bidirectionally, correlates the flows in a network processing unit (NPU) within a module or individual switch, and provides the fully analyzed network data to the user.

The following figure shows the functionality of the SAN Analytics feature:

Figure 1. SAN Analytics Overview

Hardware Requirements for SAN Analytics

The following table lists the Cisco MDS hardware that supports the SAN Analytics feature:

Table 2. List of Supported Hardware

Switch

Module

Cisco MDS 9700 Series Multilayer Directors

  • Cisco MDS 9700 48-Port 32-Gbps Fibre Channel Switching Module (DS-X9648-1536K9)

  • Cisco MDS 9700 48-Port 64-Gbps Fibre Channel Switching Module (DS-X9748-3072K9)

Cisco MDS 9396V 64-Gbps 96-Port Fibre Channel Fabric Switch

  • 96 x 64 Gbps Fixed Ports

Cisco MDS 9124V Fibre Channel Switch

  • 24 x 64 Gbps Fixed Ports

Cisco MDS 9148V Fibre Channel Switch

  • 48 x 64 Gbps Fixed Ports

Cisco MDS 9396T 32-Gbps 96-Port Fibre Channel Fabric Switch

  • 96 x 32 Gbps Fixed Ports

  • 32 Gbps Fibre Channel Expansion Module (M9XT-FC1632)

Cisco MDS 9148T 32-Gbps 48-Port Fibre Channel Fabric Switch

  • 48 x 32-Gbps Fixed Ports

Cisco MDS 9132T 32-Gbps 32-Port Fibre Channel Fabric Switch

  • 16 x 32-Gbps Fixed Ports

  • 16 x 32-Gbps Fibre Channel Expansion Module (M9XT-FC1632)

Guidelines and Limitations for SAN Analytics

  • This feature is not supported on VSANs where:

    • The default zone permit is configured.

    • The Inter-VSAN Routing (IVR) or Cisco MDS 9000 Input/Output Accelerator (IOA) feature is enabled.

    • Interoperability mode is enabled.

    • In-Order Delivery (IOD) is enabled.

  • This feature has the following restriction about queries:

    • The maximum number of push queries is eight. For information about push queries, see Information About SAN Analytics.

    • Does not support clearing and purging of individual metrics. For information about clearing and purging metrics, see Information About SAN Analytics.

    • The where condition in the query syntax can accept only the equal (=) operator. For more information, see Query Syntax.

  • We recommend that you do not configure the analytics type command on ports that are members of port channels that are connected to Cisco Nexus switches and Cisco UCS Fabric Interconnects (SAN port channels) to avoid seeing missing and erroneous metrics.

  • For a switch operating in Cisco NPV mode, when server logins move from one uplink to another, either via automatic load balancing by NX-OS or manual rebalancing by the user, the show analytics system-load command output may display an incorrect ITL count on that switch. This occurs if any auto load balanced devices ever need to log in again and do so via a different upstream link. If they do so, then they are assigned a new FCID. Because old analytics device FCID metrics are not automatically removed these stale entries result in additional ITL counts. You must purge the metrics first using the purge analytics “query_string” command before using the show analytics system-load command to get the correct data.

  • The show analytics system-load command output displays incorrect ITL count after the VMID Analytics feature is initially enabled. To get the correct ITL count, you must first purge the metrics using the purge analytics “select all from fc-scsi.port” command before using the show analytics system-load command to get the correct data.

  • If the total number of ITL records in an analytics engine port set exceeds 4000 on a Cisco MDS 48-Port 64-Gbps Fibre Channel Switching Module (DS-X9748-3072K9), incomplete analytics data may be reported. See the Analytics Engine Port Set Mapping section for how to reduce the number of flows in the port set and avoid this issue.

    The following syslog is displayed when this limit is exceeded:
    
    %ANALYTICS_LC_MGR-SLOT1-4-ANALYTICS_LC_MGR_4K_ITL_LIMIT_HIT: Analytics data may be incomplete on few ports : 
    Affected ports are fc1/5,fc1/1,fc1/7,fc1/3
    
  • Analytics support on interfaces that are part of a port channel can have an impact on the overall analytics scale numbers.

  • The select all option in the query syntax does not display VMID metrics. To view VMID metrics, you must specify one or more individual metrics in the query string and include the vmid key. For example, show analytics query "select port,vsan,app_id,vmid,target_id,initiator_id,lun, active_io_read_count,active_io_write_count from fc-scsi.scsi_initiator_itl_flow" .

  • When this feature is used along with Cisco DCNM (or third-party devices or applications), the Network Time Protocol (NTP) must be synchronized. For information on NTP, see the "Configuring NTP" section in the Cisco MDS 9000 Series Fundamentals Configuration Guide.

  • This feature is not supported on Switched Port Analyzer (SPAN) Destination ports, more commonly known as SD ports, and NP (N-Port) ports. If you are enabling this feature on a range of interfaces, ensure that there are no SD or NP ports in that range of interfaces. Otherwise, this feature will not get enabled on any interface.

  • This feature only analyzes frames containing standards-based commands. In Cisco MDS NX-OS Releases 8.2(x) and Release 8.3(x), Fibre Channel Protocol (FCP) SCSI read and write commands are supported. From Cisco MDS NX-OS Release 8.4(1), both Fibre Channel SCSI and Fibre Channel Non-Volatile Memory Express (NVMe) read and write commands are supported. This feature does not analyze any frames containing proprietary commands; these are typically used by storage replication technologies.

  • If the feature analytics command is enabled in Cisco MDS NX-OS Release 8.2(1) or Release 8.3(1), upgrading or downgrading between Cisco MDS NX-OS Release 8.2(1) and Release 8.3(1) is supported only after this feature is disabled using the no feature analytics command before upgrading or downgrading, and then re-enabling this feature using the feature analytics command.

    After downgrading from Cisco MDS NX-OS Release 8.3(1) or later releases to Release 8.2(1), this feature works only after you perform the workarounds mentioned in the caveat CSCvm19337.

  • After upgrading, downgrading, reloading a switch, or reloading a module, all the flow metrics will be purged.

  • This feature is not supported when the switch is in soft zoning mode.

  • We recommend that the streaming-sample interval (snsr-grp id sample-interval interval ), port-sampling interval (analytics port-sampling module number size number interval seconds ), and push-query interval (analytics query “query_string” name query_name type periodic [interval seconds] [clear] [differential] ) be configured with the same value. We also recommend that you change or configure the push-query interval first, then the port-sampling interval, and finally, the streaming-sample interval.


    Caution


  • To avoid exceeding the network processing unit (NPU) capacity and its consequences, use the Port Sampling feature to analyze the flow metrics. For more information, see Port Sampling.

  • After you purge a view instance and its associated metrics, we recommend that you wait for few seconds before executing a pull query, because some fields in the flow metrics may contain irrelevant values until the purge operation is complete.

  • NVMe analytics is compatible with the Fibre Channel Non-Volatile Memory Express - 1 (FC-NVMe-1) and FC-NVMe-2 standards.

  • This feature tracks every flow metric on a per-port basis. Flow requests and responses spanning different physical ports on a switch may result in some flow metrics not being accurately computed. This condition specifically occurs when this feature is enabled on Inter-Switch Link (ISL) ports (E ports).

    The following is a lists the scenarios where a request response can be seen on different ISL ports:

    • The load-balancing scheme is changed to Source ID (SID)-Destination ID (DID) by the user using the vsan ID loadbalancing src-dst-id command.

    • ISLs (E ports) are configured to nontrunking mode by the user using the switchport trunk mode off command.

    • ISLs (E ports) that are part of a port channel, and the port-channel is not configured to the active mode using the no channel mode active command.

    • This feature does not work on nontrunk ISL or port channel. For this feature to work on an E port, the E port should have the trunk mode on.

    • ISLs are not bundled together to be part of a port channel; that is, ECMP ISLs and ECMP port-channels are not supported.

    • There is a port channel between the Cisco MDS 9250i Multiservice Fabric Switch or Cisco MDS 9148S 16-G Multilayer Fabric Switch and the Cisco MDS 9700 48-Port 32 Gbps Fibre Channel Switching Module (DS-X9648-1536K9).

  • This feature is not supported on a FICON enabled Cisco MDS 9000 switches.

  • SAN Analytics is supported on MDS 9124V and MDS 9148V from Release 9.4(1). To downgrade to an earlier release on this switch, you must disable SAN Analytics before the downgrade.

  • SAN Analytics is supported on MDS 9396V from Release 9.4(2). To downgrade to an earlier release on this switch, you must disable SAN Analytics before the downgrade.

Command Changes

Some commands have undergone changes in Cisco MDS NX-OS Release 8.3(1). This document displays commands that are introduced or changed in Cisco MDS NX-OS Release 8.3(1). See the Table 1 for the commands that are equivalent to the ones used in Cisco MDS NX-OS Release 8.2(1).

We recommended that you use the SAN Analytics feature in Cisco MDS NX-OS Release 8.3(1) and later releases.

Table 1 lists the changes made to the commands in Cisco MDS NX-OS Release 8.3(1):

Table 3. Command Changes

Cisco MDS NX-OS Release 8.2(1)

Cisco MDS NX-OS Release 8.3(1)

analytics query “query_string” type timer timer_val

analytics query “query_string” name query_name type periodic [interval seconds] [clear] [differential]

clear analytics “query_string”

clear analytics query “query_string”

purge analytics “query_string”

purge analytics query “query_string”

show analytics query {“query_string” | id result}

show analytics query {“query_string” [clear] [differential] | all | name query_name result}

Information About SAN Analytics

The SAN Analytics feature collects flow metrics using frames of interest, for data analysis, and includes the following components:

  • Data Collection—The flow data is collected from NPU and eventually sent and stored on the supervisor of a switch. The data that is displayed is the real time view of the data and does not display historical data.

  • On-board Querying—The data that is stored in a database can be extracted using a pull query, a push query, or overlay CLIs. Queries are used to extract the flow metrics of interest from the database. The frames of interest are used to monitor, analyze, and troubleshoot performance issues on a switch. For more information, see Constructing and Using Queries.

    The following are the different ways of querying the database:

    • The pull query is a one-time query that is used to extract the flow information that is stored in the database at the instant the query is executed. The output is in JSON format. Pull queries are NX-API compliant.

      The overlay CLI ShowAnalytics command is a python script that issues a predefined pull query that displays the flow metrics in a user-friendly tabular format. It is a CLI wrapper that is written in Python and stored in the bootflash for execution.

      From Cisco MDS NX-OS Release 8.3(1), the following options are supported in a pull query:

      • Clear—Clears all minimum, maximum, and peak flow metrics.

      • Differential—Returns the absolute value of only the ITL or ITN flow metrics that were updated between the last and the present streaming intervals. We recommend that you use the differential query to improve scale values of your switch.

    • Push query—A recurring query that is installed to periodically extract the flow metrics that are stored in the database and send them to a destination. The output is in JSON format.

      From Cisco MDS NX-OS Release 8.3(1), the following options are available in a push query:

      • Clear—Clears all minimum, maximum, and peak flow metrics.

      • Differential—Returns the absolute value of only the ITL or ITN flow metrics that were updated between the last and the present streaming intervals. We recommend that you use the differential query to improve scale values of your switch.

      Push query supports the following modes for extracting flow metrics:

      • Continuous mode—Data is gathered continuously on all analytics-enabled ports.

      • Sampling mode—Data is gathered on a subset of analytics-enabled ports at a configured port-sampling interval, and then the data-gathering mechanism is cycled through the next subset of ports. For example, data is gathered on a group of 6 ports from the 24 analytics-enabled ports with a port sampling interval of 30 seconds. For more information, see Port Sampling.

The database that is used for storing the flow metrics is organized according to the following hierarchy:

  • Analytics Type—The protocol type to analyze. fc-scsi analytics type is supported in Cisco MDS NX-OS Release 8.2(x) and Cisco MDS NX-OS Release 8.3(x). fc-scsi and fc-nvme analytics types are supported from Cisco MDS NX-OS Release 8.4(1).

  • View—A view is a selection of flow metrics in the database defined by any valid combination of port, VSAN, initiator, target, LUN, and namespace ID parameters.

  • View Type—Views are defined based on components that constitute a flow, for example, port view, initiator_IT view, target_ITL view, and so on. The query syntax is used to run queries on a view type. The syntax supports only one query on a single view type. For a list of view types that are supported, see List of Supported View Types.

  • View Instance—An instance of a given view type. View instance has its own flow metrics. For example, for port view type, fc1/1 is one instance, fc1/2 is another instance, and so on.

  • Flow Metrics—The flow metrics that are used for analysis. From Cisco MDS NX-OS 8.5(1) NVMe traffic metrics include only IO frames as classified by the NVMe frame's Category field. Prior to this release both IO and admin frames were included. For information about the list of flow metrics that are supported, see the view profiles in the Flow Metrics section in Appendix.

The following image shows the various components of a sample database:

Figure 2. Sample Database

For sample examples on configuring a query syntax, see the Examples: Configuring Query Syntax.

The following is the flow data collection workflow:

  1. Feature Enablement—Enable the SAN Analytics feature on switches for which flow metrics have to be analyzed.

  2. Interface Enablement—Enable collection of flow metrics on interfaces. We recommend that you enable the SAN Analytics feature on host interfaces, as seen in the images in Deployment Modes.

  3. Executing and Installing Queries—The following queries are used to retrieve flow metrics from the database:

    • Pull Query—Provides near real-time flow metrics for troubleshooting issues directly on a switch. Data from a pull query is extracted from the database at that instant and responded to the query. Pull query can be executed using CLI or via NX-API. Cisco DCNM can use the NX-API to gather data for visualization.

      Overlay CLI—A predefined pull query that displays the flow metrics in a user-friendly tabular format. It provides near real-time flow metrics for troubleshooting issues directly on a switch.

      The following image shows the functionality of a pull query:

      Figure 3. Pull Query
    • Push Query—Provides flow metrics at regular intervals. You can specify a time interval, in seconds. After the time interval expires, the flow metrics that are of interest to the user are refreshed and pushed from the database. When multiple queries are installed, each of the push queries pushes the flow metrics independent of each other, which is the expected behavior.


      Note


      • Pull query, push query, and overlay CLI are applicable only on the interfaces on which the SAN Analytics feature is enabled.

      • Push query timer fetches flow metrics from the NPU and stores them in the database on the supervisor at a specified push query interval.


      The following image shows the functionality of a push query where only certain metrics are set to be updated at specific intervals:

      Figure 4. Push Query
  4. Clearing and Resetting Metrics—The following features allow you to clear or reset the flow metrics that are collected in a database:

    • Purge—Deletes a specified view instance and all the metrics that are associated with this view instance. The view instance is immediately rebuilt with the new IO and all view metrics start counting from zero. Use this option to flush any stale metrics from a view, such as when an initiator or target is no longer active or present.

      The following image shows the purge metrics query functionality:

      Figure 5. Purge Metrics Query
    • Clear—Resets all the metrics that match the specified query string to zero except the flow metrics of the type key. After clearing, the database continues to collect the flow metrics for the specified query.


      Note


      The clear analytics query command is different from the clear option that is used in a push query. The clear analytics query command resets all the metrics that meet the query syntax and the clear option that is used in a push query resets the minimum, maximum, and peak flow metrics.


      The following image shows the clear metrics query functionality:

      Figure 6. Clear Metrics Query

VMID Analytics


Note


The VMID Analytics feature is currently in beta status for use in non-production environment only. Contact your account teams or Cisco MDS marketing team to understand the use case before enabling this feature. This beta status and restriction will change to regular production status in an upcoming release.


The SAN Analytics feature provides Fibre Channel traffic information at a device (per FCID) level. However, end devices can host multiple virtual entities (virtual machines [VMs]) and each VM can cause a varying load on the Fibre Channel fabric. Therefore, it becomes crucial to monitor the Fibre Channel performance of each VM. The VMID Analytics feature can be used to monitor, analyze, identify, and troubleshoot Fibre Channel performance issues at a VM level.

Individual VMs within a given device use the same FCID for their SCSI and NVMe IO exchanges. The NX-OS Virtual Machine Identifier (VMID) server feature enables resolving traffic sources from a per-FCID device level to an individual VM level. For more information on this feature, see the "VMID" section in the "Managing FLOGI, Name Server, FDMI, and RSCN Databases" chapter of the Cisco MDS 9000 Series Fabric Configuration Guide, Release 8.x.

After the VMID server feature is enabled, the VMID Analytics feature can subsequently be enabled to resolve performance metrics for initiators. When enabled, analytics views that used to report the initiator level metrics will also report VMID level metrics. Only the view types which include the scsi-initiator-id or nvme-initiator-id key are monitored. An additional vmid key is supported for these view types. You must specify the vmid key as part of the "selected fields" list along with the initiator ID in the query syntax to collect the VMID-specific analytics. If VMID is not specified in the "selected fields" list and only the initiator ID is specified then the aggregated metrics are collected for the initiator.

Disabling the VMID Server feature cause attached devices to stop inserting VMID information into Fibre Channel frames. Also, when the VMID Analytics feature is disabled the frames are counted against the source FCID and not the VMID. However, the Analytics database continues to retain the previously collected per-VMID metrics. You must purge the metrics or perform a nondisruptive module upgrade to reset the database. If you do not purge the metrics, then the output of the pull or push query with and without using the differential option will be as follows:

  • When you use the differential option in a pull or push query after the VMID Analytics feature is disabled, only the first pull or push query will contain the stale per-VMID metrics.

  • When you do not use the differential option in a pull or push query after the VMID Analytics feature is disabled, every pull or push query will fetch the stale per-VMID metrics.

The VMID Analytics feature was introduced in Cisco MDS NX-OS Release 8.5(1).

Port Sampling

The Port Sampling feature that is introduced in Cisco MDS NX-OS Release 8.3(1) allows you to gather data from a subset of ports in a module that is already being monitored, cycle through the various subsets of ports, and stream data from these ports at a regular port-sampling interval.

This feature is useful when the NPU load is high and you cannot reduce the number of ports that are being monitored on a module. In such a situation, the load on the NPU can be reduced by sampling a subset of the monitored ports at a specified port-sampling interval. Use the show analytics system-load command to check the NPU load.

In Cisco MDS NX-OS Release 8.3(2), system messages were introduced to alert you if the NPU load is high when the ITL count exceeds a module limit, when the ITL count exceeds the system limit, and when there is no response from NPU for analytics data. For more information, see the Cisco MDS 9000 Family and Nexus 7000 Series NX-OS System Messages Reference document.

Any I/O and errors that occur on a monitored port, when it is not being sampled, are not seen and not included in the analytics data.

The port sampling interval that is used in this feature is independent of the streaming sample interval. We recommend that you set the streaming-sample interval, port-sampling interval, and push query interval to be equal to or more than the minimum recommended value of 30 seconds.


Note


When this feature is enabled on a module and then the SAN Analytics feature is enabled on new ports on the module, the port-sampling data for the new ports are streamed only after the next port-sampling interval.


Port-Sampling Scenarios

Let us consider a module consisting of 48 ports and group them into two subsets of 24 ports. Depending on the port-sampling intervals that are configured for these subsets of ports and the streaming-sample interval that is configured, flow metrics can be captured at different intervals as seen in the following examples:

Figure 7. Port-Sampling Groups
  • When the port-sampling interval and the streaming-sample interval start at the same time:

    Figure 8. Port Sampling Interval and Streaming Sample Interval Starting at the Same Time
  • When the port-sampling interval and the streaming-sample interval start at a different time:

    Figure 9. Port Sampling Interval and Streaming Sample Interval Starting at a Different Time

Analytics Engine Port Set Mapping

Starting with 64 Gbps capable ports, analytics data on a module is managed as sets of ports by the port ASICs. The data from each port set are stored in a dedicated memory block. To avoid analytics data loss, the total number of ITL flows monitored through each port set should not exceed the capacity of the associated block.

Device Maximum ITL Flows per monitoring interval

DS-X9748-3072K9

4000 flows per port set

If the number of ITL flows per port set exceeds the capacity of the associated block, it may be reduced by disabling analytics on one or more of the ports in a port set, or by moving the traffic to a physical port in a different port set.

Table 1 provides the partitioning of ports to analytics engine port sets:

Table 4. Analytics Engine Port Set Mapping
Device Analytics Engine Port Set Front Panel Port Numbers

DS-X9748-3072K9

1

9, 11, 13, 15

2

25, 27, 29, 31

3

10, 12, 14, 16

4

26, 28, 30, 32

5

1, 3, 5, 7

6

33, 35, 37, 39

7

2, 4, 6, 8

8

34, 36, 38, 40

9

17, 19, 21, 23

10

41, 43, 45, 47

11

18, 20, 22, 24

12

42, 44, 46, 48

Deployment Modes

Depending on where the switches that support the SAN Analytics feature are deployed in a SAN fabric, the following deployment modes are possible:

Host Edge Deployment Mode

The SAN Analytics feature is enabled on all Cisco MDS core switches and on interfaces that are connected to hosts.

Figure 10. Host Edge Deployment Mode

Storage Edge Deployment Mode

The SAN Analytics feature is enabled on all the Cisco MDS core switches and on the interfaces that are connected to storage arrays.

Figure 11. Storage Edge Deployment Mode

ISL Deployment Mode

The SAN Analytics feature is enabled on all the Cisco MDS switches and on the interfaces that are on any one side of ISLs.

Figure 12. ISL Deployment Mode

The following image shows the functionality of the SAN Analytics feature when supported and unsupported modules (16-Gbps Fibre Channel, Cisco MDS 9700 40-Gbps 24-Port FCoE Module (DS-X9824-960K9), Cisco MDS 24/10-Port SAN Extension Module (DS-X9334-K9), and so on) are used in SAN.


Note


The numbers 1 and 2 in the Functionality of the SAN Analytics Feature When Supported and Unsupported Modules are Used represent two different flows from initiators to targets respectively.


Figure 13. Functionality of The SAN Analytics Feature When Supported and Unsupported Modules are Used

Note


  • In the above ISL mode scenarios, the request responses can be seen on different members of port channel.

  • When supported and unsupported modules are used on ISL, the analytics data that is analyzed on the ISL may not be accurate. Hence, we recommend that you do not analyze data on ISL where supported and unsupported modules are used.


Configuring SAN Analytics

Enable the SAN Analytics feature on both a switch and its interfaces in order to enable flow metric collection from the interfaces.


Note


  • To use the SAN Analytics feature, you must install an appropriate license package using the install license command. For more information, see the Cisco MDS 9000 Series Licensing Guide.

  • If you are using Cisco DCNM SAN Insights, you can configure the SAN Analytics feature in Cisco DCNM SAN Insights and there is no need to configure this feature on the switch. For more information, see the "Configuring SAN Insights" section in the Cisco DCNM SAN Management Configuration Guide.


Enabling SAN Analytics


Note


  • The SAN Analytics feature is disabled by default.

  • When the active ITL count exceeds the documented limit, a syslog message will be logged..


To enable the SAN Analytics feature on a switch, perform these steps:

Procedure


Step 1

Enter global configuration mode:

switch# configure terminal

Step 2

Enable the SAN Analytics feature on the switch:

switch(config)# feature analytics


Disabling SAN Analytics

To disable the SAN Analytics feature on a switch, perform these steps:

Procedure


Step 1

Enter global configuration mode:

switch# configure terminal

Step 2

Disable the SAN Analytics feature on the switch:

switch(config)# no feature analytics


Enabling SAN Analytics on an Interface

To enable the SAN Analytics feature on an interface, perform these steps:

Before you begin


Note


The SAN Analytics feature is disabled by default on all interfaces.


  • Enable the SAN Analytics feature on the switch. See the Enabling SAN Analytics section.

  • In port channels, enable the SAN Analytics feature on all the interfaces.

Procedure


Step 1

Enter global configuration mode:

switch# configure terminal

Step 2

Select a Fibre Channel interface or a range of interfaces and enter interface configuration submode:

switch(config)# interface fc slot number/port number

Note

 
You can also specify the range for interfaces using the interface fc slot number/port number - port number , fc slot number/port number - port number command. The spaces are required before and after the dash ( - ) and before and after the comma ( , ).

Step 3

Enable the SAN Analytics feature on the selected interface:

switch(config-if)# analytics type {fc-all | fc-nvme | fc-scsi}

Note


Only the fc-scsi analytics type was supported in Cisco MDS NX-OS Release 8.2(x) and Cisco MDS NX-OS Release 8.3(x). From Cisco MDS NX-OS Release 8.4(1), the fc-scsi , fc-nvme , and fc-all analytics types are supported.


Disabling SAN Analytics on an Interface

To disable the SAN Analytics feature on an interface, perform these steps:

Before you begin

In port channels, disable the SAN Analytics feature on all the interfaces.

Procedure


Step 1

Enter global configuration mode:

switch# configure terminal

Step 2

Select a Fibre Channel interface or a range of interfaces and enter interface configuration submode:

switch(config)# interface fc slot number/port number

Note


You can also specify the range for interfaces using the interface fc slot number/port number - port number , fc slot number/port number - port number command. The spaces are required before and after the dash ( - ) and before and after the comma ( , ).

Step 3

Disable the SAN Analytics feature on the selected interface:

switch(config-if)# no analytics type {fc-all | fc-nvme | fc-scsi}


Enabling VMID Analytics

To enable the VMID Analytics feature on a switch, perform these steps:

Before you begin

  1. Ensure that the attached HBAs have firmware that supports VMID capability and that the capability is enabled on the HBA.

  2. Enable the SAN Analytics feature on the switch. See the Enabling SAN Analytics section.

  3. Enable SAN Analytics on an interface. See the Enabling SAN Analytics on an Interface section.

  4. Enable the VMID Server feature. See the "Enabling the VMID Server" section in the "Managing FLOGI, Name Server, FDMI, and RSCN Databases" chapter of the Cisco MDS 9000 Series Fabric Configuration Guide, Release 8.x.

Procedure


Step 1

Enter global configuration mode:

switch# configure terminal

Step 2

Enable the VMID Analytics feature on the switch:

switch(config)# analytics vm-tag veid


Disabling VMID Analytics

To disable the VMID Analytics feature on a switch, perform these steps:

Procedure


Step 1

Enter global configuration mode:

switch# configure terminal

Step 2

Disable the VMID Analytics feature on the switch:

switch(config)# no analytics vm-tag veid


Enabling Port Sampling


Note


  • Port sampling is supported only in Cisco MDS NX-OS Release 8.3(1) and later releases.

  • Port sampling is disabled by default, and continuous monitoring is enabled on all the analytics-enabled ports. For more information on port sampling, see Port Sampling.


To enable port sampling on a module, perform these steps:

Procedure


Step 1

Enter global configuration mode:

switch# configure terminal

Step 2

Enable port sampling on a module:

switch# analytics port-sampling module number size number interval seconds


Disabling Port Sampling

To disable port sampling on a module, perform these steps:

Procedure


Step 1

Enter global configuration mode:

switch# configure terminal

Step 2

Disable port sampling on a module and go back to the default mode of monitoring all analytics-enabled ports with the configured streaming-sample interval:

switch# no analytics port-sampling module number


Example: Configuring SAN Analytics

This example shows how to enable the SAN Analytics feature on a switch:


switch# configure terminal
switch(config)# feature analytics

This example shows how to disable the SAN Analytics feature on a switch:


switch# configure terminal
switch(config)# no feature analytics

This example shows how to enable the SAN Analytics feature on an interface for the SCSI analytics type when the NVMe analytics type is already enabled:

  • This example displays that the NVMe analytics type is already enabled:

    
    switch# show running-config analytics
    
    !Command: show running-config analytics
    !Running configuration last done at: Wed Mar 13 09:01:56 2019
    !Time: Wed Mar 13 09:02:52 2019
    
    version 8.4(1)
    feature analytics
    
    
    interface fc1/1
      analytics type fc-nvme
    
    
  • This example displays how to enable the SCSI analytics type on a single port:

    
    switch# configure terminal
    switch(config)# interface fc 1/1
    switch(config-if)# analytics type fc-scsi
    
    
  • This example displays that the SCSI analytics type is enabled:

    
    switch# show running-config analytics
    
    !Command: show running-config analytics
    !Running configuration last done at: Wed Mar 13 09:01:56 2019
    !Time: Wed Mar 13 09:02:52 2019
    
    version 8.4(1)
    feature analytics
    
    
    interface fc1/1
      analytics type fc-scsi
      analytics type fc-nvme


Querying Metrics on a Switch

When you run a pull query CLI, the specified metrics are collected from the NPU of a module, stored in the metric database on the supervisor, and then displayed in the user session.

Schema for Querying Metrics

A schema is used to display the data of interest that is stored in a database to a user. Use the show analytics schema command for more information on schema. Metrics are maintained in a database in the form of various view instances. These view instances can be retrieved using queries. See Views for more information.

Query Syntax

The following is the query syntax that is used in the pull query, push query, clearing metrics, and purging views:

select all | column1[, column2, column3, …] from analytics_type.view_type [where filter_list1 [and filter_list2 …]] [sort column [asc | desc]] [limit number]

The following are the elements of the query syntax:

  • analytics_type —Specifies the analytics type. Only the fc-scsi type is supported in Cisco MDS NX-OS Release 8.2(1) and Cisco MDS NX-OS Release 8.3(1). From Cisco MDS NX-OS Release 8.4(1), fc-nvme analytics type is supported.

  • view_type —Specifies the view type of a metric database. The syntax is used to run queries on it. The syntax supports only one query on a single view type. For the list of supported view types and their descriptions, see List of Supported View Types.

  • column —Specifies the flow metrics. A view instance contains multiple columns.

  • filter_list —Specifies the filters to extract specific metrics of a view instance. You can use the filter conditions on a flow metric column whose type is a key value or on a view instance column. You can also use the AND operator for filtering. For a list of view types that are supported, see List of Supported View Types.

  • sort —Specifies to sort the results in a column. Sorting is performed before the limit operation is performed.

  • asc —Sorts the results in a column in ascending order. By default, sorting is done in ascending order if no order is specified.

  • desc —Sorts the results in a column in descending order.

  • limit —Limits the number of metrics that are returned in a result.

For examples on configuring query syntax, see the Examples: Configuring Query Syntax.


Note


  • The limit and where options in the "query_string" can only be used on the key fields.

  • Prior to Cisco MDS NX-OS, Release 8.3(2), the sort option in the "query_string" could only be used on the key fields and the metrics were sorted only in ascending order. From Cisco MDS NX-OS, Release 8.3(2), the sort option in the "query_string" can be used on all the metrics and metadata fields and can be sorted in ascending or descending order using the asc or desc options respectively. By default, sorting is performed in ascending order if no order is specified.

    If you have configured push queries with the sort asc or sort desc option, make sure that you remove these sort options before downgrading from Cisco MDS NX-OS, Release 8.3(2) to Cisco MDS NX-OS, Release 8.3(1) or earlier releases.


Query Rules

The following are the rules for constructing queries:

  • The select , from , where , sort , and limit conditions should be used in the same order as described in Query Syntax.

  • The list of columns under the select condition should belong to the schema that corresponds to the view_type under the from condition.

  • The where condition is allowed only on flow metric fields whose type is a key value. For information about the flow metric fields whose type is a key value, see List of Supported View Types.

  • Before Cisco MDS NX-OS, Release 8.3(2), the sort condition must be a metric field and should be present among the columns that are listed under the select condition. From Cisco MDS NX-OS, Release 8.3(2), the sort condition must be a metric or metadata field and should be present among the columns that are listed under the select condition.

Views

A view is a representation of the flow metrics about a port, initiator, target, LUN, or any valid combination of these. Each view type supports specific flow metrics. To optimize resource utilization, long names in the flow metrics are used for OnBoard queries and short names are used for SAN Telemetry Streaming. For more information, see Flow Metrics.

List of Supported View Types

The following table lists the supported view types:

Table 5. Supported View Types

View Type

Description

Keys

port

A port’s view contains metadata and IO metrics for ports on a switch.

port

logical_port

A logical port view contains metadata and IO metrics for VSANs configured for ports on a switch.

port and vsan

app

An application view contains metadata and IO metrics for the concerned applications hosted behind various ports that are performing IO operations.

port and app-id

scsi_target

A target view contains metadata and IO metrics for SCSI targets that are deployed behind various ports on a switch that execute IO operations.

port, vsan, and scsi-target-id

nvme_target

A target view contains metadata and IO metrics for NVMe targets that are deployed behind various ports on a switch that execute IO operations.

port, vsan, and nvme-target-id

scsi_initiator

An initiator view contains metadata and IO metrics for initiators that are deployed behind various ports on a switch that initiate IO operations.

port, vsan, scsi-initiator-id, and vmid

nvme_initiator

An initiator view contains metadata and IO metrics for initiators that are deployed behind various ports on a switch that initiate IO operations.

port, vsan, nvme-initiator-id, and vmid

scsi_target_app

A target app view contains metadata and IO metrics for the applications whose data is hosted on various targets.

port, vsan, scsi-target-id, and app-id

nvme_target_app

A target app view contains metadata and IO metrics for the applications whose data is hosted on various targets.

port, vsan, nvme-target-id, and app-id

scsi_initiator_app

An initiator app view contains metadata and IO metrics for the applications for which initiators initiate IO operations.

port, vsan, scsi-initiator-id, app-id, and vmid

nvme_initiator_app

An initiator app view contains metadata and IO metrics for the applications for which initiators initiate IO operations.

port, vsan, nvme-initiator-id, app-id, and vmid

scsi_target_it_flow

A target initiator-target (IT) flow view contains metadata and IO metrics for IT flows associated with various targets.

port, vsan, scsi-target-id, scsi-initiator-id, and vmid

nvme_target_it_flow

A target initiator-target (IT) flow view contains metadata and IO metrics for IT flows associated with various targets.

port, vsan, nvme-target-id, nvme-initiator-id, and vmid

scsi_initiator_it_flow

An initiator IT flow view contains metadata and IO metrics for the IT flows associated with various initiators.

port, vsan, scsi-initiator-id, scsi-target-id, and vmid

nvme_initiator_it_flow

An initiator IT flow view contains metadata and IO metrics for the IT flows associated with various initiators.

port, vsan, nvme-initiator-id, nvme-target-id, and vmid

scsi_target_tl_flow

A target target-LUN (TL) flow view contains metadata and IO metrics for the LUNs associated with various SCSI targets.

port, vsan, scsi-target-id, and lun-id

nvme_target_tn_flow

A target target-namespace ID (TN) flow view contains metadata and IO metrics for the namespace IDs associated with various NVMe targets.

port, vsan, nvme-target-id, and namespace-id

scsi_target_itl_flow

A target initiator-target-LUN (ITL) flow view contains metadata and IO metrics for the ITL flows associated with various SCSI targets.

port, vsan, scsi-target-id, scsi-initiator-id, lun-id, and vmid

nvme_target_itn_flow

A target initiator-target-namespace ID (ITN) flow view contains metadata and IO metrics for the ITN flows associated with various NVMe targets.

port, vsan, nvme-target-id, nvme-initiator-id, namespace-id, and vmid

scsi_initiator_itl_flow

An initiator ITL flow view contains metadata and IO metrics for the ITL flows associated with various SCSI initiators.

port, vsan, scsi-initiator-id, scsi-target-id, lun-id, and vmid

nvme_initiator_itn_flow

An initiator ITN flow view contains metadata and IO metrics for the ITN flows associated with various NVMe initiators.

port, vsan, nvme-initiator-id, nvme-target-id, namespace-id, and vmid

scsi_target_io

A target IO view contains IO transaction details for the active IOs that various targets execute.

port, vsan, scsi-target-id, scsi-initiator-id, ox-id, and vmid

nvme_target_io

A target IO view contains IO transaction details for the active IOs that various targets execute.

port, vsan, nvme-target-id, nvme-initiator-id, ox-id, and vmid

scsi_initiator_io

An initiator IO view records IO transaction details for the active IOs that various initiators initiate.

port, vsan, scsi-initiator-id, scsi-target-id, ox-id, and vmid

nvme_initiator_io

An initiator IO view records IO transaction details for the active IOs that various initiators initiate.

port, vsan, nvme-initiator-id, nvme-target-id, ox-id, and vmid

View Types Representation


Note


The examples provided in this section are for SCSI analytics type and can be extended to the NVMe analytics type as well.


We have considered a sample topology to explain the different view types. In the following image:

  • Initiator 1 and Initiator 2 are configured in VSAN 1 and are communicating with Target 1, Target 2, LUN 1, and LUN 2 in zone 1.

    • Initiator 1 generates 125 read I/Os to Target 1 and 75 read I/Os to Target 2.

    • Initiator 2 generates 50 read I/Os to Target 1 and Target 2 respectively.

  • Initiator 3 is configured in VSAN 2 and communicates with Target 3, LUN 3, and LUN 4 in zone 2.

    Initiator 3 generates 300 read I/Os to Target 3. Target 3 is generating 150 read I/Os to LUN 3 and LUN 4 respectively.


Note


The information that is provided in brackets in the following images are the Fibre Channel IDs (FCIDs) of the devices.


For the list of supported view types and their descriptions, see List of Supported View Types.

Figure 14. Sample Topology for View Types Representation

The following image shows the flow metrics as viewed from a port view type:

Figure 15. Port View Type
Table 6. Port View Type

Port View

Flow Metrics

Port view, where port = fc 1/4

total_read_io_count = 600 (read I/Os of all the initiators that are seen on the port)

The following image shows the flow metrics as viewed from a logical port view type:

Figure 16. Logical Port View Type
Table 7. Logical Port View Type

Logical Port View

Flow Metrics

Logical port, view where port = fc 1/4 and VSAN =1

total_read_io_count = 300 (read I/Os of all the initiators in VSAN 1)

The following image shows the flow metrics as viewed from a scsi_initiator view type:

Figure 17. scsi_initiator View Type
Table 8. scsi_initiator View Type

scsi_initiator View

Flow Metrics

scsi_initiator view, where port = fc 1/1, VSAN = 1, and initiator ID = 1.1.1

scsi_initiator view where port = fc 1/5, VSAN = 1, and initiator ID = 1.1.1

total_read_io_count = 200 (read I/Os of the initiator ID 1.1.1)

scsi_initiator view, where port = fc 1/5, VSAN = 1, and initiator ID = 1.1.2

total_read_io_count = 100 (read I/Os of the initiator ID 1.1.2)

scsi_initiator view, where port = fc 1/5, VSAN = 2, and initiator ID = 1.1.3

total_read_io_count = 300 (read I/Os of the initiator ID 1.1.3)

The following image shows the flow metrics as viewed from a scsi_target view type:

Figure 18. scsi_target View Type
Table 9. scsi_target View Type

scsi_target View

Flow Metrics

scsi_target view, where port = fc 1/6, VSAN = 1, and target ID = 2.2.1

scsi_target view, where port = fc 1/4, VSAN = 1, and target ID = 2.2.1

total_read_io_count = 175 (read I/Os of the target ID 2.2.1)

scsi_target view, where port = fc 1/4, VSAN = 1, and target ID = 2.2.2

total_read_io_count = 125 (read I/Os of the target ID 2.2.2)

scsi_target view, where port = fc 1/4, VSAN = 2, and target ID = 2.2.3

total_read_io_count = 300 (read I/Os of the target ID 2.2.3)

The following image shows the flow metrics as viewed from a scsi_initiator_it_flow view type:

Figure 19. scsi_initiator_it_flow View Type
Table 10. scsi_initiator_it_flow View Type

scsi_initiator_it_flow View

Flow Metrics

scsi_initiator_it_flow view, where port = fc 1/1, VSAN = 1, initiator ID = 1.1.1, and target ID = 2.2.1

scsi_initiator_it_flow view, where port = fc 1/5, VSAN = 1, initiator ID = 1.1.1, and target ID = 2.2.1

total_read_io_count = 125 (read I/Os only between initiator ID 1.1.1 and target ID 2.2.1)

scsi_initiator_it_flow view, where port = fc 1/1, VSAN = 1, initiator ID = 1.1.1, and target ID = 2.2.2

scsi_initiator_it_flow view, where port = fc 1/5, VSAN = 1, initiator ID = 1.1.1, and target ID = 2.2.2

total_read_io_count = 75 (read I/Os only between initiator ID 1.1.1 and target ID 2.2.2)

scsi_initiator_it_flow view, where port = fc 1/5, VSAN = 1, initiator ID = 1.1.2, and target ID = 2.2.1

total_read_io_count = 50 (read I/Os only between initiator ID 1.1.2 and target ID 2.2.1)

scsi_initiator_it_flow view, where port = fc 1/5, VSAN = 1, initiator ID = 1.1.2, and target ID = 2.2.2

total_read_io_count = 50 (read I/Os only between initiator ID 1.1.2 and target ID 2.2.2)

scsi_initiator_it_flow view, where port = fc 1/5, VSAN = 2, initiator ID = 1.1.3, and target ID = 2.2.3

total_read_io_count = 300 (read I/Os only between initiator ID 1.1.3 and target ID 2.2.3)

The following image shows the flow metrics as viewed from a scsi_target_it_flow view type:

Figure 20. scsi_target_it_flow View Type
Table 11. scsi_target_it_flow View Type

scsi_target_it_flow View

Flow Metrics

scsi_target_it_flow view, where port = fc 1/6, VSAN = 1, initiator ID = 1.1.1, and target ID = 2.2.1

scsi_target_it_flow view, where port = fc 1/4, VSAN = 1, initiator ID = 1.1.1, and target ID = 2.2.1

total_read_io_count = 125 (read I/Os only between initiator ID 1.1.1 and target ID 2.2.1)

scsi_target_it_flow view, where port = fc 1/6, VSAN = 1, initiator ID = 1.1.2, and target ID = 2.2.1

scsi_target_it_flow view, where port = fc 1/4, VSAN = 1, initiator ID = 1.1.2, and target ID = 2.2.1

total_read_io_count = 50 (read I/Os only between initiator ID 1.1.2 and target ID 2.2.1)

scsi_target_it_flow view, where port = fc 1/4, VSAN = 1, initiator ID = 1.1.1, and target ID = 2.2.2

total_read_io_count = 75 (read I/Os only between initiator ID 1.1.1 and target ID 2.2.2)

scsi_target_it_flow view, where port = fc 1/4, VSAN = 1, initiator ID = 1.1.2, and target ID = 2.2.2

total_read_io_count = 50 (read I/Os only between initiator ID 1.1.2 and target ID 2.2.2)

scsi_target_it_flow view, where port = fc 1/4, VSAN = 2, initiator ID = 1.1.3, and target ID = 2.2.3

total_read_io_count = 300 (read I/Os only between initiator ID 1.1.3 and target ID 2.2.3)

The following image shows the flow metrics as viewed from a scsi_initiator_itl_flow view type:

Figure 21. scsi_initiator_itl_flow View Type
Table 12. scsi_initiator_itl_flow View Type

scsi_initiator_itl_flow View

Flow Metrics

scsi_initiator_itl_flow view, where port = fc 1/1, VSAN = 1, initiator ID = 1.1.1, target ID = 2.2.1, and LUN ID = 0001

scsi_initiator_itl_flow view, where port = fc 1/5, VSAN = 1, initiator ID = 1.1.1, target ID = 2.2.1, and LUN ID = 0001

total_read_io_count = 125 (read I/Os only between initiator ID 1.1.1, target ID 2.2.1, and LUN ID 0001)

scsi_initiator_itl_flow view, where port = fc 1/1, VSAN = 1, initiator ID = 1.1.1, target ID = 2.2.2, and LUN ID = 0002

scsi_initiator_itl_flow view, where port = fc 1/5, VSAN = 1, initiator ID = 1.1.1, target ID = 2.2.2, and LUN ID = 0002

total_read_io_count = 75 (read I/Os only between initiator ID 1.1.1, target ID 2.2.2, and LUN ID 0002)

scsi_initiator_itl_flow view, where port = fc 1/5, VSAN = 1, initiator ID = 1.1.2, target ID = 2.2.1, and LUN ID = 0001

scsi_initiator_itl_flow view, where port = fc 1/5, VSAN = 1, initiator ID = 1.1.2, target ID = 2.2.2, and LUN ID = 0002

total_read_io_count = 50 (read I/Os only between initiator ID 1.1.2, target ID 2.2.1, and LUN ID 0001 and initiator ID 1.1.2, target ID 2.2.2, and LUN ID 0002)

scsi_initiator_itl_flow view, where port = fc 1/5, VSAN = 2, initiator ID = 1.1.3, target ID = 2.2.3, and LUN ID = 0003

scsi_initiator_itl_flow view, where port = fc 1/5, VSAN = 2, initiator ID = 1.1.3, target ID = 2.2.3, and LUN ID = 0004

total_read_io_count = 150 (read I/Os only between initiator ID 1.1.3, target ID 2.2.3, and LUN ID 0003, and initiator ID 1.1.3, target ID 2.2.3, and LUN ID 0004)

The following image shows the flow metrics as viewed from a scsi_target_itl_flow view type:

Figure 22. scsi_target_itl_flow View Type
Table 13. scsi_target_itl_flow View Type

scsi_target_itl_flow View

Flow Metrics

scsi_target_itl_flow view, where port = fc 1/6, VSAN = 1, initiator ID = 1.1.1, target ID = 2.2.1, and LUN ID = 0001

scsi_target_itl_flow view, where port = fc 1/4, VSAN = 1, initiator ID = 1.1.1, target ID = 2.2.1, and LUN ID = 0001

total_read_io_count = 125 (read I/Os only between initiator ID 1.1.1, target ID 2.2.1, and LUN ID 0001)

scsi_target_itl_flow view, where port = fc 1/6, VSAN = 1, initiator ID = 1.1.2, target ID = 2.2.1, and LUN ID = 0001

scsi_target_itl_flow view, where port = fc 1/4, VSAN = 1, initiator ID = 1.1.2, target ID = 2.2.1, and LUN ID = 0001

total_read_io_count = 50 (read I/Os only between initiator ID 1.1.2, target ID 2.2.1, and LUN ID 0001)

scsi_target_itl_flow view, where port = fc 1/4, VSAN = 1, initiator ID = 1.1.1, target ID = 2.2.2, and LUN ID = 0002

total_read_io_count = 75 (read I/Os only between initiator ID 1.1.1, target ID 2.2.2, and LUN ID 0002)

scsi_target_itl_flow view, where port = fc 1/4, VSAN = 1, initiator ID = 1.1.2, target ID = 2.2.2, and LUN ID = 0002

total_read_io_count = 50 (read I/Os only between initiator ID 1.1.2, target ID 2.2.2, and LUN ID 0002)

scsi_target_itl_flow view, where port = fc 1/4, VSAN = 2, initiator ID = 1.1.3, target ID = 2.2.3, and LUN ID = 0003

scsi_target_itl_flow view, where port = fc 1/4, VSAN = 2, initiator ID = 1.1.3, target ID = 2.2.3, and LUN ID = 0004

total_read_io_count = 150 (read I/Os only between initiator ID 1.1.3, target ID 2.2.3, and LUN ID 0003, and initiator ID 1.1.3, target ID 2.2.3, and LUN ID 0004)

The following image shows the flow metrics as viewed from a scsi_target_tl_flow view type:

Figure 23. scsi_target_tl_flow View Type
Table 14. scsi_target_tl_flow View Type

scsi_target_tl_flow View

Flow Metrics

scsi_target_tl_flow view, where port = fc 1/6, VSAN = 1, target ID = 2.2.1, and LUN ID = 0001

scsi_target_tl_flow view, where port = fc 1/4, VSAN = 1, target ID = 2.2.1, and LUN ID = 0001

total_read_io_count = 175 (read I/Os only between target ID 2.2.1 and LUN ID 0001)

scsi_target_tl_flow view, where port = fc 1/4, VSAN = 1, target ID = 2.2.2, and LUN ID = 0002

total_read_io_count = 125 (read I/Os only between target ID 2.2.2 and LUN ID 0002)

scsi_target_tl_flow view, where port = fc 1/4, VSAN = 2, target ID = 2.2.3, and LUN ID = 0003

scsi_target_tl_flow view, where port = fc 1/4, VSAN = 2, target ID = 2.2.3, and LUN ID = 0004

total_read_io_count = 150 (read I/Os only between target ID 2.2.3 and LUN ID 0003 and target ID 2.2.3 and LUN ID 0004)

The following image shows initiator views where the total_read_io_count is 0.

Figure 24. Initiator Views Where the total_read_io_count is Zero

The following image shows target views where the total_read_io_count is 0.

Figure 25. Target Views Where the total_read_io_count is Zero

Examples: Configuring Query Syntax

The show analytics query 'select all from fc-scsi.scsi_initiator' command provides an output of the flow metrics of all the initiators, as seen in the sample database shown in the following image:

Figure 26. Flow Metrics of all the Initiators

The show analytics query 'select total_read_io_count from fc-scsi.scsi_initiator' command provides an output of a target’s total_read_io_count flow metrics, as seen in the sample database in the following image:

Figure 27. Flow Metrics of a Target's Total Read IO Count

The show analytics query 'select total_read_io_count,total_write_io_count from fc-scsi.scsi_target_it_flow’ command provides an output of an initiator’s and a target’s total_read_io_count and total_write_io_count flow metrics viewed from the target, as seen in the sample database in the following image:

Figure 28. Flow Metrics of an Initiator's and Target's Total Read IO Count and Total Write IO Count

The show analytics query 'select all from fc-scsi.port where port=fc1/1 and vsan=2 limit 1’ command provides an output of a port’s flow metrics that are a part of port fc1/1, VSAN 2, with the number of records is limited to one, as seen in the sample database in the following image:

Figure 29. Flow Metrics of the Port FC 1/1 That Belongs to VSAN 2 With the Number of Records Limited to One

The show analytics query 'select all from fc-scsi.scsi_initiator where port=fc1/1 and vsan=3 sort total_write_io_count’ command provides an output of an initiator’s total_write_io_count flow metrics that are a part of port fc1/1 and VSAN 3, and the output is sorted, as seen in the sample database in the following image:

Figure 30. Flow Metrics of an Initiator's Total Write IO Count That Belongs to Port FC1/1 and VSAN 3 With the Output Sorted

Constructing and Using Queries

Flow metrics are analyzed by using a query_string that is in the form of a query syntax.

Displaying the Installed Push Queries

To display the installed push queries, run this command:

switch# show analytics query { all | name query_name}

Displaying the Results of a Push Query

To display the results of a push query, run this command:

switch# show analytics query name query_name result

Executing a Pull Query

To execute a pull query, run this command:

switch# show analytics query “query_string” [clear] [differential]


Note


Use the "query_string" to specify query semantics, such as select, table, limit, and so on, for example, “select all from fc-scsi.port”.


Configuring a Push Query

To configure a push query, perform these steps:

Procedure


Step 1

Enter global configuration mode:

switch# configure terminal

Step 2

Specify a query string and a timer value for the flow metrics to be displayed at specific intervals:

switch(config)# analytics query “query_string” name query_name type periodic [interval seconds] [clear] [differential]

Only one push query using a "query_string" is allowed at a time. If you try to configure a duplicate push query name, a message is returned stating that the current configuration is a duplicate.

Note


Pull query, push query, and overlay CLI are applicable only on interfaces where the SAN Analytics feature is enabled.


Removing a Configured Push Query

To remove a configured push query, perform these steps:

Procedure


Step 1

Enter global configuration mode:

switch# configure terminal

Step 2

Remove a configured push query:

switch(config)# no analytics name query_name


Clearing Metrics

To reset all the flow metrics for a view instance that match the query string, run this command:

switch# clear analytics query “query_string”


Note


  • The "query_string" must have the format "select all from <view-name>".

  • You can clear the flow metrics without installing a push query.

  • The clear analytics query command is different from the clear option that is used in a push query. The clear analytics query command resets all the metrics that meet the query syntax and the clear option that is used in a push query resets the minimum, maximum, and peak flow metrics.


Purging Views

To delete a specific view instance and its associated metrics, run this command:

switch# purge analytics query “query_string”


Note


  • The "query_string" must have the format "select all from <view-name>".

  • You can clear the flow metrics without installing a push query.

  • The where clause in the purge query can accept only the port key field.


Displaying the Results of a Configured Push Query

The flow metrics that are displayed using the show analytics query name query_name result command are the refreshed metrics at the time interval when this command was executed. For example, if a push query is configured to refresh at an interval of every 30 seconds, and the show analytics query name query_name result command is executed after 35 seconds, the push query displays the flow metrics that were refreshed when the time interval was 30 seconds.

To display the flow metrics of a configured push query, run this command:

switch# show analytics query name query_name result

Example: Constructing and Using Queries


Note


  • The number after “values” in the output indicates the corresponding number of a record.

  • New metrics are added in Cisco MDS NX-OS Release 8.3(1) because of which the query results may vary slightly between Cisco MDS NX-OS Release 8.3(1) and later releases and Cisco MDS NX-OS Release 8.2(1).


This example shows the output of all the flow metrics of the SCSI initiator ITL flow view instance:


switch#  show analytics query 'select all from fc-scsi.scsi_initiator_itl_flow'
{ "values": {
        "1": {
                "port": "fc1/1",
                "vsan": "10",
                "app_id": "255",
                "initiator_id": "0xe80041",
                "target_id": "0xd60200",
                "lun": "0000-0000-0000-0000",
                "active_io_read_count": "0",
                "active_io_write_count": "1",
                "total_read_io_count": "0",
                "total_write_io_count": "1162370362",
                "total_seq_read_io_count": "0",
                "total_seq_write_io_count": "1",
                "total_read_io_time": "0",
                "total_write_io_time": "116204704658",
                "total_read_io_initiation_time": "0",
                "total_write_io_initiation_time": "43996934029",
                "total_read_io_bytes": "0",
                "total_write_io_bytes": "595133625344",
                "total_read_io_inter_gap_time": "0",
                "total_write_io_inter_gap_time": "41139462314556",
                "total_time_metric_based_read_io_count": "0",
                "total_time_metric_based_write_io_count": "1162370358",
                "total_time_metric_based_read_io_bytes": "0",
                "total_time_metric_based_write_io_bytes": "595133623296",
                "read_io_rate": "0",
                "peak_read_io_rate": "0",
                "write_io_rate": "7250",
                "peak_write_io_rate": "7304",
                "read_io_bandwidth": "0",
                "peak_read_io_bandwidth": "0",
                "write_io_bandwidth": "3712384",
                "peak_write_io_bandwidth": "3739904",
                "read_io_size_min": "0",
                "read_io_size_max": "0",
                "write_io_size_min": "512",
                "write_io_size_max": "512",
                "read_io_completion_time_min": "0",
                "read_io_completion_time_max": "0",
                "write_io_completion_time_min": "89",
                "write_io_completion_time_max": "416",
                "read_io_initiation_time_min": "0",
                "read_io_initiation_time_max": "0",
                "write_io_initiation_time_min": "34",
                "write_io_initiation_time_max": "116",
                "read_io_inter_gap_time_min": "0",
                "read_io_inter_gap_time_max": "0",
                "write_io_inter_gap_time_min": "31400",
                "write_io_inter_gap_time_max": "118222",
                "peak_active_io_read_count": "0",
                "peak_active_io_write_count": "5",
                "read_io_aborts": "0",
                "write_io_aborts": "0",
                "read_io_failures": "0",
                "write_io_failures": "0",
                "read_io_scsi_check_condition_count": "0",
                "write_io_scsi_check_condition_count": "0",
                "read_io_scsi_busy_count": "0",
                "write_io_scsi_busy_count": "0",
                "read_io_scsi_reservation_conflict_count": "0",
                "write_io_scsi_reservation_conflict_count": "0",
                "read_io_scsi_queue_full_count": "0",
                "write_io_scsi_queue_full_count": "0",
                "sampling_start_time": "1528535447",
                "sampling_end_time": "1528697457"
        },
       .
       .
       .
        "5": {
                "port": "fc1/8",
                "vsan": "10",
                "app_id": "255",
                "initiator_id": "0xe80001",
                "target_id": "0xe800a1",
                "lun": "0000-0000-0000-0000",
                "active_io_read_count": "0",
                "active_io_write_count": "1",
                "total_read_io_count": "0",
                "total_write_io_count": "1138738309",
                "total_seq_read_io_count": "0",
                "total_seq_write_io_count": "1",
                "total_read_io_time": "0",
                "total_write_io_time": "109792480881",
                "total_read_io_initiation_time": "0",
                "total_write_io_initiation_time": "39239145641",
                "total_read_io_bytes": "0",
                "total_write_io_bytes": "583034014208",
                "total_read_io_inter_gap_time": "0",
                "total_write_io_inter_gap_time": "41479779998852",
                "total_time_metric_based_read_io_count": "0",
                "total_time_metric_based_write_io_count": "1138738307",
                "total_time_metric_based_read_io_bytes": "0",
                "total_time_metric_based_write_io_bytes": "583034013184",
                "read_io_rate": "0",
                "peak_read_io_rate": "0",
                "write_io_rate": "7074",
                "peak_write_io_rate": "7903",
                "read_io_bandwidth": "0",
                "peak_read_io_bandwidth": "0",
                "write_io_bandwidth": "3622144",
                "peak_write_io_bandwidth": "4046336",
                "read_io_size_min": "0",
                "read_io_size_max": "0",
                "write_io_size_min": "512",
                "write_io_size_max": "512",
                "read_io_completion_time_min": "0",
                "read_io_completion_time_max": "0",
                "write_io_completion_time_min": "71",
                "write_io_completion_time_max": "3352",
                "read_io_initiation_time_min": "0",
                "read_io_initiation_time_max": "0",
                "write_io_initiation_time_min": "26",
                "write_io_initiation_time_max": "2427",
                "read_io_inter_gap_time_min": "0",
                "read_io_inter_gap_time_max": "0",
                "write_io_inter_gap_time_min": "25988",
                "write_io_inter_gap_time_max": "868452",
                "peak_active_io_read_count": "0",
                "peak_active_io_write_count": "5",
                "read_io_aborts": "0",
                "write_io_aborts": "0",
                "read_io_failures": "0",
                "write_io_failures": "0",
                "read_io_scsi_check_condition_count": "0",
                "write_io_scsi_check_condition_count": "0",
                "read_io_scsi_busy_count": "0",
                "write_io_scsi_busy_count": "0",
                "read_io_scsi_reservation_conflict_count": "0",
                "write_io_scsi_reservation_conflict_count": "0",
                "read_io_scsi_queue_full_count": "0",
                "write_io_scsi_queue_full_count": "0",
                "sampling_start_time": "1528535447",
                "sampling_end_time": "1528697457"
        }
}}

This example shows the output of all the flow metrics of the NVMe initiator ITN flow view instance:


switch# show analytics query 'select all from fc-nvme.nvme_initiator_itn_flow'
{ "values": {
        "1": {
                "port": "fc1/9",
                "vsan": "5",
                "app_id": "255",
                "initiator_id": "0xa40160",
                "target_id": "0xa4018c",
                "connection_id": "0000-0000-0000-0000",
                "namespace_id": "1",
                "active_io_read_count": "0",
                "active_io_write_count": "0",
                "total_read_io_count": "414106348",
                "total_write_io_count": "0",
                "total_seq_read_io_count": "0",
                "total_seq_write_io_count": "0",
                "total_read_io_time": "204490863437",
                "total_write_io_time": "0",
                "total_read_io_initiation_time": "132775579977",
                "total_write_io_initiation_time": "0",
                "total_read_io_bytes": "16226866588672",
                "total_write_io_bytes": "0",
                "total_read_io_inter_gap_time": "19198018763772",
                "total_write_io_inter_gap_time": "0",
                "total_time_metric_based_read_io_count": "414106244",
                "total_time_metric_based_write_io_count": "0",
                "total_time_metric_based_read_io_bytes": "16226860198912",
                "total_time_metric_based_write_io_bytes": "0",
                "read_io_rate": "0",
                "peak_read_io_rate": "16826",
                "write_io_rate": "0",
                "peak_write_io_rate": "0",
                "read_io_bandwidth": "0",
                "peak_read_io_bandwidth": "656438400",
                "write_io_bandwidth": "0",
                "peak_write_io_bandwidth": "0",
                "read_io_size_min": "1024",
                "read_io_size_max": "262144",
                "write_io_size_min": "0",
                "write_io_size_max": "0",
                "read_io_completion_time_min": "16",
                "read_io_completion_time_max": "7057",
                "write_io_completion_time_min": "0",
                "write_io_completion_time_max": "0",
                "read_io_initiation_time_min": "16",
                "read_io_initiation_time_max": "5338",
                "write_io_initiation_time_min": "0",
                "write_io_initiation_time_max": "0",
                "read_io_inter_gap_time_min": "32",
                "read_io_inter_gap_time_max": "83725169",
                "write_io_inter_gap_time_min": "0",
                "write_io_inter_gap_time_max": "0",
                "peak_active_io_read_count": "11",
                "peak_active_io_write_count": "0",
                "read_io_aborts": "24",
                "write_io_aborts": "0",
                "read_io_failures": "80",
                "write_io_failures": "0",
                "read_io_timeouts": "0",
                "write_io_timeouts": "0",
                "read_io_nvme_lba_out_of_range_count": "0",
                "write_io_nvme_lba_out_of_range_count": "0",
                "read_io_nvme_ns_not_ready_count": "0",
                "write_io_nvme_ns_not_ready_count": "0",
                "read_io_nvme_reservation_conflict_count": "0",
                "write_io_nvme_reservation_conflict_count": "0",
                "read_io_nvme_capacity_exceeded_count": "0",
                "write_io_nvme_capacity_exceeded_count": "0",
                "sampling_start_time": "1512847422",
                "sampling_end_time": "1513166516"
        },
       .
       .
       .
        "5": {
                "port": "fc1/9",
                "vsan": "5",
                "app_id": "255",
                "initiator_id": "0xa40165",
                "target_id": "0xa40190",
                "connection_id": "0000-0000-0000-0000",
                "namespace_id": "1",
                "active_io_read_count": "0",
                "active_io_write_count": "0",
                "total_read_io_count": "33391955",
                "total_write_io_count": "643169087",
                "total_seq_read_io_count": "0",
                "total_seq_write_io_count": "0",
                "total_read_io_time": "13005795783",
                "total_write_io_time": "131521212441",
                "total_read_io_initiation_time": "5696099596",
                "total_write_io_initiation_time": "71938348902",
                "total_read_io_bytes": "1309083368448",
                "total_write_io_bytes": "329302572544",
                "total_read_io_inter_gap_time": "19175084866843",
                "total_write_io_inter_gap_time": "19182318062480",
                "total_time_metric_based_read_io_count": "33391919",
                "total_time_metric_based_write_io_count": "643168808",
                "total_time_metric_based_read_io_bytes": "1309074355200",
                "total_time_metric_based_write_io_bytes": "329302429696",
                "read_io_rate": "0",
                "peak_read_io_rate": "574",
                "write_io_rate": "0",
                "peak_write_io_rate": "9344",
                "read_io_bandwidth": "0",
                "peak_read_io_bandwidth": "19122176",
                "write_io_bandwidth": "0",
                "peak_write_io_bandwidth": "4784384",
                "read_io_size_min": "1024",
                "read_io_size_max": "262144",
                "write_io_size_min": "512",
                "write_io_size_max": "512",
                "read_io_completion_time_min": "16",
                "read_io_completion_time_max": "5123",
                "write_io_completion_time_min": "27",
                "write_io_completion_time_max": "2254",
                "read_io_initiation_time_min": "16",
                "read_io_initiation_time_max": "3650",
                "write_io_initiation_time_min": "12",
                "write_io_initiation_time_max": "1377",
                "read_io_inter_gap_time_min": "32",
                "read_io_inter_gap_time_max": "3234375975",
                "write_io_inter_gap_time_min": "32",
                "write_io_inter_gap_time_max": "38886219",
                "peak_active_io_read_count": "6",
                "peak_active_io_write_count": "16",
                "read_io_aborts": "6",
                "write_io_aborts": "18",
                "read_io_failures": "30",
                "write_io_failures": "261",
                "read_io_timeouts": "0",
                "write_io_timeouts": "0",
                "read_io_nvme_lba_out_of_range_count": "0",
                "write_io_nvme_lba_out_of_range_count": "0",
                "read_io_nvme_ns_not_ready_count": "0",
                "write_io_nvme_ns_not_ready_count": "0",
                "read_io_nvme_reservation_conflict_count": "0",
                "write_io_nvme_reservation_conflict_count": "0",
                "read_io_nvme_capacity_exceeded_count": "0",
                "write_io_nvme_capacity_exceeded_count": "0",
                "sampling_start_time": "1512847422",
                "sampling_end_time": "1513166516"
        }
}}


This example shows the output of specific flow metrics for a specific initiator ID of an initiator ITL flow view instance:


switch#   show analytics query 'select port,initiator_id,target_id,lun,total_read_io_count,total_write_io_count,read_io_rate,write_io_rate from fc-scsi.scsi_initiator_itl_flow where initiator_id=0xe80001'
{ "values": {
        "1": {
                "port": "fc1/8",
                "initiator_id": "0xe80001",
                "target_id": "0xe800a1",
                "lun": "0000-0000-0000-0000",
                "total_read_io_count": "0",
                "total_write_io_count": "1139010960",
                "read_io_rate": "0",
                "write_io_rate": "7071",
                "sampling_start_time": "1528535447",
                "sampling_end_time": "1528697495"
        }
}}

This example shows the output of specific flow metrics for a specific initiator ID and LUN of an initiator ITL flow view instance:


switch#   show analytics query 'select port,initiator_id,target_id,lun,total_read_io_count,total_write_io_count,read_io_rate,write_io_rate from fc-scsi.scsi_initiator_itl_flow where initiator_id=0xe80001 and lun=0000-0000-0000-0000'
{ "values": {
        "1": {
                "port": "fc1/8",
                "initiator_id": "0xe80001",
                "target_id": "0xe800a1",
                "lun": "0000-0000-0000-0000",
                "total_read_io_count": "0",
                "total_write_io_count": "1139453979",
                "read_io_rate": "0",
                "write_io_rate": "7070",
                "sampling_start_time": "1528535447",
                "sampling_end_time": "1528697559"
        }
}}

This example shows the output of specific flow metrics for a specific LUN, with the output sorted for the write_io_rate metrics of a target ITL flow view instance:


switch#   show analytics query 'select port,initiator_id,target_id,lun,total_read_io_count,total_write_io_count,read_io_rate,write_io_rate from fc-scsi.scsi_target_itl_flow where lun=0000-0000-0000-0000 sort write_io_rate'
{ "values": {
        "1": {
                "port": "fc1/6",
                "initiator_id": "0xe80020",
                "target_id": "0xd60040",
                "lun": "0000-0000-0000-0000",
                "total_read_io_count": "0",
                "total_write_io_count": "1103394068",
                "read_io_rate": "0",
                "write_io_rate": "6882",
                "sampling_start_time": "1528535447",
                "sampling_end_time": "1528697630"
        },
        "2": {
                "port": "fc1/6",
                "initiator_id": "0xe80021",
                "target_id": "0xe80056",
                "lun": "0000-0000-0000-0000",
                "total_read_io_count": "0",
                "total_write_io_count": "1119199742",
                "read_io_rate": "0",
                "write_io_rate": "6946",
                "sampling_start_time": "1528535447",
                "sampling_end_time": "1528697630"
        },
        "3": {
                "port": "fc1/8",
                "initiator_id": "0xe80000",
                "target_id": "0xe80042",
                "lun": "0000-0000-0000-0000",
                "total_read_io_count": "0",
                "total_write_io_count": "1119506589",
                "read_io_rate": "0",
                "write_io_rate": "6948",
                "sampling_start_time": "1528535447",
                "sampling_end_time": "1528697630"
        },
        "4": {
                "port": "fc1/8",
                "initiator_id": "0xe80001",
                "target_id": "0xe800a1",
                "lun": "0000-0000-0000-0000",
                "total_read_io_count": "0",
                "total_write_io_count": "1139953183",
                "read_io_rate": "0",
                "write_io_rate": "7068",
                "sampling_start_time": "1528535447",
                "sampling_end_time": "1528697630"
        },
        "5": {
                "port": "fc1/1",
                "initiator_id": "0xe80041",
                "target_id": "0xd60200",
                "lun": "0000-0000-0000-0000",
                "total_read_io_count": "0",
                "total_write_io_count": "1163615698",
                "read_io_rate": "0",
                "write_io_rate": "7247",
                "sampling_start_time": "1528535447",
                "sampling_end_time": "1528697630"
        }
}}

This example shows the output of specific flow metrics for a specific LUN, with the output limited to three records and sorted for the write_io_rate metrics of an initiator ITL flow view instance:


switch#   show analytics query 'select port,initiator_id,target_id,lun,total_read_io_count,total_write_io_count,read_io_rate,write_io_rate from fc-scsi.scsi_initiator_itl_flow where lun=0000-0000-0000-0000 sort write_io_rate limit 3'
{ "values": {
        "1": {
                "port": "fc1/6",
                "initiator_id": "0xe80020",
                "target_id": "0xd60040",
                "lun": "0000-0000-0000-0000",
                "total_read_io_count": "0",
                "total_write_io_count": "1103901828",
                "read_io_rate": "0",
                "write_io_rate": "6885",
                "sampling_start_time": "1528535447",
                "sampling_end_time": "1528697704"
        },
        "2": {
                "port": "fc1/8",
                "initiator_id": "0xe80000",
                "target_id": "0xe80042",
                "lun": "0000-0000-0000-0000",
                "total_read_io_count": "0",
                "total_write_io_count": "1120018575",
                "read_io_rate": "0",
                "write_io_rate": "6940",
                "sampling_start_time": "1528535447",
                "sampling_end_time": "1528697704"
        },
        "3": {
                "port": "fc1/6",
                "initiator_id": "0xe80021",
                "target_id": "0xe80056",
                "lun": "0000-0000-0000-0000",
                "total_read_io_count": "0",
                "total_write_io_count": "1119711583",
                "read_io_rate": "0",
                "write_io_rate": "6942",
                "sampling_start_time": "1528535447",
                "sampling_end_time": "1528697704"
        }
}}

This example shows the output of specific flow metrics for a specific LUN and target ID of an initiator ITL flow view instance:


switch#   show analytics query 'select port,initiator_id,target_id,lun,total_read_io_count,total_write_io_count,read_io_rate,write_io_rate from fc-scsi.scsi_initiator_itl_flow where lun=0000-0000-0000-0000 and target_id=0xe800a1'
{ "values": {
        "1": {
                "port": "fc1/8",
                "initiator_id": "0xe80001",
                "target_id": "0xe800a1",
                "lun": "0000-0000-0000-0000",
                "total_read_io_count": "0",
                "total_write_io_count": "1139010960",
                "read_io_rate": "0",
                "write_io_rate": "7071"
                "sampling_start_time": "1528535447",
                "sampling_end_time": "1528697495"
        }
}}

This example shows the output of specific flow metrics for VMID 4 and initiator ID 0x0900e0 for initiator ITL flow view instance:


switch#   show analytics query "select port,vsan,initiator_id,vmid from fc-scsi.scsi_initiator_itl_flow where initiator_id=0x0900e0 and vmid=4"
{ "values": {
        "1": {
                "port": "fc2/9",
                "vsan": "1",
                "initiator_id": "0x0900e0",
                "vmid": "4",
                "sampling_start_time": "1589269530",
        }
}}

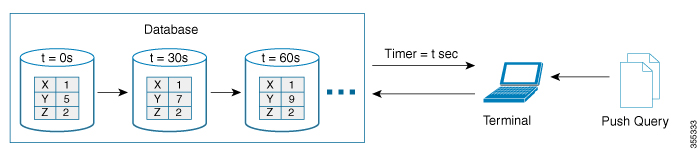
This example shows how to configure a push query when the duration to refresh the flow metrics is set to the default duration of 30 seconds:


switch# configure terminal
switch(config)# analytics query 'select all from fc-scsi.scsi_initiator_itl_flow' name initiator_itl_flow type periodic
switch(config)# show analytics query name initiator_itl_flow result 
{ "values": {
        "1": {
                "port": "fc1/1",
                "vsan": "10",
                "app_id": "255",
                "initiator_id": "0xe80041",
                "target_id": "0xd60200",
                "lun": "0000-0000-0000-0000",
                "active_io_read_count": "0",
                "active_io_write_count": "1",
                "total_read_io_count": "0",
                "total_write_io_count": "1162370362",
                "total_seq_read_io_count": "0",
                "total_seq_write_io_count": "1",
                "total_read_io_time": "0",
                "total_write_io_time": "116204704658",
                "total_read_io_initiation_time": "0",
                "total_write_io_initiation_time": "43996934029",
                "total_read_io_bytes": "0",
                "total_write_io_bytes": "595133625344",
                "total_read_io_inter_gap_time": "0",
                "total_write_io_inter_gap_time": "41139462314556",
                "total_time_metric_based_read_io_count": "0",
                "total_time_metric_based_write_io_count": "1162370358",
                "total_time_metric_based_read_io_bytes": "0",
                "total_time_metric_based_write_io_bytes": "595133623296",
                "read_io_rate": "0",
                "peak_read_io_rate": "0",
                "write_io_rate": "7250",
                "peak_write_io_rate": "7304",
                "read_io_bandwidth": "0",
                "peak_read_io_bandwidth": "0",
                "write_io_bandwidth": "3712384",
                "peak_write_io_bandwidth": "3739904",
                "read_io_size_min": "0",
                "read_io_size_max": "0",
                "write_io_size_min": "512",
                "write_io_size_max": "512",
                "read_io_completion_time_min": "0",
                "read_io_completion_time_max": "0",
                "write_io_completion_time_min": "89",
                "write_io_completion_time_max": "416",
                "read_io_initiation_time_min": "0",
                "read_io_initiation_time_max": "0",
                "write_io_initiation_time_min": "34",
                "write_io_initiation_time_max": "116",
                "read_io_inter_gap_time_min": "0",
                "read_io_inter_gap_time_max": "0",
                "write_io_inter_gap_time_min": "31400",
                "write_io_inter_gap_time_max": "118222",
                "peak_active_io_read_count": "0",
                "peak_active_io_write_count": "5",
                "read_io_aborts": "0",
                "write_io_aborts": "0",
                "read_io_failures": "0",
                "write_io_failures": "0",
                "read_io_scsi_check_condition_count": "0",
                "write_io_scsi_check_condition_count": "0",
                "read_io_scsi_busy_count": "0",
                "write_io_scsi_busy_count": "0",
                "read_io_scsi_reservation_conflict_count": "0",
                "write_io_scsi_reservation_conflict_count": "0",
                "read_io_scsi_queue_full_count": "0",
                "write_io_scsi_queue_full_count": "0",
                "sampling_start_time": "1528535447",
                "sampling_end_time": "1528697457"
        },
        .
        .
        .
        "5": {
                "port": "fc1/8",
                "vsan": "10",
                "app_id": "255",
                "initiator_id": "0xe80001",
                "target_id": "0xe800a1",
                "lun": "0000-0000-0000-0000",
                "active_io_read_count": "0",
                "active_io_write_count": "1",
                "total_read_io_count": "0",
                "total_write_io_count": "1138738309",
                "total_seq_read_io_count": "0",
                "total_seq_write_io_count": "1",
                "total_read_io_time": "0",
                "total_write_io_time": "109792480881",
                "total_read_io_initiation_time": "0",
                "total_write_io_initiation_time": "39239145641",
                "total_read_io_bytes": "0",
                "total_write_io_bytes": "583034014208",
                "total_read_io_inter_gap_time": "0",
                "total_write_io_inter_gap_time": "41479779998852",
                "total_time_metric_based_read_io_count": "0",
                "total_time_metric_based_write_io_count": "1138738307",
                "total_time_metric_based_read_io_bytes": "0",
                "total_time_metric_based_write_io_bytes": "583034013184",
                "read_io_rate": "0",
                "peak_read_io_rate": "0",
                "write_io_rate": "7074",
                "peak_write_io_rate": "7903",
                "read_io_bandwidth": "0",
                "peak_read_io_bandwidth": "0",
                "write_io_bandwidth": "3622144",
                "peak_write_io_bandwidth": "4046336",
                "read_io_size_min": "0",
                "read_io_size_max": "0",
                "write_io_size_min": "512",
                "write_io_size_max": "512",
                "read_io_completion_time_min": "0",
                "read_io_completion_time_max": "0",
                "write_io_completion_time_min": "71",
                "write_io_completion_time_max": "3352",
                "read_io_initiation_time_min": "0",
                "read_io_initiation_time_max": "0",
                "write_io_initiation_time_min": "26",
                "write_io_initiation_time_max": "2427",
                "read_io_inter_gap_time_min": "0",
                "read_io_inter_gap_time_max": "0",
                "write_io_inter_gap_time_min": "25988",
                "write_io_inter_gap_time_max": "868452",
                "peak_active_io_read_count": "0",
                "peak_active_io_write_count": "5",
                "read_io_aborts": "0",
                "write_io_aborts": "0",
                "read_io_failures": "0",
                "write_io_failures": "0",
                "read_io_scsi_check_condition_count": "0",
                "write_io_scsi_check_condition_count": "0",
                "read_io_scsi_busy_count": "0",
                "write_io_scsi_busy_count": "0",
                "read_io_scsi_reservation_conflict_count": "0",
                "write_io_scsi_reservation_conflict_count": "0",
                "read_io_scsi_queue_full_count": "0",
                "write_io_scsi_queue_full_count": "0",
                "sampling_start_time": "1528535447",
                "sampling_end_time": "1528697457"
        }
}}

These examples show how to clear all the minimum, maximum, and peak flow metrics:

  • This example shows the output before clearing all the minimum, maximum, and peak flow metrics:

    
    switch# show analytics query "select all from  fc-scsi.scsi_target_itl_flow where port=fc1/17" clear
    { "values": {
            "1": {
                    "port": "fc1/17",
                    "vsan": "1",
                    "app_id": "255",
                    "target_id": "0xef0040",
                    "initiator_id": "0xef0000",
                    "lun": "0000-0000-0000-0000",
                    "active_io_read_count": "0",
                    "active_io_write_count": "1",
                    "total_read_io_count": "0",
                    "total_write_io_count": "84701",
                    "total_seq_read_io_count": "0",
                    "total_seq_write_io_count": "1",
                    "total_read_io_time": "0",
                    "total_write_io_time": "7007132",
                    "total_read_io_initiation_time": "0",
                    "total_write_io_initiation_time": "2421756",
                    "total_read_io_bytes": "0",
                    "total_write_io_bytes": "86733824",
                    "total_read_io_inter_gap_time": "0",
                    "total_write_io_inter_gap_time": "2508109021",
                    "total_time_metric_based_read_io_count": "0",
                    "total_time_metric_based_write_io_count": "84701",
                    "total_time_metric_based_read_io_bytes": "0",
                    "total_time_metric_based_write_io_bytes": "86733824",
                    "read_io_rate": "0",
                    "peak_read_io_rate": "0",
                    "write_io_rate": "8711",
                    "peak_write_io_rate": "8711",
                    "read_io_bandwidth": "0",
                    "peak_read_io_bandwidth": "0",
                    "write_io_bandwidth": "8920576",
                    "peak_write_io_bandwidth": "8920576",
                    "read_io_size_min": "0",
                    "read_io_size_max": "0",
                    "write_io_size_min": "1024",
                    "write_io_size_max": "1024",
                    "read_io_completion_time_min": "0",
                    "read_io_completion_time_max": "0",
                    "write_io_completion_time_min": "74",
                    "write_io_completion_time_max": "844",
                    "read_io_initiation_time_min": "0",
                    "read_io_initiation_time_max": "0",
                    "write_io_initiation_time_min": "24",
                    "write_io_initiation_time_max": "775",
                    "read_io_inter_gap_time_min": "0",
                    "read_io_inter_gap_time_max": "0",
                    "write_io_inter_gap_time_min": "26903",
                    "write_io_inter_gap_time_max": "287888",
                    "peak_active_io_read_count": "0",
                    "peak_active_io_write_count": "3",
                    "read_io_aborts": "0",
                    "write_io_aborts": "0",
                    "read_io_failures": "0",
                    "write_io_failures": "0",
                    "read_io_scsi_check_condition_count": "0",
                    "write_io_scsi_check_condition_count": "0",
                    "read_io_scsi_busy_count": "0",
                    "write_io_scsi_busy_count": "0",
                    "read_io_scsi_reservation_conflict_count": "0",
                    "write_io_scsi_reservation_conflict_count": "0",
                    "read_io_scsi_queue_full_count": "0",
                    "write_io_scsi_queue_full_count": "0",
                    "sampling_start_time": "1530683133",
                    "sampling_end_time": "1530684301"
            },
    }}


    Note


    The show analytics query "query_string" clear command is a clear-on-push or clear-on-pull command. Therefore, this command is not applicable when this command is executed for the first time.


  • This example shows the output after clearing all the minimum, maximum, and peak flow metrics. The metrics that were cleared are highlighted in the output.

    
    switch# show analytics query "select all from  fc-scsi.scsi_target_itl_flow where port=fc1/17" clear
    { "values": {
            "1": {
                    "port": "fc1/17",
                   "vsan": "1",
                    "app_id": "255",
                    "target_id": "0xef0040",
                    "initiator_id": "0xef0000",
                    "lun": "0000-0000-0000-0000",
                    "active_io_read_count": "0",
                    "active_io_write_count": "0",
                    "total_read_io_count": "0",
                    "total_write_io_count": "800615",
                    "total_seq_read_io_count": "0",
                    "total_seq_write_io_count": "1",
                    "total_read_io_time": "0",
                    "total_write_io_time": "66090290",
                    "total_read_io_initiation_time": "0",
                    "total_write_io_initiation_time": "22793874",
                    "total_read_io_bytes": "0",
                    "total_write_io_bytes": "819829760",
                    "total_read_io_inter_gap_time": "0",
                    "total_write_io_inter_gap_time": "23702347887",
                    "total_time_metric_based_read_io_count": "0",
                    "total_time_metric_based_write_io_count": "800615",
                    "total_time_metric_based_read_io_bytes": "0",
                    "total_time_metric_based_write_io_bytes": "819829760",
                    "read_io_rate": "0",
                    "peak_read_io_rate": "0",
                    "write_io_rate": "0",
                    "peak_write_io_rate": "0",
                    "read_io_bandwidth": "0",
                    "peak_read_io_bandwidth": "0",
                    "write_io_bandwidth": "0",
                    "peak_write_io_bandwidth": "0",
                    "read_io_size_min": "0",
                    "read_io_size_max": "0",
                    "write_io_size_min": "0",
                    "write_io_size_max": "0",
                    "read_io_completion_time_min": "0",
                    "read_io_completion_time_max": "0",
                    "write_io_completion_time_min": "0",
                    "write_io_completion_time_max": "0",
                    "read_io_initiation_time_min": "0",
                    "read_io_initiation_time_max": "0",
                    "write_io_initiation_time_min": "0",
                    "write_io_initiation_time_max": "0",
                    "read_io_inter_gap_time_min": "0",
                    "read_io_inter_gap_time_max": "0",
                    "write_io_inter_gap_time_min": "0",
                    "write_io_inter_gap_time_max": "0",
                    "peak_active_io_read_count": "0",
                    "peak_active_io_write_count": "0",
                    "read_io_aborts": "0",
                    "write_io_aborts": "0",
                    "read_io_failures": "0",
                    "write_io_failures": "0",
                    "read_io_scsi_check_condition_count": "0",
                    "write_io_scsi_check_condition_count": "0",
                    "read_io_scsi_busy_count": "0",
                    "write_io_scsi_busy_count": "0",
                    "read_io_scsi_reservation_conflict_count": "0",
                    "write_io_scsi_reservation_conflict_count": "0",
                    "read_io_scsi_queue_full_count": "0",
                    "write_io_scsi_queue_full_count": "0",
                    "sampling_start_time": "1530683133",
                    "sampling_end_time": "1530684428"
            },
    }}


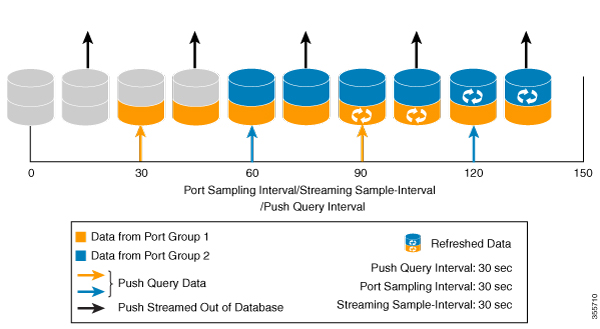
These examples show how to stream only the ITL flow metrics that have changed between streaming-sample intervals:

  • This example shows the output before using the differential option:

    
    switch# show analytics query "select port, target_id, initiator_id,lun,total_write_io_count from fc-scsi.scsi_target_itl_flow where port=fc1/17" differential 
    { "values": {
            "1": {
                    "port": "fc1/17",
                    "target_id": "0xef0040",
                    "initiator_id": "0xef0000",
                    "lun": "0001-0000-0000-0000",
                    "total_write_io_count": "1515601",
                    "sampling_start_time": "1530683133",
                    "sampling_end_time": "1530683484"
            },
            "2": {
                    "port": "fc1/17",
                    "target_id": "0xef0040",
                    "initiator_id": "0xef0020",
                    "lun": "0000-0000-0000-0000",
                    "total_write_io_count": "1515601",
                    "sampling_start_time": "1530683133",
                    "sampling_end_time": "1530683484"
            },
            "3": {
                    "port": "fc1/17",
                    "target_id": "0xef0040",
                    "initiator_id": "0xef0020",
                    "lun": "0001-0000-0000-0000",
                    "total_write_io_count": "1515600",
                    "sampling_start_time": "1530683133",
                    "sampling_end_time": "1530683484"
            },
            "4": {
                    "port": "fc1/17",
                    "target_id": "0xef0040",
                    "initiator_id": "0xef0000",
                    "lun": "0000-0000-0000-0000",
                    "total_write_io_count": "1515600",
                    "sampling_start_time": "1530683133",
                    "sampling_end_time": "1530683484"
            }
    }}
    
    
  • This example shows the output with the differential option and only the records that have changed:

    
    switch# show analytics query "select port, target_id, initiator_id,lun,total_write_io_count from fc-scsi.scsi_target_itl_flow where port=fc1/17" differential 
    { "values": {
           "1": {
                    "port": "fc1/17",
                    "target_id": "0xef0040",
                    "initiator_id": "0xef0000",
                    "lun": "0001-0000-0000-0000",
                    "total_write_io_count": "1892021",
                    "sampling_start_time": "1530683133",
                    "sampling_end_time": "1530683534"
            },
            "2": {
                    "port": "fc1/17",
                    "target_id": "0xef0040",
                    "initiator_id": "0xef0020",
                    "lun": "0000-0000-0000-0000",
                    "total_write_io_count": "1892021",
                    "sampling_start_time": "1530683133",
                    "sampling_end_time": "1530683534"
            },
            "3": {
                    "port": "fc1/17",
                    "target_id": "0xef0040",
                    "initiator_id": "0xef0000",
                    "lun": "0000-0000-0000-0000",
                    "total_write_io_count": "1892021",
                    "sampling_start_time": "1530683133",
                    "sampling_end_time": "1530683534"
            }
    }}


This example shows how to remove an installed query name:


switch(config)# no analytics name initiator_itl_flow

The following example show how to clear the flow metrics:

  1. This example show the output before clearing the flow metrics:

    
    switch# show analytics query "select port,target_id,total_write_io_count,
    total_write_io_bytes,total_time_metric_based_write_io_count,write_io_rate,
    peak_write_io_rate,write_io_bandwidth,peak_write_io_bandwidth,
    write_io_size_min,write_io_size_max,write_io_completion_time_min,
    write_io_completion_time_max,write_io_initiation_time_min,
    write_io_initiation_time_max,write_io_inter_gap_time_min,write_io_inter_gap_time_max 
    from fc-scsi.scsi_target where 
    target_id=0x650060" 
    { "values": {
            "1": {
                    "port": "fc3/17",
                    "target_id": "0x650060",
                    "total_write_io_count": "67350021",
                    "total_write_io_bytes": "17655403905024",
                    "total_time_metric_based_write_io_count": "67349761",
                    "write_io_rate": "0",
                    "peak_write_io_rate": "6300",
                    "write_io_bandwidth": "0",
                    "peak_write_io_bandwidth": "1651572736",
                    "write_io_size_min": "262144",
                    "write_io_size_max": "262144",
                    "write_io_completion_time_min": "192",
                    "write_io_completion_time_max": "9434",
                    "write_io_initiation_time_min": "21",
                    "write_io_initiation_time_max": "199",
                    "write_io_inter_gap_time_min": "2553",
                    "write_io_inter_gap_time_max": "358500",
                    "sampling_start_time": "1531204359",
                    "sampling_end_time": "1531215327"
            }
    
    
  2. This example shows how to clear the flow metrics:


    Note


    Clearing metrics is allowed only on view instances and not on individual flow metrics.


    switch# clear analytics query "select all from fc-scsi.scsi_target where target_id=0x650060"
    
  3. This example shows the output after clearing the flow metrics:

    
    switch# show analytics query "select port,target_id,total_write_io_count,
    total_write_io_bytes,total_time_metric_based_write_io_count,write_io_rate,
    peak_write_io_rate,write_io_bandwidth,peak_write_io_bandwidth,
    write_io_size_min,write_io_size_max,write_io_completion_time_min,
    write_io_completion_time_max,write_io_initiation_time_min,
    write_io_initiation_time_max,write_io_inter_gap_time_min,write_io_inter_gap_time_max 
    from fc-scsi.scsi_target where target_id=0x650060" 
    { "values": {
            "1": {
                    "port": "fc3/17",
                    "target_id": "0x650060",
                    "total_write_io_count": "0",
                    "total_write_io_bytes": "0",
                    "total_time_metric_based_write_io_count": "0",
                    "write_io_rate": "0",
                    "peak_write_io_rate": "0",
                    "write_io_bandwidth": "0",
                    "peak_write_io_bandwidth": "0",
                    "write_io_size_min": "0",
                    "write_io_size_max": "0",
                    "write_io_completion_time_min": "0",
                    "write_io_completion_time_max": "0",
                    "write_io_initiation_time_min": "0",
                    "write_io_initiation_time_max": "0",
                    "write_io_inter_gap_time_min": "0",
                    "write_io_inter_gap_time_max": "0",
                    "sampling_start_time": "1531204359",
                    "sampling_end_time": "1531215464"
            }


This example shows the output after purging the flow metrics:


Note


Only the port key value is allowed with the where clause for purging metrics.


switch# purge analytics query "select all from fc-scsi.scsi_target where port=fc3/17"
switch# show analytics query "select all from fc-scsi.scsi_target where port=fc3/17"
Table is empty for query "select all from fc-scsi.scsi_target where port=fc3/17"

Using the ShowAnalytics Overlay CLI

The ShowAnalytics overlay CLI is used to interpret the analytics data that is in JSON format in a user-friendly tabular format. The ShowAnalytics overlay CLI has a "Linux like" syntax and uses the inbuilt NX-OS Python interpreter to execute a script to convert the JSON output of the pull query into a tabular format. Currently, only a small subset of the flow metrics is displayed.


Note


  • To execute Overlay CLIs, you must login as network-admin.

  • The ShowAnalytics overlay command displays cumulative data about the Exchange Completion Time (ECT) for the --initiator-itl and --target-itl options under the --info option. However, it displays instantaneous data for rate and bandwidth metrics.

  • If the active ITL count exceeds the documented limit, the ShowAnalytics overlay command displays a warning and exits. For information on the ITL count limit, see the Cisco MDS NX-OS Configuration Limits, Release 8.x document.

  • If you configure a push query with the clear keyword as recommended by Virtual Instruments or Cisco DCNM, the minimum and maximum flow metrics will not have accurate values.

  • The options under the ShowAnalytics command support only the SCSI analytics type, except the --evaluate-npuload option that supports both SCSI and NVMe analytics types.

  • Run the --evaluate-npuload option before configuring the analytics type on interfaces. The --evaluate-npuload option does not work on a module even if one of the interface on the module is configured with an analytic type.

  • The --outstanding-io option works only on F ports.


To display the analytics information in a tabular format, run this command:

switch# ShowAnalytics –help .

For more information, see the Cisco MDS 9000 Series Command Reference, Release 8.x.

Examples: Using the ShowAnalytics Overlay CLI

This example shows the options under the overlay CLI:


Note


The option to display the available keywords and variables under the overlay CLI and its options that are added from Cisco MDS NX-OS Release 8.4(2) and later.


switch# ShowAnalytics ?
  ShowAnalytics              Aliased to 'source sys/analytics.py'
  ShowAnalyticsConsistency   Aliased to 'source sys/analytics_pss_consistency_checker.py'
  --errors                   To display errors stats in all IT(L/N) pairs
  --errorsonly               To display IT(L/N) flows with errors
  --evaluate-npuload         To evaluate npuload on system
  --help                     To display help and exit
  --info                     To display information about IT(L/N) flows
  --minmax                   To display min max and peak info about IT(L/N) flows
  --outstanding-io           To display outstanding io for an interface
  --top                      To display top 10 IT(L/N) Flow
  --version                  To display version of utility and exit
  --vsan-thput               To display per vsan throughput for interface

This example shows how to display the overlay CLI version:


switch# ShowAnalytics --version
ShowAnalytics 4.0.0  

This example shows how to display the flow metrics of an initiator ITL:


switch# ShowAnalytics --info --initiator-itl
2021-02-09 09:01:39.714290

Interface fc3/1
+-----------------------------------------------------------------------------------------------------------------------------------
| VSAN |Initiator|VMID| Target |       LUN         |Avg IOPS| Avg Throughput  |  Avg ECT   |Avg Data Access Latency|  Avg IO Size  |
+-----------------------------------------------------------------------------------------------------------------------------------
|                                                  |Read|Write|Read |   Write |Read| Write |   Read    |   Write   |Read | Write   |
|                                                  |          |               |            |                       |               |
| 2200 |0x641547|  1  |0x641227|0006-0000-0000-0000|  0 | 19  |0 B/s|76.0 KB/s|0 ns|17.7 ms|   0 ns    |   4.7 ms  |0 B/s|9.1 KB/s |
| 2200 |0x64154a|  6  |0x64122a|003b-0000-0000-0000|  0 | 20  |0 B/s|83.0 KB/s|0 ns|13.2 ms|   0 ns    |   4.4 ms  |0 B/s|10.1 KB/s|
| 2200 |0x641542|  2  |0x641222|0013-0000-0000-0000|  0 | 22  |0 B/s|88.0 KB/s|0 ns|15.2 ms|   0 ns    |   4.5 ms  |0 B/s|10.1 KB/s|
| 2200 |0x641545|  3  |0x641225|001c-0000-0000-0000|  0 | 23  |0 B/s|93.0 KB/s|0 ns|18.7 ms|   0 ns    |   4.9 ms  |0 B/s|7.5 KB/s |
| 2200 |0x641543|  1  |0x641223|0003-0000-0000-0000|  0 | 13  |0 B/s|53.0 KB/s|0 ns|13.6 ms|   0 ns    |   4.5 ms  |0 B/s|7.0 KB/s |
| 2200 |0x641546|  4  |0x641226|0027-0000-0000-0000|  0 | 24  |0 B/s|99.0 KB/s|0 ns|18.1 ms|   0 ns    |   4.7 ms  |0 B/s|7.6 KB/s |
| 2200 |0x641545|  4  |0x641225|0021-0000-0000-0000|  0 | 20  |0 B/s|82.0 KB/s|0 ns|15.2 ms|   0 ns    |   5.1 ms  |0 B/s|7.9 KB/s |
| 2200 |0x641548|  5  |0x641228|002d-0000-0000-0000|  0 | 21  |0 B/s|84.0 KB/s|0 ns|16.0 ms|   0 ns    |   4.5 ms  |0 B/s|9.9 KB/s |
| 2200 |0x641547|  5  |0x641227|002f-0000-0000-0000|  0 | 24  |0 B/s|96.0 KB/s|0 ns|14.3 ms|   0 ns    |   3.7 ms  |0 B/s|9.1 KB/s |
| 2200 |0x641545|  6  |0x641225|003a-0000-0000-0000|  0 | 15  |0 B/s|61.0 KB/s|0 ns|17.0 ms|   0 ns    |   4.2 ms  |0 B/s|9.4 KB/s |
+------------------------------------------------------------------------------------------------------------------------------------

This example shows how to display the flow metrics of an initiator for NVMe:


switch# ShowAnalytics --info --initiator-itn
2021-02-09 09:01:39.714290

 Interface fc16/12
+-----------------------------------------+--------------+--------------------------+---------------------+---------------------+----------------------+----------------+-----------------+
|VSAN | Initiator |  Target   | Namespace |   Avg IOPS   |      Avg Throughput      |       Avg ECT       |       Avg DAL       |     Avg IO Size      | Avg Host Delay | Avg Array Delay |
+-----------------------------------------+--------------+--------------------------+---------------------+---------------------+----------------------+----------------+-----------------+
|                                         | Read | Write |     Read   |   Write     |   Read   |   Write  |   Read   |   Write  |   Read   |   Write   |     Write      |      Write      |
|                                         |              |                          |                     |                     |                      |                |                 |
|3300 | 0xc80002  | 0xed0002  |  1        | 2531 | 2478  | 158.2 MB/s | 154.9 MB/s  | 781.0 us |   2.0 ms | 636.0 us | 633.0 us |  64.0 KB |  64.0 KB  |    690.0 us    |     562.0 us    |
|3300 | 0xc80007  | 0xed0007  |  1        | 2508 | 2497  | 156.8 MB/s | 156.1 MB/s  | 764.0 us |   2.0 ms | 622.0 us | 630.0 us |  64.0 KB |  64.0 KB  |    683.0 us    |     572.0 us    |
|3300 | 0xc80005  | 0xed0005  |  1        | 2421 | 2548  | 151.3 MB/s | 159.3 MB/s  | 785.0 us |   2.0 ms | 640.0 us | 625.0 us |  64.0 KB |  64.0 KB  |    686.0 us    |     561.0 us    |
|3300 | 0xc80001  | 0xed0001  |  1        | 2060 | 2149  | 128.8 MB/s | 134.3 MB/s  | 764.0 us |   1.9 ms | 621.0 us | 596.0 us |  64.0 KB |  64.0 KB  |    649.0 us    |     537.0 us    |
|3300 | 0xc80000  | 0xed0000  |  1        | 333  | 364   |  20.8 MB/s |  22.8 MB/s  |  14.8 ms |  16.1 ms |  14.6 ms |  15.3 ms |  64.0 KB |  64.0 KB  |    190.0 us    |     521.0 us    |
|3300 | 0xc80008  | 0xed0008  |  1        | 2483 | 2503  | 155.2 MB/s | 156.4 MB/s  | 771.0 us |   2.0 ms | 626.0 us | 639.0 us |  64.0 KB |  64.0 KB  |    685.0 us    |     571.0 us    |
|3300 | 0xc80009  | 0xed0009  |  1        | 2545 | 2474  | 159.1 MB/s | 154.6 MB/s  | 786.0 us |   2.0 ms | 641.0 us | 627.0 us |  64.0 KB |  64.0 KB  |    683.0 us    |     570.0 us    |
|3300 | 0xc80004  | 0xed0004  |  1        | 2506 | 2498  | 156.6 MB/s | 156.1 MB/s  | 769.0 us |   2.0 ms | 625.0 us | 642.0 us |  64.0 KB |  64.0 KB  |    680.0 us    |     575.0 us    |
|3300 | 0xc80006  | 0xed0006  |  1        | 2456 | 2512  | 153.5 MB/s | 157.0 MB/s  | 793.0 us |   2.0 ms | 650.0 us | 624.0 us |  64.0 KB |  64.0 KB  |    696.0 us    |     558.0 us    |
|3300 | 0xc80000  | 0xed0001  |  1        | 1926 | 1848  | 120.4 MB/s | 115.5 MB/s  | 734.0 us |   1.8 ms | 593.0 us | 572.0 us |  64.0 KB |  64.0 KB  |    533.0 us    |     512.0 us    |
|3300 | 0xc80003  | 0xed0003  |  1        | 2553 | 2472  | 159.6 MB/s | 154.5 MB/s  | 786.0 us |   2.0 ms | 641.0 us | 622.0 us |  64.0 KB |  64.0 KB  |    691.0 us    |     560.0 us    |
+-----------------------------------------+--------------+--------------------------+---------------------+---------------------+----------------------+----------------+-----------------+
Total number of ITNs: 11

This example shows how to display the flow metrics of an initiator for SCSI:


switch# ShowAnalytics --info --initiator-itl
2021-02-09 09:01:39.714290

Interface fc2/22
+----------------------------------------------------------+--------------+--------------------------+--------------------+--------------------+----------------------+----------------+-----------------+
|VSAN | Initiator | VMID |  Target   |         LUN         |   Avg IOPS   |      Avg Throughput      |      Avg ECT       |      Avg DAL       |     Avg IO Size      | Avg Host Delay | Avg Array Delay |
+----------------------------------------------------------+--------------+--------------------------+--------------------+--------------------+----------------------+----------------+-----------------+
|                                                          | Read | Write |     Read   |   Write     |  Read   |   Write  |  Read   |   Write  |   Read   |   Write   |     Write      |      Write      |
|                                                          |              |                          |                    |                    |                      |                |                 |
|2200 | 0xe80ee0  |   - | 0xc809a0  | 0001-0000-0000-0000  |    0 | 0     |      0 B/s |    0 B/s    |   0 ns  |    0 ns  |   0 ns  |    0 ns  |      0 B |    0 B    |      0 ns      |       0 ns      |
|2200 | 0xe80ee0  |   - | 0xe80622  | 0007-0000-0000-0000  |    0 | 0     |      0 B/s |    0 B/s    |   0 ns  |    0 ns  |   0 ns  |    0 ns  |      0 B |    0 B    |      0 ns      |       0 ns      |
|2200 | 0xe80ee0  |   - | 0xc809a0  | 0002-0000-0000-0000  |    0 | 0     |      0 B/s |    0 B/s    |   0 ns  |    0 ns  |   0 ns  |    0 ns  |      0 B |    0 B    |      0 ns      |       0 ns      |
|2200 | 0xe80ee0  |   - | 0xc809a0  | 0003-0000-0000-0000  |    0 | 0     |      0 B/s |    0 B/s    |   0 ns  |    0 ns  |   0 ns  |    0 ns  |      0 B |    0 B    |      0 ns      |       0 ns      |
|2200 | 0xe80ee0  |   - | 0xe80622  | 0002-0000-0000-0000  |    0 | 0     |      0 B/s |    0 B/s    |   0 ns  |    0 ns  |   0 ns  |    0 ns  |      0 B |    0 B    |      0 ns      |       0 ns      |
|2200 | 0xe80ee0  |  18 | 0xc809a0  | 0003-0000-0000-0000  |    0 | 5     |      0 B/s |  21.0 KB/s  |   0 ns  | 702.0 us |   0 ns  | 251.0 us |      0 B |  4.2 KB   |     7.0 us     |     441.0 us    |
|2200 | 0xe80ee0  |   - | 0xe80623  | 0004-0000-0000-0000  |    0 | 0     |      0 B/s |    0 B/s    |   0 ns  |    0 ns  |   0 ns  |    0 ns  |      0 B |    0 B    |      0 ns      |       0 ns      |
|2200 | 0xe80ee0  |   - | 0xe80622  | 0000-0000-0000-0000  |    0 | 0     |      0 B/s |    0 B/s    |   0 ns  |    0 ns  |   0 ns  |    0 ns  |      0 B |    0 B    |      0 ns      |       0 ns      |
+----------------------------------------------------------+--------------+--------------------------+--------------------+--------------------+----------------------+----------------+-----------------+
Total number of ITLs: 8

This example shows how to display the flow metrics of a target ITL:


switch# ShowAnalytics --info --target-itl
2021-02-09 12:14:59.285397

Interface fc1/1
+----------------------------------------------------------------------------------------------------------------------------------
|VSAN|Initiator|VMID| Target |       LUN         | Avg IOPS | Avg Throughput |  Avg ECT  |Avg Data Access Latency|  Avg IO Size   |
+----------------------------------------------------------------------------------------------------------------------------------
|                                                |Read|Write|Read | Write    |Read|Write |   Read     |   Write  | Read| Write    |
|                                                |          |                |           |                       |                |
| 20| 0x1c0020 | 89 |0x1c0000|0000-0000-0000-0000| 0  |1761 |0 B/s|220.2 MB/s|0 ns|5.5 ms|   0 ns     |  2.5 ms  |0 B/s|128.0 KB/s|
+----------------------------------------------------------------------------------------------------------------------------------

This example shows how to display the flow metrics of a target for NVMe:


switch# ShowAnalytics --info --target-itn
2021-02-09 12:14:59.285397

Interface fc3/15
+-----------------------------------------+--------------+--------------------------+---------------------+--------------------+----------------------+----------------+-----------------+
|VSAN | Initiator |  Target   | Namespace |   Avg IOPS   |      Avg Throughput      |       Avg ECT       |      Avg DAL       |     Avg IO Size      | Avg Host Delay | Avg Array Delay |
+-----------------------------------------+--------------+--------------------------+---------------------+--------------------+----------------------+----------------+-----------------+
|                                         | Read | Write |     Read   |   Write     |   Read   |   Write  |  Read   |   Write  |   Read   |   Write   |     Write      |      Write      |
|                                         |              |                          |                     |                    |                      |                |                 |
|3300 | 0xc80005  | 0xed0005  |  1        | 2545 | 2457  | 159.1 MB/s | 153.6 MB/s  | 112.0 us |   1.5 ms | 44.0 us |  40.0 us |  64.0 KB |  64.0 KB  |     1.3 ms     |      5.0 us     |
|3300 | 0xc80000  | 0xed0001  |  1        | 2036 | 2026  | 127.3 MB/s | 126.6 MB/s  | 110.0 us |   1.3 ms | 44.0 us |  39.0 us |  64.0 KB |  64.0 KB  |     1.1 ms     |      5.0 us     |
|3300 | 0xc80004  | 0xed0004  |  1        | 2464 | 2492  | 154.0 MB/s | 155.8 MB/s  | 113.0 us |   1.5 ms | 45.0 us |  40.0 us |  64.0 KB |  64.0 KB  |     1.3 ms     |      5.0 us     |
|3300 | 0xc80001  | 0xed0001  |  1        | 2036 | 2020  | 127.2 MB/s | 126.2 MB/s  | 112.0 us |   1.3 ms | 44.0 us |  40.0 us |  64.0 KB |  64.0 KB  |     1.1 ms     |      5.0 us     |
|3300 | 0xc80003  | 0xed0003  |  1        | 2460 | 2491  | 153.8 MB/s | 155.7 MB/s  | 114.0 us |   1.5 ms | 45.0 us |  39.0 us |  64.0 KB |  64.0 KB  |     1.3 ms     |      5.0 us     |
|3300 | 0xc80000  | 0xed0000  |  1        | 335  | 360   |  20.9 MB/s |  22.5 MB/s  |  14.1 ms |  15.6 ms | 14.1 ms |  14.7 ms |  64.0 KB |  64.0 KB  |    784.0 us    |      5.0 us     |
|3300 | 0xc80007  | 0xed0007  |  1        | 2476 | 2488  | 154.8 MB/s | 155.5 MB/s  | 114.0 us |   1.5 ms | 46.0 us |  39.0 us |  64.0 KB |  64.0 KB  |     1.3 ms     |      5.0 us     |
|3300 | 0xc80008  | 0xed0008  |  1        | 2484 | 2489  | 155.3 MB/s | 155.6 MB/s  | 114.0 us |   1.5 ms | 46.0 us |  40.0 us |  64.0 KB |  64.0 KB  |     1.3 ms     |      5.0 us     |
|3300 | 0xc80002  | 0xed0002  |  1        | 2472 | 2490  | 154.5 MB/s | 155.6 MB/s  | 112.0 us |   1.5 ms | 45.0 us |  40.0 us |  64.0 KB |  64.0 KB  |     1.3 ms     |      5.0 us     |
|3300 | 0xc80006  | 0xed0006  |  1        | 2449 | 2507  | 153.1 MB/s | 156.7 MB/s  | 116.0 us |   1.5 ms | 46.0 us |  39.0 us |  64.0 KB |  64.0 KB  |     1.3 ms     |      5.0 us     |
|3300 | 0xc80009  | 0xed0009  |  1        | 2471 | 2485  | 154.4 MB/s | 155.3 MB/s  | 114.0 us |   1.5 ms | 45.0 us |  40.0 us |  64.0 KB |  64.0 KB  |     1.3 ms     |      5.0 us     |
+-----------------------------------------+--------------+--------------------------+---------------------+--------------------+----------------------+----------------+-----------------+
Total number of ITNs: 11

This example shows how to display the flow metrics of a target for SCSI:


switch# ShowAnalytics --info --target-itl
2021-02-09 12:14:59.285397

Interface fc5/21
+----------------------------------------------------------+--------------+--------------------------+--------------------+--------------------+----------------------+----------------+-----------------+
|VSAN | Initiator | VMID |  Target   |         LUN         |   Avg IOPS   |      Avg Throughput      |      Avg ECT       |      Avg DAL       |     Avg IO Size      | Avg Host Delay | Avg Array Delay |
+----------------------------------------------------------+--------------+--------------------------+--------------------+--------------------+----------------------+----------------+-----------------+
|                                                          | Read | Write |     Read   |   Write     |  Read   |   Write  |  Read   |   Write  |   Read   |   Write   |     Write      |      Write      |
|                                                          |              |                          |                    |                    |                      |                |                 |
|2200 | 0xe902e0  |   - | 0xe805a0  | 0002-0000-0000-0000  |  0   | 9236  |      0 B/s |  4.5 MB/s   |   0 ns  |  75.0 us |   0 ns  |  25.0 us |      0 B |  512.0 B  |      0 ns      |       0 ns      |
|2200 | 0xe902e0  |   - | 0xe805a0  | 0003-0000-0000-0000  |  0   | 9235  |      0 B/s |  4.5 MB/s   |   0 ns  |  75.0 us |   0 ns  |  25.0 us |      0 B |  511.0 B  |      0 ns      |       0 ns      |
|2200 | 0xe902e0  |   - | 0xe805a0  | 0001-0000-0000-0000  |  0   | 9235  |      0 B/s |  4.5 MB/s   |   0 ns  |  75.0 us |   0 ns  |  25.0 us |      0 B |  512.0 B  |      0 ns      |       0 ns      |
+----------------------------------------------------------+--------------+--------------------------+--------------------+--------------------+----------------------+----------------+-----------------+
Total number of ITLs: 3

This example shows how to display all target ITLs and limit the output to 10 random records:


switch# ShowAnalytics --info --target-itl --interface fc8/15 --limit 10
2019-04-09 11:11:24.652190
 
 Interface fc8/15
+--------------------------------------------+--------------+------------------+----------------+
|         VSAN|Initiator|Target|LUN          |  Avg IOPS    |  Avg Throughput  |   Avg ECT      |
+--------------------------------------------+--------------+------------------+----------------+
|                                            | Read | Write |  Read |   Write  | Read |  Write  |
|                                            |              |                  |                |
| 3300|0x040001|0x030033|0000-0000-0000-0000 |  0   | 4047  |  0    |15.8 MB/s |  0   | 84.0 us |
| 3300|0x040003|0x030035|0000-0000-0000-0000 |  0   | 4045  |  0    |15.8 MB/s |  0   | 85.0 us |
| 3300|0x040005|0x030037|0000-0000-0000-0000 |  0   | 4033  |  0    |15.8 MB/s |  0   | 85.0 us |
| 3300|0x040007|0x030039|0000-0000-0000-0000 |  0   | 4041  |  0    |15.8 MB/s |  0   | 86.0 us |
| 3300|0x040009|0x03003b|0000-0000-0000-0000 |  0   | 4048  |  0    |15.8 MB/s |  0   | 86.0 us |
| 3300|0x04000b|0x03003d|0000-0000-0000-0000 |  0   | 4040  |  0    |15.8 MB/s |  0   | 86.0 us |
| 3300|0x04000d|0x03003f|0000-0000-0000-0000 |  0   | 4055  |  0    |15.8 MB/s |  0   | 86.0 us |
| 3300|0x04000f|0x030041|0000-0000-0000-0000 |  0   | 4052  |  0    |15.8 MB/s |  0   | 86.0 us |
| 3300|0x040011|0x030043|0000-0000-0000-0000 |  0   | 4055  |  0    |15.8 MB/s |  0   | 86.0 us |
| 3300|0x040013|0x030045|0000-0000-0000-0000 |  0   | 4056  |  0    |15.8 MB/s |  0   | 86.0 us |
+--------------------------------------------+--------------+------------------+----------------+

This example shows how to display all target ITNs and limit the output to 5 random records for NVMe:


switch# ShowAnalytics --info --target-itn --interface fc8/15 --limit 5
2019-04-09 11:11:24.652190
 
  Interface fc3/15
+-----------------------------------------+--------------+--------------------------+---------------------+--------------------+----------------------+----------------+-----------------+
|VSAN | Initiator |  Target   | Namespace |   Avg IOPS   |      Avg Throughput      |       Avg ECT       |      Avg DAL       |     Avg IO Size      | Avg Host Delay | Avg Array Delay |
+-----------------------------------------+--------------+--------------------------+---------------------+--------------------+----------------------+----------------+-----------------+
|                                         | Read | Write |     Read   |   Write     |   Read   |   Write  |  Read   |   Write  |   Read   |   Write   |     Write      |      Write      |
|                                         |              |                          |                     |                    |                      |                |                 |
|3300 | 0xc80005  | 0xed0005  |  1        | 2396 | 2473  | 149.8 MB/s | 154.6 MB/s  | 111.0 us |   1.5 ms | 45.0 us |  40.0 us |  64.0 KB |  64.0 KB  |     1.3 ms     |      5.0 us     |
|3300 | 0xc80000  | 0xed0001  |  1        | 2180 | 2250  | 136.3 MB/s | 140.7 MB/s  | 110.0 us |   1.2 ms | 43.0 us |  39.0 us |  64.0 KB |  64.0 KB  |     1.1 ms     |      5.0 us     |
|3300 | 0xc80004  | 0xed0004  |  1        | 2424 | 2463  | 151.5 MB/s | 154.0 MB/s  | 114.0 us |   1.5 ms | 46.0 us |  39.0 us |  64.0 KB |  64.0 KB  |     1.3 ms     |      5.0 us     |
|3300 | 0xc80001  | 0xed0001  |  1        | 2129 | 2202  | 133.1 MB/s | 137.6 MB/s  | 110.0 us |   1.2 ms | 43.0 us |  37.0 us |  64.0 KB |  64.0 KB  |    992.0 us    |      5.0 us     |
|3300 | 0xc80003  | 0xed0003  |  1        | 2457 | 2462  | 153.6 MB/s | 153.9 MB/s  | 114.0 us |   1.5 ms | 46.0 us |  38.0 us |  64.0 KB |  64.0 KB  |     1.3 ms     |      5.0 us     |
+-----------------------------------------+--------------+--------------------------+---------------------+--------------------+----------------------+----------------+-----------------+
Total number of ITNs: 5

This example shows how to display all target ITLs and limit the output to 10 random records for SCSI:


switch# ShowAnalytics --info --target-itl --interface fc8/15 --limit 10
2019-04-09 11:11:24.652190
 
 Interface fc5/21
+----------------------------------------------------------+--------------+--------------------------+--------------------+--------------------+----------------------+----------------+-----------------+
|VSAN | Initiator | VMID |  Target   |         LUN         |   Avg IOPS   |      Avg Throughput      |      Avg ECT       |      Avg DAL       |     Avg IO Size      | Avg Host Delay | Avg Array Delay |
+----------------------------------------------------------+--------------+--------------------------+--------------------+--------------------+----------------------+----------------+-----------------+
|                                                          | Read | Write |     Read   |   Write     |  Read   |   Write  |  Read   |   Write  |   Read   |   Write   |     Write      |      Write      |
|                                                          |              |                          |                    |                    |                      |                |                 |
|2200 | 0xe902e0  |   - | 0xe805a0  | 0002-0000-0000-0000  |  0   | 9235  |      0 B/s |  4.5 MB/s   |   0 ns  |  75.0 us |   0 ns  |  25.0 us |      0 B |  512.0 B  |      0 ns      |       0 ns      |
|2200 | 0xe902e0  |   - | 0xe805a0  | 0003-0000-0000-0000  |  0   | 9235  |      0 B/s |  4.5 MB/s   |   0 ns  |  75.0 us |   0 ns  |  25.0 us |      0 B |  512.0 B  |      0 ns      |       0 ns      |
|2200 | 0xe902e0  |   - | 0xe805a0  | 0001-0000-0000-0000  |  0   | 9235  |      0 B/s |  4.5 MB/s   |   0 ns  |  75.0 us |   0 ns  |  25.0 us |      0 B |  512.0 B  |      0 ns      |       0 ns      |
+----------------------------------------------------------+--------------+--------------------------+--------------------+--------------------+----------------------+----------------+-----------------+
Total number of ITLs: 3

This example shows how to display the flow metrics of VSAN 3300 of an initiator ITN for NVMe:


switch# ShowAnalytics --info --initiator-itn --vsan 3300
2019-04-08 11:26:23.074904
 
Interface fc16/12
+-----------------------------------------+--------------+--------------------------+---------------------+---------------------+----------------------+----------------+-----------------+
|VSAN | Initiator |  Target   | Namespace |   Avg IOPS   |      Avg Throughput      |       Avg ECT       |       Avg DAL       |     Avg IO Size      | Avg Host Delay | Avg Array Delay |
+-----------------------------------------+--------------+--------------------------+---------------------+---------------------+----------------------+----------------+-----------------+
|                                         | Read | Write |     Read   |   Write     |   Read   |   Write  |   Read   |   Write  |   Read   |   Write   |     Write      |      Write      |
|                                         |              |                          |                     |                     |                      |                |                 |
|3300 | 0xc80002  | 0xed0002  |  1        | 2466 | 2458  | 154.2 MB/s | 153.6 MB/s  | 782.0 us |   2.1 ms | 635.0 us | 620.0 us |  64.0 KB |  64.0 KB  |    714.0 us    |     567.0 us    |
|3300 | 0xc80007  | 0xed0007  |  1        | 2466 | 2470  | 154.1 MB/s | 154.4 MB/s  | 786.0 us |   2.0 ms | 641.0 us | 620.0 us |  64.0 KB |  64.0 KB  |    712.0 us    |     561.0 us    |
|3300 | 0xc80005  | 0xed0005  |  1        | 2432 | 2484  | 152.0 MB/s | 155.3 MB/s  | 775.0 us |   2.1 ms | 629.0 us | 623.0 us |  64.0 KB |  64.0 KB  |    714.0 us    |     564.0 us    |
|3300 | 0xc80001  | 0xed0001  |  1        | 2066 | 2031  | 129.2 MB/s | 126.9 MB/s  | 723.0 us |   1.7 ms | 580.0 us | 569.0 us |  64.0 KB |  64.0 KB  |    470.0 us    |     507.0 us    |
|3300 | 0xc80000  | 0xed0000  |  1        | 339  | 347   |  21.2 MB/s |  21.7 MB/s  |  15.3 ms |  16.1 ms |  15.2 ms |  15.2 ms |  64.0 KB |  64.0 KB  |    190.0 us    |     518.0 us    |
|3300 | 0xc80008  | 0xed0008  |  1        | 2436 | 2480  | 152.2 MB/s | 155.0 MB/s  | 777.0 us |   2.0 ms | 632.0 us | 623.0 us |  64.0 KB |  64.0 KB  |    708.0 us    |     563.0 us    |
|3300 | 0xc80009  | 0xed0009  |  1        | 2475 | 2459  | 154.7 MB/s | 153.7 MB/s  | 772.0 us |   2.1 ms | 625.0 us | 630.0 us |  64.0 KB |  64.0 KB  |    700.0 us    |     569.0 us    |
|3300 | 0xc80004  | 0xed0004  |  1        | 2508 | 2448  | 156.8 MB/s | 153.0 MB/s  | 775.0 us |   2.0 ms | 630.0 us | 626.0 us |  64.0 KB |  64.0 KB  |    704.0 us    |     568.0 us    |
|3300 | 0xc80006  | 0xed0006  |  1        | 2427 | 2485  | 151.7 MB/s | 155.3 MB/s  | 778.0 us |   2.0 ms | 634.0 us | 623.0 us |  64.0 KB |  64.0 KB  |    713.0 us    |     561.0 us    |
|3300 | 0xc80000  | 0xed0001  |  1        | 2246 | 2218  | 140.4 MB/s | 138.7 MB/s  | 744.0 us |   1.8 ms | 600.0 us | 591.0 us |  64.0 KB |  64.0 KB  |    561.0 us    |     530.0 us    |
|3300 | 0xc80003  | 0xed0003  |  1        | 2439 | 2478  | 152.4 MB/s | 154.9 MB/s  | 776.0 us |   2.1 ms | 630.0 us | 628.0 us |  64.0 KB |  64.0 KB  |    711.0 us    |     564.0 us    |
+-----------------------------------------+--------------+--------------------------+---------------------+---------------------+----------------------+----------------+-----------------+
Total number of ITNs: 11

This example shows how to display the flow metrics of VSAN 2200 of an initiator ITL for SCSI:


switch# ShowAnalytics --info --initiator-itl --vsan 2200
2019-04-08 11:26:23.074904
 
Interface fc2/22
+----------------------------------------------------------+--------------+--------------------------+--------------------+--------------------+----------------------+----------------+-----------------+
|VSAN | Initiator | VMID |  Target   |         LUN         |   Avg IOPS   |      Avg Throughput      |      Avg ECT       |      Avg DAL       |     Avg IO Size      | Avg Host Delay | Avg Array Delay |
+----------------------------------------------------------+--------------+--------------------------+--------------------+--------------------+----------------------+----------------+-----------------+
|                                                          | Read | Write |     Read   |   Write     |  Read   |   Write  |  Read   |   Write  |   Read   |   Write   |     Write      |      Write      |
|                                                          |              |                          |                    |                    |                      |                |                 |
|2200 | 0xe80ee0  |   - | 0xe80622  | 0007-0000-0000-0000  |    0 | 0     |      0 B/s |    0 B/s    |   0 ns  |    0 ns  |   0 ns  |    0 ns  |      0 B |    0 B    |      0 ns      |       0 ns      |
|2200 | 0xe80ee0  |   - | 0xc809a0  | 0003-0000-0000-0000  |    0 | 0     |      0 B/s |    0 B/s    |   0 ns  |    0 ns  |   0 ns  |    0 ns  |      0 B |    0 B    |      0 ns      |       0 ns      |
|2200 | 0xe80ee0  |   - | 0xe80622  | 0002-0000-0000-0000  |    0 | 0     |      0 B/s |    0 B/s    |   0 ns  |    0 ns  |   0 ns  |    0 ns  |      0 B |    0 B    |      0 ns      |       0 ns      |
|2200 | 0xe80ee0  |  18 | 0xc809a0  | 0003-0000-0000-0000  |    0 | 0     |      0 B/s |  2.0 KB/s   |   0 ns  | 843.0 us |   0 ns  | 179.0 us |      0 B |  4.0 KB   |     7.0 us     |     656.0 us    |
|2200 | 0xe80ee0  |   - | 0xe80622  | 0000-0000-0000-0000  |    0 | 0     |      0 B/s |    0 B/s    |   0 ns  |    0 ns  |   0 ns  |    0 ns  |      0 B |    0 B    |      0 ns      |       0 ns      |
+----------------------------------------------------------+--------------+--------------------------+--------------------+--------------------+----------------------+----------------+-----------------+
Total number of ITLs: 5

This example shows how to display the flow metrics of interface fc3/15 of a target ITN for NVMe:


switch# ShowAnalytics --info --target-itn --interface fc3/15
2019-04-09 11:11:17.974991
 
 Interface fc3/15
+-----------------------------------------+--------------+--------------------------+---------------------+--------------------+----------------------+----------------+-----------------+
|VSAN | Initiator |  Target   | Namespace |   Avg IOPS   |      Avg Throughput      |       Avg ECT       |      Avg DAL       |     Avg IO Size      | Avg Host Delay | Avg Array Delay |
+-----------------------------------------+--------------+--------------------------+---------------------+--------------------+----------------------+----------------+-----------------+
|                                         | Read | Write |     Read   |   Write     |   Read   |   Write  |  Read   |   Write  |   Read   |   Write   |     Write      |      Write      |
|                                         |              |                          |                     |                    |                      |                |                 |
|3300 | 0xc80005  | 0xed0005  |  1        | 2475 | 2531  | 154.7 MB/s | 158.2 MB/s  | 112.0 us |   1.5 ms | 45.0 us |  40.0 us |  64.0 KB |  64.0 KB  |     1.3 ms     |      5.0 us     |
|3300 | 0xc80000  | 0xed0001  |  1        | 2137 | 2158  | 133.6 MB/s | 134.9 MB/s  | 112.0 us |   1.4 ms | 46.0 us |  39.0 us |  64.0 KB |  64.0 KB  |     1.2 ms     |      5.0 us     |
|3300 | 0xc80004  | 0xed0004  |  1        | 2465 | 2530  | 154.1 MB/s | 158.2 MB/s  | 115.0 us |   1.5 ms | 46.0 us |  39.0 us |  64.0 KB |  64.0 KB  |     1.3 ms     |      5.0 us     |
|3300 | 0xc80001  | 0xed0001  |  1        | 1785 | 1796  | 111.6 MB/s | 112.2 MB/s  | 112.0 us |   1.3 ms | 45.0 us |  38.0 us |  64.0 KB |  64.0 KB  |     1.1 ms     |      5.0 us     |
|3300 | 0xc80003  | 0xed0003  |  1        | 2512 | 2506  | 157.0 MB/s | 156.6 MB/s  | 113.0 us |   1.5 ms | 45.0 us |  40.0 us |  64.0 KB |  64.0 KB  |     1.3 ms     |      5.0 us     |
|3300 | 0xc80000  | 0xed0000  |  1        | 355  | 329   |  22.2 MB/s |  20.6 MB/s  |  14.8 ms |  15.5 ms | 14.8 ms |  14.6 ms |  64.0 KB |  64.0 KB  |    753.0 us    |      5.0 us     |
|3300 | 0xc80007  | 0xed0007  |  1        | 2465 | 2532  | 154.1 MB/s | 158.2 MB/s  | 115.0 us |   1.5 ms | 47.0 us |  40.0 us |  64.0 KB |  64.0 KB  |     1.3 ms     |      5.0 us     |
|3300 | 0xc80008  | 0xed0008  |  1        | 2488 | 2520  | 155.5 MB/s | 157.5 MB/s  | 115.0 us |   1.5 ms | 47.0 us |  40.0 us |  64.0 KB |  64.0 KB  |     1.3 ms     |      5.0 us     |
|3300 | 0xc80002  | 0xed0002  |  1        | 2548 | 2497  | 159.3 MB/s | 156.1 MB/s  | 113.0 us |   1.5 ms | 46.0 us |  40.0 us |  64.0 KB |  64.0 KB  |     1.3 ms     |      5.0 us     |
|3300 | 0xc80006  | 0xed0006  |  1        | 2476 | 2523  | 154.8 MB/s | 157.7 MB/s  | 113.0 us |   1.5 ms | 46.0 us |  40.0 us |  64.0 KB |  64.0 KB  |     1.3 ms     |      5.0 us     |
|3300 | 0xc80009  | 0xed0009  |  1        | 2487 | 2525  | 155.4 MB/s | 157.8 MB/s  | 114.0 us |   1.5 ms | 46.0 us |  40.0 us |  64.0 KB |  64.0 KB  |     1.3 ms     |      5.0 us     |
+-----------------------------------------+--------------+--------------------------+---------------------+--------------------+----------------------+----------------+-----------------+
Total number of ITNs: 11

This example shows how to display the flow metrics of interface fc5/21 of a target ITL for SCSI:


switch# ShowAnalytics --info --target-itl --interface fc5/21
2019-04-09 11:11:17.974991

  Interface fc5/21
+----------------------------------------------------------+--------------+--------------------------+--------------------+--------------------+----------------------+----------------+-----------------+
|VSAN | Initiator | VMID |  Target   |         LUN         |   Avg IOPS   |      Avg Throughput      |      Avg ECT       |      Avg DAL       |     Avg IO Size      | Avg Host Delay | Avg Array Delay |
+----------------------------------------------------------+--------------+--------------------------+--------------------+--------------------+----------------------+----------------+-----------------+
|                                                          | Read | Write |     Read   |   Write     |  Read   |   Write  |  Read   |   Write  |   Read   |   Write   |     Write      |      Write      |
|                                                          |              |                          |                    |                    |                      |                |                 |
|2200 | 0xe902e0  |   - | 0xe805a0  | 0002-0000-0000-0000  |  0   | 9231  |      0 B/s |  4.5 MB/s   |   0 ns  |  75.0 us |   0 ns  |  25.0 us |      0 B |  512.0 B  |      0 ns      |       0 ns      |
|2200 | 0xe902e0  |   - | 0xe805a0  | 0003-0000-0000-0000  |  0   | 9231  |      0 B/s |  4.5 MB/s   |   0 ns  |  75.0 us |   0 ns  |  25.0 us |      0 B |  512.0 B  |      0 ns      |       0 ns      |
|2200 | 0xe902e0  |   - | 0xe805a0  | 0001-0000-0000-0000  |  0   | 9230  |      0 B/s |  4.5 MB/s   |   0 ns  |  75.0 us |   0 ns  |  25.0 us |      0 B |  512.0 B  |      0 ns      |       0 ns      |
+----------------------------------------------------------+--------------+--------------------------+--------------------+--------------------+----------------------+----------------+-----------------+
Total number of ITLs: 3

This example shows how to display the flow metrics and device alias information of interface fc3/15 of a target ITN and limit the output to 10 random records for NVMe:


switch# ShowAnalytics --info --target-itn --alias  --interface fc3/15  --limit 10
2019-04-09 12:04:07.032501

 Interface fc3/15
+---------------------------------------------------------------+--------------+--------------------------+---------------------+--------------------+----------------------+----------------+-----------------+
|VSAN |      Initiator       |        Target        | Namespace |   Avg IOPS   |      Avg Throughput      |       Avg ECT       |      Avg DAL       |     Avg IO Size      | Avg Host Delay | Avg Array Delay |
+---------------------------------------------------------------+--------------+--------------------------+---------------------+--------------------+----------------------+----------------+-----------------+
|                                                               | Read | Write |     Read   |   Write     |   Read   |   Write  |  Read   |   Write  |   Read   |   Write   |     Write      |      Write      |
|                                                               |              |                          |                     |                    |                      |                |                 |
|3300 |       0xc80005       |       0xed0005       |  1        | 2488 | 2514  | 155.5 MB/s | 157.1 MB/s  | 113.0 us |   1.5 ms | 46.0 us |  39.0 us |  64.0 KB |  64.0 KB  |     1.3 ms     |      5.0 us     |
|3300 |       0xc80000       |       0xed0001       |  1        | 2122 | 2154  | 132.6 MB/s | 134.7 MB/s  | 111.0 us |   1.4 ms | 45.0 us |  40.0 us |  64.0 KB |  64.0 KB  |     1.2 ms     |      5.0 us     |
|3300 |       0xc80004       |       0xed0004       |  1        | 2492 | 2509  | 155.8 MB/s | 156.8 MB/s  | 113.0 us |   1.5 ms | 46.0 us |  40.0 us |  64.0 KB |  64.0 KB  |     1.3 ms     |      5.0 us     |
|3300 |       0xc80001       |       0xed0001       |  1        | 1847 | 1752  | 115.4 MB/s | 109.5 MB/s  | 112.0 us |   1.3 ms | 45.0 us |  39.0 us |  64.0 KB |  64.0 KB  |     1.1 ms     |      5.0 us     |
|3300 |       0xc80003       |       0xed0003       |  1        | 2523 | 2495  | 157.7 MB/s | 155.9 MB/s  | 114.0 us |   1.5 ms | 46.0 us |  41.0 us |  64.0 KB |  64.0 KB  |     1.3 ms     |      5.0 us     |
|3300 |       0xc80000       |       0xed0000       |  1        | 340  | 355   |  21.3 MB/s |  22.2 MB/s  |  14.3 ms |  15.3 ms | 14.2 ms |  14.4 ms |  64.0 KB |  64.0 KB  |    801.0 us    |      5.0 us     |
|3300 |       0xc80007       |       0xed0007       |  1        | 2495 | 2510  | 156.0 MB/s | 156.9 MB/s  | 114.0 us |   1.5 ms | 47.0 us |  40.0 us |  64.0 KB |  64.0 KB  |     1.3 ms     |      5.0 us     |
|3300 |       0xc80008       |       0xed0008       |  1        | 2515 | 2496  | 157.2 MB/s | 156.0 MB/s  | 114.0 us |   1.5 ms | 47.0 us |  40.0 us |  64.0 KB |  64.0 KB  |     1.3 ms     |      5.0 us     |
|3300 |       0xc80002       |       0xed0002       |  1        | 2537 | 2484  | 158.6 MB/s | 155.3 MB/s  | 114.0 us |   1.5 ms | 46.0 us |  41.0 us |  64.0 KB |  64.0 KB  |     1.3 ms     |      5.0 us     |
|3300 |       0xc80006       |       0xed0006       |  1        | 2502 | 2510  | 156.4 MB/s | 156.9 MB/s  | 113.0 us |   1.5 ms | 46.0 us |  41.0 us |  64.0 KB |  64.0 KB  |     1.3 ms     |      5.0 us     |
+---------------------------------------------------------------+--------------+--------------------------+---------------------+--------------------+----------------------+----------------+-----------------+
Total number of ITNs: 10

This example shows how to display the flow metrics and device alias information of interface fc5/21 of a target ITL and limit the output to 10 random records for SCSI:


switch# ShowAnalytics --info --target-itl --alias  --interface fc5/21  --limit 10
2019-04-09 12:04:07.032501

 Interface fc5/21
+--------------------------------------------------------------------------------+--------------+--------------------------+--------------------+--------------------+----------------------+----------------+-----------------+
|VSAN |      Initiator       | VMID |        Target        |         LUN         |   Avg IOPS   |      Avg Throughput      |      Avg ECT       |      Avg DAL       |     Avg IO Size      | Avg Host Delay | Avg Array Delay |
+--------------------------------------------------------------------------------+--------------+--------------------------+--------------------+--------------------+----------------------+----------------+-----------------+
|                                                                                | Read | Write |     Read   |   Write     |  Read   |   Write  |  Read   |   Write  |   Read   |   Write   |     Write      |      Write      |
|                                                                                |              |                          |                    |                    |                      |                |                 |
|2200 |       0xe902e0       |   - | Tgt_9706_206_fc5_21_ | 0002-0000-0000-0000  |  0   | 5796  |      0 B/s |  2.8 MB/s   |   0 ns  |  84.0 us |   0 ns  |  29.0 us |      0 B |  512.0 B  |      0 ns      |       0 ns      |
|2200 |       0xe902e0       |   - | Tgt_9706_206_fc5_21_ | 0003-0000-0000-0000  |  0   | 5797  |      0 B/s |  2.8 MB/s   |   0 ns  |  84.0 us |   0 ns  |  29.0 us |      0 B |  512.0 B  |      0 ns      |       0 ns      |
|2200 |       0xe902e0       |   - | Tgt_9706_206_fc5_21_ | 0001-0000-0000-0000  |  0   | 5797  |      0 B/s |  2.8 MB/s   |   0 ns  |  84.0 us |   0 ns  |  29.0 us |      0 B |  512.0 B  |      0 ns      |       0 ns      |
|2200 |       0xe90440       |   - | Tgt_9706_206_fc5_21_ | 0001-0000-0000-0000  |  0   | 5797  |      0 B/s |  2.8 MB/s   |   0 ns  | 122.0 us |   0 ns  |  44.0 us |      0 B |  512.0 B  |      0 ns      |       0 ns      |
|2200 |       0xe90440       |   - | Tgt_9706_206_fc5_21_ | 0002-0000-0000-0000  |  0   | 5796  |      0 B/s |  2.8 MB/s   |   0 ns  | 124.0 us |   0 ns  |  44.0 us |      0 B |  512.0 B  |      0 ns      |       0 ns      |
|2200 |       0xe906c0       |   - | Tgt_9706_206_fc5_21_ | 0001-0000-0000-0000  |  0   | 5797  |      0 B/s |  2.8 MB/s   |   0 ns  | 130.0 us |   0 ns  |  47.0 us |      0 B |  512.0 B  |      0 ns      |       0 ns      |
|2200 |       0xe906c0       |   - | Tgt_9706_206_fc5_21_ | 0002-0000-0000-0000  |  0   | 5796  |      0 B/s |  2.8 MB/s   |   0 ns  | 131.0 us |   0 ns  |  48.0 us |      0 B |  512.0 B  |      0 ns      |       0 ns      |
+--------------------------------------------------------------------------------+--------------+--------------------------+--------------------+--------------------+----------------------+----------------+-----------------+
Total number of ITLs: 7

This example shows how to display the flow metrics of target ID 0xed0001 of a target ITN for NVMe:


switch# ShowAnalytics --info --target-itn --target 0xed0001
2019-04-09 11:16:26.246741
 
 Interface fc3/15
+-----------------------------------------+--------------+--------------------------+---------------------+--------------------+----------------------+----------------+-----------------+
|VSAN | Initiator |  Target   | Namespace |   Avg IOPS   |      Avg Throughput      |       Avg ECT       |      Avg DAL       |     Avg IO Size      | Avg Host Delay | Avg Array Delay |
+-----------------------------------------+--------------+--------------------------+---------------------+--------------------+----------------------+----------------+-----------------+
|                                         | Read | Write |     Read   |   Write     |   Read   |   Write  |  Read   |   Write  |   Read   |   Write   |     Write      |      Write      |
|                                         |              |                          |                     |                    |                      |                |                 |
|3300 | 0xc80000  | 0xed0001  |  1        | 2100 | 2173  | 131.2 MB/s | 135.8 MB/s  | 110.0 us |   1.4 ms | 44.0 us |  38.0 us |  64.0 KB |  64.0 KB  |     1.2 ms     |      5.0 us     |
|3300 | 0xc80001  | 0xed0001  |  1        | 1964 | 1943  | 122.8 MB/s | 121.4 MB/s  | 109.0 us |   1.2 ms | 43.0 us |  38.0 us |  64.0 KB |  64.0 KB  |     1.0 ms     |      5.0 us     |
+-----------------------------------------+--------------+--------------------------+---------------------+--------------------+----------------------+----------------+-----------------+
Total number of ITNs: 2

This example shows how to display the flow metrics of target ID 0xe80b40 of a target ITL for SCSI:


switch# ShowAnalytics --info --target-itl --target 0xe80b40
2019-04-09 11:16:26.246741
 
 Interface fc5/21
+----------------------------------------------------------+--------------+--------------------------+--------------------+--------------------+----------------------+----------------+-----------------+
|VSAN | Initiator | VMID |  Target   |         LUN         |   Avg IOPS   |      Avg Throughput      |      Avg ECT       |      Avg DAL       |     Avg IO Size      | Avg Host Delay | Avg Array Delay |
+----------------------------------------------------------+--------------+--------------------------+--------------------+--------------------+----------------------+----------------+-----------------+
|                                                          | Read | Write |     Read   |   Write     |  Read   |   Write  |  Read   |   Write  |   Read   |   Write   |     Write      |      Write      |
|                                                          |              |                          |                    |                    |                      |                |                 |
|2200 | 0xe90440  |   - | 0xe80b40  | 0001-0000-0000-0000  |  0   | 5809  |      0 B/s |  2.8 MB/s   |   0 ns  | 128.0 us |   0 ns  |  48.0 us |      0 B |  512.0 B  |      0 ns      |       0 ns      |
|2200 | 0xe90440  |   - | 0xe80b40  | 0002-0000-0000-0000  |  0   | 5809  |      0 B/s |  2.8 MB/s   |   0 ns  | 132.0 us |   0 ns  |  48.0 us |      0 B |  511.0 B  |      0 ns      |       0 ns      |
+----------------------------------------------------------+--------------+--------------------------+--------------------+--------------------+----------------------+----------------+-----------------+
Total number of ITLs: 2

This example shows how to display the flow metrics of initiator ID 0xed0500, target ID 0xef0720, and LUN ID 0001-0000-0000-0000 of a target ITL:


switch# ShowAnalytics --info --target-itl --initiator 0xed0500 --target 0xef0720 --lun 0001-0000-0000-0000
2019-04-09 11:17:24.643292
 
B: Bytes, s: Seconds, Avg: Average, Acc: Accumulative,
ns: Nano Seconds, ms: Milli Seconds, us: Micro Seconds,
GB: Giga Bytes, MB: Mega Bytes, KB: Killo Bytes,
ECT: Exchange Completion Time, DAL: Data Access Latency
 
 
Interface : fc8/17
+-------------------------------+---------+---------+-----------+
| Metric                        |   Min   |   Max   |     Avg   |
+-------------------------------+---------+---------+-----------+
| Read  IOPS         (4sec Avg) |      NA |      NA |        39 |
| Write IOPS         (4sec Avg) |      NA |      NA |         0 |
| Read  Throughput   (4sec Avg) |      NA |      NA | 39.8 KB/s |
| Write Throughput   (4sec Avg) |      NA |      NA |         0 |
| Read  Size         (Acc Avg)  |  1024 B |  1024 B |    1024 B |
| Write Size         (Acc Avg)  |       0 |       0 |         0 |
| Read  DAL          (Acc Avg)  | 28.0 us | 30.0 ms |   23.8 ms |
| Write DAL          (Acc Avg)  |   0     |   0     |     0     |
| Read  ECT          (Acc Avg)  | 28.0 us | 30.0 ms |   23.8 ms |
| Write ECT          (Acc Avg)  |   0     |   0     |     0     |
| Read  Inter-IO-Gap (Acc Avg)  | 73.2 us |   2.0 s |   25.0 ms |
| Write Inter-IO-Gap (Acc Avg)  |   0     |   0     |     0     |
+-------------------------------+---------+---------+-----------+

This example shows how to display the flow metrics of initiator ID 0xc80004, target ID 0xed0004, and namespace 1 of a target ITN for NVMe:


switch# ShowAnalytics --info --target-itn --initiator 0xc80004 --target 0xed0004 --namespace 1
2019-04-09 11:17:24.643292
 
B: Bytes, s: Seconds, Avg: Average, Acc: Accumulative,
ns: Nano Seconds, ms: Milli Seconds, us: Micro Seconds,
GB: Giga Bytes, MB: Mega Bytes, KB: Killo Bytes,
ECT: Exchange Completion Time, DAL: Data Access Latency


Interface : fc3/15
+-------------------------------+----------+----------+------------+
| Metric                        |    Min   |    Max   |      Avg   |
+-------------------------------+----------+----------+------------+
| Read  IOPS         (4sec Avg) |       NA |       NA |       2391 |
| Write IOPS         (4sec Avg) |       NA |       NA |       2517 |
| Read  Throughput   (4sec Avg) |       NA |       NA | 149.5 MB/s |
| Write Throughput   (4sec Avg) |       NA |       NA | 157.3 MB/s |
| Read  Size         (Acc Avg)  |  65536 B |  65536 B |    65536 B |
| Write Size         (Acc Avg)  |  65536 B |  65536 B |    65536 B |
| Read  DAL          (Acc Avg)  |  12.0 us |   1.6 ms |    46.0 us |
| Write DAL          (Acc Avg)  |  10.0 us | 407.0 us |    40.1 us |
| Read  ECT          (Acc Avg)  |  39.0 us |   1.9 ms |   113.8 us |
| Write ECT          (Acc Avg)  | 123.0 us |   3.6 ms |     1.5 ms |
| Write Host Delay   (Acc Avg)  |  51.0 us |   3.5 ms |     1.3 ms |
| Write Array Delay  (Acc Avg)  |       NA |  31.0 us |     5.6 us |
| Write IO Seq count (Acc Avg)  |        0 |        0 |          1 |
+-------------------------------+----------+----------+------------+

This example shows how to display the flow metrics of initiator ID 0xe90440, target ID 0xe80b40, and LUN ID 0001-0000-0000-0000 of a target ITL:


switch# ShowAnalytics --info --target-itl --initiator 0xe90440 --target 0xe80b40 --lun 0001-0000-0000-0000
2019-04-09 11:17:24.643292
 
B: Bytes, s: Seconds, Avg: Average, Acc: Accumulative,
ns: Nano Seconds, ms: Milli Seconds, us: Micro Seconds,
GB: Giga Bytes, MB: Mega Bytes, KB: Killo Bytes,
ECT: Exchange Completion Time, DAL: Data Access Latency


Interface : fc5/21
+-------------------------------+---------+--------+----------+
| Metric                        |   Min   |  Max   |    Avg   |
+-------------------------------+---------+--------+----------+
| Read  IOPS         (4sec Avg) |      NA |     NA |        0 |
| Write IOPS         (4sec Avg) |      NA |     NA |     4112 |
| Read  Throughput   (4sec Avg) |      NA |     NA |        0 |
| Write Throughput   (4sec Avg) |      NA |     NA | 2.0 MB/s |
| Read  Size         (Acc Avg)  |       0 |      0 |        0 |
| Write Size         (Acc Avg)  |   512 B |  512 B |    512 B |
| Read  DAL          (Acc Avg)  |   0 ns  |  0 ns  |    0 ns  |
| Write DAL          (Acc Avg)  | 22.0 us | 2.4 ms |  46.1 us |
| Read  ECT          (Acc Avg)  |   0 ns  |  0 ns  |    0 ns  |
| Write ECT          (Acc Avg)  | 68.0 us | 2.5 ms | 126.6 us |
| Write Host Delay   (Acc Avg)  |   0 ns  |  0 ns  |    0 ns  |
| Write Array Delay  (Acc Avg)  |      NA |  0 ns  |    0 ns  |
| Write IO Seq count (Acc Avg)  |       0 |      0 |        0 |
+-------------------------------+---------+--------+----------+

This example shows how to display the flow metrics of initiator ID 0xc80005 and namespace 1 of a target ITN for NVMe:


switch# ShowAnalytics --info --target-itn --initiator 0xc80005  --namespace 1
2019-04-09 11:18:40.132828
 
 Interface fc3/15
+-----------------------------------------+--------------+--------------------------+---------------------+--------------------+----------------------+----------------+-----------------+
|VSAN | Initiator |  Target   | Namespace |   Avg IOPS   |      Avg Throughput      |       Avg ECT       |      Avg DAL       |     Avg IO Size      | Avg Host Delay | Avg Array Delay |
+-----------------------------------------+--------------+--------------------------+---------------------+--------------------+----------------------+----------------+-----------------+
|                                         | Read | Write |     Read   |   Write     |   Read   |   Write  |  Read   |   Write  |   Read   |   Write   |     Write      |      Write      |
|                                         |              |                          |                     |                    |                      |                |                 |
|3300 | 0xc80005  | 0xed0005  |  1        | 2451 | 2478  | 153.2 MB/s | 154.9 MB/s  | 114.0 us |   1.5 ms | 45.0 us |  40.0 us |  64.0 KB |  64.0 KB  |     1.3 ms     |      5.0 us     |
+-----------------------------------------+--------------+--------------------------+---------------------+--------------------+----------------------+----------------+-----------------+
Total number of ITNs: 1

This example shows how to display the flow metrics of initiator ID 0xe90440 and LUN ID 0001-0000-0000-0000 of a target ITL for SCSI:


switch# ShowAnalytics --info --target-itl --initiator 0xe90440  --lun 0001-0000-0000-0000
2019-04-09 11:18:40.132828
 
 Interface fc5/21
+----------------------------------------------------------+--------------+--------------------------+--------------------+--------------------+----------------------+----------------+-----------------+
|VSAN | Initiator | VMID |  Target   |         LUN         |   Avg IOPS   |      Avg Throughput      |      Avg ECT       |      Avg DAL       |     Avg IO Size      | Avg Host Delay | Avg Array Delay |
+----------------------------------------------------------+--------------+--------------------------+--------------------+--------------------+----------------------+----------------+-----------------+
|                                                          | Read | Write |     Read   |   Write     |  Read   |   Write  |  Read   |   Write  |   Read   |   Write   |     Write      |      Write      |
|                                                          |              |                          |                    |                    |                      |                |                 |
|2200 | 0xe90440  |   - | 0xe80b40  | 0001-0000-0000-0000  |  0   | 5816  |      0 B/s |  2.8 MB/s   |   0 ns  | 131.0 us |   0 ns  |  48.0 us |      0 B |  512.0 B  |      0 ns      |       0 ns      |
+----------------------------------------------------------+--------------+--------------------------+--------------------+--------------------+----------------------+----------------+-----------------+
Total number of ITLs: 1

For information on flow metrics, see Flow Metrics.

This example shows how to display the top ITNs for I/O operations per second (IOPS) for NVMe:


switch# ShowAnalytics  --top  --nvme 

2019-06-13 10:56:49.099069

+--------+-------------------------------------------+-------------------+
|  PORT  | VSAN | Initiator |  Target   | Namespace  |      Avg IOPS     |
+--------+-------------------------------------------+-------------------+
|        |                                           |   Read  |  Write  |
| fc3/15 | 3300 | 0xc80004  | 0xed0004  |   1        |   2547  |  2474   |
| fc3/15 | 3300 | 0xc80002  | 0xed0002  |   1        |   2521  |  2486   |
| fc3/15 | 3300 | 0xc80008  | 0xed0008  |   1        |   2506  |  2499   |
| fc3/15 | 3300 | 0xc80009  | 0xed0009  |   1        |   2516  |  2483   |
| fc3/15 | 3300 | 0xc80006  | 0xed0006  |   1        |   2516  |  2482   |
| fc3/15 | 3300 | 0xc80007  | 0xed0007  |   1        |   2508  |  2484   |
| fc3/15 | 3300 | 0xc80005  | 0xed0005  |   1        |   2481  |  2505   |
| fc3/15 | 3300 | 0xc80003  | 0xed0003  |   1        |   2469  |  2517   |
| fc3/15 | 3300 | 0xc80000  | 0xed0001  |   1        |   2057  |  2021   |
| fc3/15 | 3300 | 0xc80001  | 0xed0001  |   1        |   1893  |  1953   |
+--------+-------------------------------------------+-------------------+

This example shows how to display the top ITLs for I/O operations per second (IOPS):


switch# ShowAnalytics  --top 

2019-06-13 10:56:49.099069

+--------+-----------------------------------------+-------------------+
|  PORT  |        VSAN|Initiator|Target|LUN        |      Avg IOPS     |
+--------+-----------------------------------------+-------------------+
|        |                                         |   Read  |  Write  |
| fc8/10 | 5|0xed04b2|0xef0680|0001-0000-0000-0000 |   118   |   0     |
| fc8/10 | 5|0xed04b2|0xef0680|0003-0000-0000-0000 |   118   |   0     |
| fc8/10 | 5|0xed04b2|0xef0680|0002-0000-0000-0000 |   118   |   0     |
| fc8/10 | 5|0xed04b2|0xef0680|0005-0000-0000-0000 |   118   |   0     |
| fc8/10 | 5|0xed04b2|0xef0680|0006-0000-0000-0000 |   118   |   0     |
| fc8/10 | 5|0xed04b2|0xef0680|0007-0000-0000-0000 |   118   |   0     |
| fc8/10 | 5|0xed04b2|0xef0680|0008-0000-0000-0000 |   118   |   0     |
| fc8/10 | 5|0xed04b2|0xef0680|0009-0000-0000-0000 |   118   |   0     |
| fc8/10 | 5|0xed04b2|0xef0680|000a-0000-0000-0000 |   118   |   0     |
| fc8/10 | 5|0xed04b2|0xef0680|000b-0000-0000-0000 |   118   |   0     |
+--------+-----------------------------------------+-------------------+

This example shows how to display the top ITLs with I/O size:


switch# ShowAnalytics --top --key IOSIZE
Data collected at : Tue, 07 Jun 2022 12:16:09 +0530

+--------+-----------------------------------------------------+----------------------+
|  PORT  | VSAN | Initiator |  Target   |         LUN          |     Avg IO Size      |
+--------+-----------------------------------------------------+----------------------+
|        |                                                     |    Read  |  Write    |
| fc2/2  | 2200 | 0xc80760  | 0xee0000  | 0003-0000-0000-0000  |      0 B |  5.8 KB   |
| fc2/19 | 2200 | 0xee024b  | 0xe80441  | 000c-0000-0000-0000  |      0 B |  4.0 KB   |
| fc2/19 | 2200 | 0xee0252  | 0xe80926  | 0018-0000-0000-0000  |      0 B |  4.0 KB   |
| fc2/19 | 2200 | 0xee024c  | 0xe80920  | 002f-0000-0000-0000  |      0 B |  4.0 KB   |
| fc2/20 | 2200 | 0xee0253  | 0xe80927  | 0051-0000-0000-0000  |      0 B |  4.0 KB   |0
| fc2/20 | 2200 | 0xee0253  | 0xe80927  | 000f-0000-0000-0000  |      0 B |  4.0 KB   |
| fc2/19 | 2200 | 0xee024c  | 0xe80920  | 0006-0000-0000-0000  |      0 B |  4.0 KB   |
| fc2/20 | 2200 | 0xee024c  | 0xe80920  | 0049-0000-0000-0000  |      0 B |  4.0 KB   |
| fc2/19 | 2200 | 0xee0250  | 0xe80924  | 0029-0000-0000-0000  |      0 B |  4.0 KB   |
| fc2/19 | 2200 | 0xee0251  | 0xe80925  | 0034-0000-0000-0000  |      0 B |  4.0 KB   |
+--------+-----------------------------------------------------+----------------------+

This example shows how to display the initiator flow of ITLs :


switch# ShowAnalytics --top --initiator-flow

Data collected at : Tue, 07 Jun 2022 12:20:28 +0530

+---------+-------------------+-------------------+
|   PORT  | VSAN | Initiator  |      Avg IOPS     |
+---------+-------------------+-------------------+
|         |                   |   Read  |  Write  |
|  fc1/29 | 2200 | 0xc803e0   |    0    | 29037   |
|  fc1/29 | 2200 | 0xc803e1   |    0    | 19919   |
|  fc2/2  | 2200 | 0xc80760   |    0    |   31    |
| fc12/17 | 2200 | 0xc80600   |    0    |   0     |
|  fc2/20 | 2200 | 0xee01cc   |    0    |   0     |
|  fc2/20 | 2200 | 0xee006e   |    0    |   0     |
|  fc2/19 | 2200 | 0xee0272   |    0    |   0     |
|  fc2/20 | 2200 | 0xee02b2   |    0    |   0     |
|  fc2/20 | 2200 | 0xee02d1   |    0    |   0     |
|  fc2/19 | 2200 | 0xee02b3   |    0    |   0     |
+---------+-------------------+-------------------+

This example shows how to display the target flow of ITLs :


switch# ShowAnalytics --top --target-flow

Data collected at : Tue, 07 Jun 2022 12:20:42 +0530

+--------+-------------------+-------------------+
|  PORT  | VSAN |  Target    |      Avg IOPS     |
+--------+-------------------+-------------------+
|        |                   |   Read  |  Write  |
| fc1/22 | 2200 | 0xc80329   |    0    | 20269   |
| fc1/23 | 2200 | 0xc80349   |    0    | 20262   |
| fc1/24 | 2200 | 0xc80369   |    0    | 20196   |
| fc1/34 | 2200 | 0xc804a9   |    0    | 20177   |
| fc1/36 | 2200 | 0xc804c9   |    0    | 20165   |
| fc1/35 | 2200 | 0xc80589   |    0    | 20095   |
| fc1/33 | 2200 | 0xc80469   |    0    | 20042   |
| fc1/1  | 2200 | 0xc80029   |    0    | 18684   |
| fc1/2  | 2200 | 0xc80069   |    0    | 18663   |
| fc1/15 | 2200 | 0xc80249   |    0    | 18654   |
+--------+-------------------+-------------------+

This example shows how to display the flow of ITLs :


switch# ShowAnalytics --top --it-flow
Data collected at : Tue, 07 Jun 2022 12:21:58 +0530

+--------+-------------------------------+-------------------+
|  PORT  | VSAN | Initiator |  Target    |      Avg IOPS     |
+--------+-------------------------------+-------------------+
|        |                               |   Read  |  Write  |
| fc1/29 | 2200 | 0xc803e0  |  0xc80700  |    0    | 28321   |
| fc1/22 | 2200 | 0xc809e9  |  0xc80329  |    0    | 20274   |
| fc1/24 | 2200 | 0xc80a29  |  0xc80369  |    0    | 20244   |
| fc1/23 | 2200 | 0xc80a09  |  0xc80349  |    0    | 20244   |
| fc1/34 | 2200 | 0xc80b49  |  0xc804a9  |    0    | 20181   |
| fc1/36 | 2200 | 0xc80b89  |  0xc804c9  |    0    | 20173   |
| fc1/35 | 2200 | 0xc80b69  |  0xc80589  |    0    | 20054   |
| fc1/33 | 2200 | 0xc80b29  |  0xc80469  |    0    | 20019   |
| fc1/29 | 2200 | 0xc803e1  |  0xc80701  |    0    | 19425   |
| fc1/1  | 2200 | 0xc80ac9  |  0xc80029  |    0    | 18659   |
+--------+-------------------------------+-------------------+

This example shows how to display the initiator, target and LUN flow of ITLs :


switch# ShowAnalytics --top --noclear
Data collected at : Tue, 07 Jun 2022 12:27:38 +0530

+--------+-----------------------------------------------------+-------------------+
|  PORT  | VSAN | Initiator |  Target   |         LUN          |      Avg IOPS     |
+--------+-----------------------------------------------------+-------------------+
|        |                                                     |   Read  |  Write  |
| fc1/29 | 2200 | 0xc803e0  | 0xc80700  | 0064-0000-0000-0000  |    0    |  567    |
| fc1/29 | 2200 | 0xc803e1  | 0xc80701  | 003b-0000-0000-0000  |    0    |  283    |
| fc1/29 | 2200 | 0xc803e0  | 0xc80700  | 004e-0000-0000-0000  |    0    |  283    |
| fc1/29 | 2200 | 0xc803e0  | 0xc80700  | 0043-0000-0000-0000  |    0    |  283    |
| fc1/29 | 2200 | 0xc803e1  | 0xc80701  | 0038-0000-0000-0000  |    0    |  283    |
| fc1/29 | 2200 | 0xc803e1  | 0xc80701  | 0040-0000-0000-0000  |    0    |  283    |
| fc1/29 | 2200 | 0xc803e0  | 0xc80700  | 0061-0000-0000-0000  |    0    |  283    |
| fc1/29 | 2200 | 0xc803e0  | 0xc80700  | 0014-0000-0000-0000  |    0    |  283    |
| fc1/29 | 2200 | 0xc803e1  | 0xc80701  | 001e-0000-0000-0000  |    0    |  283    |
| fc1/29 | 2200 | 0xc803e0  | 0xc80700  | 001d-0000-0000-0000  |    0    |  283    |
+--------+-----------------------------------------------------+-------------------+


Data collected at : Tue, 07 Jun 2022 12:27:45 +0530

+--------+-----------------------------------------------------+-------------------+
|  PORT  | VSAN | Initiator |  Target   |         LUN          |      Avg IOPS     |
+--------+-----------------------------------------------------+-------------------+
|        |                                                     |   Read  |  Write  |
| fc1/29 | 2200 | 0xc803e0  | 0xc80700  | 0064-0000-0000-0000  |    0    |  554    |
| fc1/29 | 2200 | 0xc803e1  | 0xc80701  | 003b-0000-0000-0000  |    0    |  277    |
| fc1/29 | 2200 | 0xc803e0  | 0xc80700  | 004e-0000-0000-0000  |    0    |  277    |
| fc1/29 | 2200 | 0xc803e0  | 0xc80700  | 0043-0000-0000-0000  |    0    |  277    |
| fc1/29 | 2200 | 0xc803e1  | 0xc80701  | 0038-0000-0000-0000  |    0    |  277    |
| fc1/29 | 2200 | 0xc803e1  | 0xc80701  | 0040-0000-0000-0000  |    0    |  277    |
| fc1/29 | 2200 | 0xc803e0  | 0xc80700  | 0061-0000-0000-0000  |    0    |  277    |
| fc1/29 | 2200 | 0xc803e0  | 0xc80700  | 0014-0000-0000-0000  |    0    |  277    |
| fc1/29 | 2200 | 0xc803e1  | 0xc80701  | 001e-0000-0000-0000  |    0    |  277    |
| fc1/29 | 2200 | 0xc803e0  | 0xc80700  | 001d-0000-0000-0000  |    0    |  277    |
+--------+-----------------------------------------------------+-------------------+

This example shows how to display the top ITNs for throughput progressively for NMVe:


switch# ShowAnalytics  --top --key thput  --progress --nvme

2019-06-13 10:58:16.015546

+--------+-------------------------------------------+-------------------------+
|  PORT  | VSAN | Initiator |  Target   | Namespace  |      Avg Throughput     |
+--------+-------------------------------------------+-------------------------+
|        |                                           |     Read   |   Write    |
| fc3/15 | 3300 | 0xc80003  | 0xed0003  |   1        | 159.1 MB/s | 154.6 MB/s |
| fc3/15 | 3300 | 0xc80002  | 0xed0002  |   1        | 157.4 MB/s | 155.0 MB/s |
| fc3/15 | 3300 | 0xc80006  | 0xed0006  |   1        | 157.7 MB/s | 154.3 MB/s |
| fc3/15 | 3300 | 0xc80004  | 0xed0004  |   1        | 157.1 MB/s | 154.8 MB/s |
| fc3/15 | 3300 | 0xc80007  | 0xed0007  |   1        | 155.5 MB/s | 155.4 MB/s |
| fc3/15 | 3300 | 0xc80009  | 0xed0009  |   1        | 153.8 MB/s | 156.6 MB/s |
| fc3/15 | 3300 | 0xc80008  | 0xed0008  |   1        | 152.2 MB/s | 157.1 MB/s |
| fc3/15 | 3300 | 0xc80005  | 0xed0005  |   1        | 150.9 MB/s | 158.1 MB/s |
| fc3/15 | 3300 | 0xc80000  | 0xed0001  |   1        | 133.7 MB/s | 133.3 MB/s |
| fc3/15 | 3300 | 0xc80001  | 0xed0001  |   1        | 118.4 MB/s | 120.2 MB/s |
+--------+-------------------------------------------+-------------------------+

This example shows how to display the top ITLs for throughput progressively:


switch# ShowAnalytics  --top --key thput  --progress

2019-06-13 10:58:16.015546

+--------+-----------------------------------------+-------------------------+
|  PORT  |        VSAN|Initiator|Target|LUN        |      Avg THROUGHPUT     |
+--------+-----------------------------------------+-------------------------+
|        |                                         |     Read   |   Write    |
| fc8/10 | 5|0xed04b2|0xef0680|000f-0000-0000-0000 | 133.8 KB/s |     0      |
| fc8/10 | 5|0xed04b3|0xef0681|000a-0000-0000-0000 | 133.8 KB/s |     0      |
| fc8/10 | 5|0xed04b3|0xef0681|0014-0000-0000-0000 | 133.8 KB/s |     0      |
| fc8/10 | 5|0xed04b4|0xef0682|000f-0000-0000-0000 | 133.8 KB/s |     0      |
| fc8/10 | 5|0xed04b5|0xef0683|000a-0000-0000-0000 | 133.8 KB/s |     0      |
| fc8/10 | 5|0xed04b5|0xef0683|000f-0000-0000-0000 | 133.8 KB/s |     0      |
| fc8/10 | 5|0xed04b5|0xef0683|0013-0000-0000-0000 | 133.8 KB/s |     0      |
| fc8/10 | 5|0xed04b6|0xef0684|0013-0000-0000-0000 | 133.8 KB/s |     0      |
| fc8/10 | 5|0xed04b2|0xef0680|0004-0000-0000-0000 | 133.5 KB/s |     0      |
| fc8/10 | 5|0xed04b3|0xef0681|0009-0000-0000-0000 | 133.5 KB/s |     0      |
+--------+-----------------------------------------+-------------------------+

This example shows how to display the ITNs with the highest I/O operations per second (IOPS) for NVMe. The --alias option causes initiator and target device alias information is displayed.


switch# ShowAnalytics --top --alias --nvme

2021-02-09 09:15:25.445815

+--------+-----------------------------------------------------------------+-------------------+
|  PORT  | VSAN |      Initiator       |        Target        | Namespace  |      Avg IOPS     |
+--------+-----------------------------------------------------------------+-------------------+
|        |                                                                 |   Read  |  Write  |
| fc3/15 | 3300 | sanblaze-147-port7-p | sanblaze-147-port6-p |   1        |   2518  |  2459   |
| fc3/15 | 3300 | sanblaze-147-port7-p | sanblaze-147-port6-p |   1        |   2499  |  2470   |
| fc3/15 | 3300 | sanblaze-147-port7-p | sanblaze-147-port6-p |   1        |   2491  |  2472   |
| fc3/15 | 3300 | sanblaze-147-port7-p | sanblaze-147-port6-p |   1        |   2491  |  2471   |
| fc3/15 | 3300 | sanblaze-147-port7-p | sanblaze-147-port6-p |   1        |   2457  |  2487   |
| fc3/15 | 3300 | sanblaze-147-port7-p | sanblaze-147-port6-p |   1        |   2445  |  2496   |
| fc3/15 | 3300 | sanblaze-147-port7-p | sanblaze-147-port6-p |   1        |   2440  |  2495   |
| fc3/15 | 3300 | sanblaze-147-port7-p | sanblaze-147-port6-p |   1        |   2434  |  2499   |
| fc3/15 | 3300 | sanblaze-147-port7-p | sanblaze-147-port6-p |   1        |   2197  |  2199   |
| fc3/15 | 3300 | sanblaze-147-port7-p | sanblaze-147-port6-p |   1        |   1987  |  1982   |
+--------+-----------------------------------------------------------------+-------------------+

This example shows how to display the ITLs with the highest I/O operations per second (IOPS) for SCSI. The --alias option causes initiator and target device alias information is displayed.


switch# ShowAnalytics --top --alias

2021-02-09 09:15:25.445815

+--------+----------------------------------------------------------------------------------+-------------------+
|  PORT  | VSAN |      Initiator       | VMID |        Target        |         LUN          |      Avg IOPS     |
+--------+----------------------------------------------------------------------------------+-------------------+
|        |                                                                                  |   Read  |  Write  |
| fc5/22 | 2200 |       0xe90460       |   - |       0xe80b60       | 0002-0000-0000-0000   |    0    |  9124   |
| fc5/22 | 2200 |       0xe90460       |   - |       0xe80b60       | 0003-0000-0000-0000   |    0    |  9124   |
| fc5/22 | 2200 |       0xe90460       |   - |       0xe80b60       | 0001-0000-0000-0000   |    0    |  9123   |
| fc5/21 | 2200 |       0xe902e0       |   - | Tgt_9706_206_fc5_21_ | 0003-0000-0000-0000   |    0    |  5718   |
| fc5/21 | 2200 |       0xe902e0       |   - | Tgt_9706_206_fc5_21_ | 0001-0000-0000-0000   |    0    |  5718   |
| fc5/21 | 2200 |       0xe906c0       |   - | Tgt_9706_206_fc5_21_ | 0002-0000-0000-0000   |    0    |  5718   |
| fc5/21 | 2200 |       0xe902e0       |   - | Tgt_9706_206_fc5_21_ | 0002-0000-0000-0000   |    0    |  5717   |
| fc5/21 | 2200 |       0xe90440       |   - | Tgt_9706_206_fc5_21_ | 0001-0000-0000-0000   |    0    |  5717   |
| fc5/21 | 2200 |       0xe90440       |   - | Tgt_9706_206_fc5_21_ | 0002-0000-0000-0000   |    0    |  5717   |
| fc5/21 | 2200 |       0xe906c0       |   - | Tgt_9706_206_fc5_21_ | 0001-0000-0000-0000   |    0    |  5717   |
+--------+----------------------------------------------------------------------------------+-------------------+

This example shows how to display the ITLs with the highest I/O operations per second (IOPS). The --alias option causes initiator and target device alias information is displayed.


switch# ShowAnalytics --top --alias

2021-02-09 09:15:25.445815

+-------+----------------------------------------------------------------------------------+-------------------+
|  PORT | VSAN |      Initiator       | VMID |        Target        |         LUN          |      Avg IOPS     |
+-------+----------------------------------------------------------------------------------+-------------------+
|       |                                                                                  |   Read  |  Write  |
| fc1/2 |   20 | tie-2000012341newdev |  89 | tie-2000012341newdev | 0000-0000-0000-0000   |    0    |  1769   |
| fc1/1 |   20 | tie-2000012341newdev |  89 | tie-2000012341newdev | 0000-0000-0000-0000   |    0    |  1769   |
+-------+----------------------------------------------------------------------------------+-------------------+

This example shows how to display the errors for all target ITNs and limit the output to ten random records for NVMe:


switch# ShowAnalytics --errors --target-itn --limit 10
2019-05-23 11:28:34.926267

 Interface fc3/15
+-------------------------------------------+---------------------+-----------------+
| VSAN | Initiator |  Target   | Namespace  | Total NVMe Failures | Total FC Aborts |
+-------------------------------------------+---------------------+-----------------+
|                                           |     Read | Write    |   Read | Write  |
|                                           |                     |                 |
| 3300 | 0xc80005  | 0xed0005  |   1        |        0 | 0        |    0   |  0     |
| 3300 | 0xc80000  | 0xed0001  |   1        |        0 | 0        |    0   |  0     |
| 3300 | 0xc80004  | 0xed0004  |   1        |        0 | 0        |    0   |  0     |
| 3300 | 0xc80001  | 0xed0001  |   1        |        0 | 0        |    0   |  0     |
| 3300 | 0xc80003  | 0xed0003  |   1        |        0 | 0        |    0   |  0     |
| 3300 | 0xc80000  | 0xed0000  |   1        |        0 | 0        |   1260 | 1210   |
| 3300 | 0xc80007  | 0xed0007  |   1        |        0 | 0        |    0   |  0     |
| 3300 | 0xc80008  | 0xed0008  |   1        |        0 | 0        |    0   |  0     |
| 3300 | 0xc80002  | 0xed0002  |   1        |        0 | 0        |    0   |  0     |
| 3300 | 0xc80006  | 0xed0006  |   1        |        0 | 0        |    0   |  0     |
+-------------------------------------------+---------------------+-----------------+

This example shows how to display the errors for all target ITLs and limit the output to ten random records:


switch# ShowAnalytics --errors --target-itl --limit 10
2019-05-23 11:28:34.926267

 Interface fc8/7
+-----------------------------------------+---------------------+-----------------+
|        VSAN|Initiator|Target|LUN        | Total SCSI Failures | Total FC Aborts |
+-----------------------------------------+---------------------+-----------------+
|                                         |     Read | Write    |   Read | Write  |
|                                         |                     |                 |
| 5|0xed0332|0xef0592|000f-0000-0000-0000 |        0 | 0        |      0 | 0      |
| 5|0xed0342|0xef05a2|000a-0000-0000-0000 |        0 | 0        |      0 | 0      |
| 5|0xed0332|0xef0592|0008-0000-0000-0000 |        0 | 0        |      0 | 0      |
| 5|0xed0340|0xef05a0|0010-0000-0000-0000 |        0 | 0        |      0 | 0      |
| 5|0xed0322|0xef0582|0008-0000-0000-0000 |        0 | 0        |      0 | 0      |
| 5|0xed032c|0xef058c|0014-0000-0000-0000 |        0 | 0        |      0 | 0      |
| 5|0xed033a|0xef059a|000d-0000-0000-0000 |        0 | 0        |      0 | 0      |
| 5|0xed034a|0xef05aa|0005-0000-0000-0000 |        0 | 0        |      0 | 0      |
| 5|0xed033a|0xef059a|0007-0000-0000-0000 |        0 | 0        |      0 | 0      |
| 5|0xed034a|0xef05aa|0013-0000-0000-0000 |        0 | 0        |      0 | 0      |
+-----------------------------------------+---------------------+-----------------+

This example shows how to display all ITNs with nonzero NVMe failure and revert counts:


switch# ShowAnalytics --errorsonly --initiator-itn 
2019-04-09 11:27:42.496294
 
 Interface fc16/12
+-------------------------------------------+---------------------+-----------------+
| VSAN | Initiator |  Target   | Namespace  | Total NVMe Failures | Total FC Aborts |
+-------------------------------------------+---------------------+-----------------+
|                                           |     Read | Write    |   Read | Write  |
|                                           |                     |                 |
| 3300 | 0xc80000  | 0xed0000  |   1        |        0 | 0        |   1635 | 1631   |
+-------------------------------------------+---------------------+-----------------+

This example shows how to display all ITLs with nonzero SCSI failure and revert counts:


switch# ShowAnalytics --errorsonly --initiator-itl 
2019-04-09 11:27:42.496294
 
 Interface fc8/27
+-------------------------------------------+---------------------+-----------------+
|         VSAN|Initiator|Target|LUN         | Total SCSI Failures | Total FC Aborts |
+-------------------------------------------+---------------------+-----------------+
|                                           |     Read | Write    |   Read | Write  |
|                                           |                     |                 |
| 311|0x900000|0xc90000|0000-0000-0000-0000 |       0  | 42       |      0 | 0      |
+-------------------------------------------+---------------------+-----------------+

This example shows how to display 10 random ITLs with nonzero SCSI failure and revert counts. The device-alias (if any) is included for both the initiator and target.


switch# ShowAnalytics --errorsonly --initiator-itl --alias --limit 10
2019-04-09 12:06:19.847350

Interface fc1/26
+-------------------------------------------+-------------------+---------------+----------------------+-------------------+
|         VSAN|Initiator|Target|LUN         |Total SCSI Failures|Total FC Aborts|Initiator Device alias|Target Device alias|
+-------------------------------------------+-------------------+---------------+----------------------+-------------------+
|                                           |     Read | Write  |   Read | Write|                      |                   |
|                                           |                   |               |                      |                   |
| 108|0xee0467|0x70039b|0001-0000-0000-0000 |       0  | 1      |      0 | 0    |                      | SB_112_port_T_18_7|
| 108|0xee0401|0xbc092b|0002-0000-0000-0000 |       10 | 16     |      0 | 0    |                      | SB_112_port_T_0_1 |
| 108|0xee0441|0xbc092b|0003-0000-0000-0000 |       3  | 13     |      0 | 0    |   SB_112_port_I_7_1  | SB_112_port_T_0_1 |
| 108|0xee0401|0xbc0996|0001-0000-0000-0000 |       3  | 0      |      0 | 0    |                      |                   |
| 108|0xee0441|0xbc0996|0002-0000-0000-0000 |       0  | 3      |      0 | 0    |   SB_112_port_I_7_1  |                   |
| 108|0xee0481|0xbc0996|0004-0000-0000-0000 |       0  | 4      |      0 | 0    |                      |                   |
| 108|0xee0403|0xbc092d|0000-0000-0000-0000 |       12 | 8      |      0 | 0    |                      | SB_112_port_T_0_3 |
| 108|0xee0443|0xbc092d|0001-0000-0000-0000 |       3  | 12     |      0 | 0    |   SB_112_port_I_7_3  | SB_112_port_T_0_3 |
| 108|0xee0443|0xbc0998|0000-0000-0000-0000 |       1  | 0      |      0 | 0    |   SB_112_port_I_7_3  |                   |
+-------------------------------------------+-------------------+---------------+----------------------+-------------------+

This example shows how to display 10 random ITNs with nonzero NVMe failure and revert counts. The device-alias (if any) is included for both the initiator and target.


switch# ShowAnalytics --errorsonly --initiator-itn --alias --limit 10
2019-04-09 12:06:19.847350
 Interface fc16/12
+-----------------------------------------------------------------+---------------------+-----------------+
| VSAN |      Initiator       |        Target        | Namespace  | Total NVMe Failures | Total FC Aborts |
+-----------------------------------------------------------------+---------------------+-----------------+
|                                                                 |     Read | Write    |   Read | Write  |
|                                                                 |                     |                 |
| 3300 | sanblaze-147-port7-p | sanblaze-147-port6-p |   1        |        0 | 0        |   1635 | 1631   |
+-----------------------------------------------------------------+---------------------+-----------------+

This example shows how to display 10 random ITLs with nonzero SCSI failure and terminate counts. The device-alias (if any) is included for both the initiator and target.


switch# ShowAnalytics --errorsonly --initiator-itl --alias --limit 10
2019-04-09 12:06:19.847350

 Interface fc7/16
+---------------------------------------------------------------------------+---------------------+-----------------+
| VSAN |      Initiator       |        Target        |         LUN          | Total SCSI Failures | Total FC Aborts |
+---------------------------------------------------------------------------+---------------------+-----------------+
|                                                                           |     Read | Write    |   Read | Write  |
|                                                                           |                     |                 |
| 2200 |       0xe90440       | Tgt_9706_206_fc5_21_ | 0001-0000-0000-0000  |      0   | 5928     |      0 | 0      |
| 2200 |       0xe90440       | Tgt_9706_206_fc5_21_ | 0002-0000-0000-0000  |      0   | 5926     |      0 | 0      |
+---------------------------------------------------------------------------+---------------------+-----------------+

This example shows how to display the minimum, maximum, and peak flow metrics of target ID 0xef0720 of a target ITL:


switch# ShowAnalytics --minmax --target-itl --target 0xef0720
2019-04-09 11:22:08.652598
 
 Interface fc8/17
+-----------------------------------------+---------------+------------------+-------------------+--------------+
|        VSAN|Initiator|Target|LUN        |   Peak IOPS*  | Peak Throughput* |   Read ECT*       |   Write ECT* |
+-----------------------------------------+---------------+------------------+-------------------+--------------+
|                                         |  Read | Write |   Read   | Write |   Min   |  Max    |  Min |  Max  |
|                                         |               |                  |                   |              |
| 5|0xed0500|0xef0720|0001-0000-0000-0000 | 11106 |  0    |10.8 MB/s |   0   | 28.0 us | 30.0 ms |   0  |   0   |
| 5|0xed0500|0xef0720|0002-0000-0000-0000 |  9232 |  0    | 9.0 MB/s |   0   | 28.0 us | 30.0 ms |   0  |   0   |
| 5|0xed0500|0xef0720|0003-0000-0000-0000 |  7421 |  0    | 7.2 MB/s |   0   | 28.0 us | 30.0 ms |   0  |   0   |
| 5|0xed0500|0xef0720|0004-0000-0000-0000 |  5152 |  0    | 5.0 MB/s |   0   | 29.0 us | 30.0 ms |   0  |   0   |
| 5|0xed0500|0xef0720|0005-0000-0000-0000 |  5163 |  0    | 5.0 MB/s |   0   | 30.0 us | 30.0 ms |   0  |   0   |
| 5|0xed0500|0xef0720|0006-0000-0000-0000 |  5154 |  0    | 5.0 MB/s |   0   | 30.0 us | 30.0 ms |   0  |   0   |
| 5|0xed0500|0xef0720|0007-0000-0000-0000 |  4801 |  0    | 4.7 MB/s |   0   | 29.0 us | 30.0 ms |   0  |   0   |
| 5|0xed0500|0xef0720|0008-0000-0000-0000 |  3838 |  0    | 3.7 MB/s |   0   | 64.0 us | 30.0 ms |   0  |   0   |
| 5|0xed0500|0xef0720|0009-0000-0000-0000 |  3053 |  0    | 3.0 MB/s |   0   | 40.0 us | 30.0 ms |   0  |   0   |
| 5|0xed0500|0xef0720|000a-0000-0000-0000 |  3061 |  0    | 3.0 MB/s |   0   | 33.0 us | 30.0 ms |   0  |   0   |
| 5|0xed0500|0xef0720|000b-0000-0000-0000 |  3053 |  0    | 3.0 MB/s |   0   | 30.0 us | 30.0 ms |   0  |   0   |
| 5|0xed0500|0xef0720|000c-0000-0000-0000 |  3058 |  0    | 3.0 MB/s |   0   | 37.0 us | 30.0 ms |   0  |   0   |
| 5|0xed0500|0xef0720|000d-0000-0000-0000 |  3058 |  0    | 3.0 MB/s |   0   | 29.0 us | 30.0 ms |   0  |   0   |
| 5|0xed0500|0xef0720|000e-0000-0000-0000 |  2517 |  0    | 2.5 MB/s |   0   | 29.0 us | 30.0 ms |   0  |   0   |
| 5|0xed0500|0xef0720|000f-0000-0000-0000 |  2405 |  0    | 2.3 MB/s |   0   | 29.0 us | 30.0 ms |   0  |   0   |
| 5|0xed0500|0xef0720|0010-0000-0000-0000 |  2410 |  0    | 2.4 MB/s |   0   | 36.0 us | 30.0 ms |   0  |   0   |
| 5|0xed0500|0xef0720|0011-0000-0000-0000 |  2405 |  0    | 2.3 MB/s |   0   | 33.0 us | 30.0 ms |   0  |   0   |
| 5|0xed0500|0xef0720|0012-0000-0000-0000 |  2411 |  0    | 2.4 MB/s |   0   | 30.0 us | 30.0 ms |   0  |   0   |
| 5|0xed0500|0xef0720|0013-0000-0000-0000 |  2408 |  0    | 2.4 MB/s |   0   | 37.0 us | 30.0 ms |   0  |   0   |
| 5|0xed0500|0xef0720|0014-0000-0000-0000 |  2284 |  0    | 2.2 MB/s |   0   | 29.0 us | 30.0 ms |   0  |   0   |
+-----------------------------------------+---------------+------------------+-------------------+--------------+
*These values are calculated since the metrics were last cleared.

This example shows how to display the minimum, maximum, and peak flow metrics of target ID 0xed0000 of a target ITN for NVMe:


switch# ShowAnalytics --minmax --target-itn --target 0xed0000
2019-04-09 11:22:08.652598
  Interface fc3/15
+-----------------------------------------+---------------------+--------------------------+--------------------+--------------------+--------------------+--------------------+--------------------+
|VSAN | Initiator |  Target   | Namespace |      Peak IOPS*     |     Peak Throughput*     |     Read ECT*      |     Write ECT*     |    Host Delay*     |    Array Delay*    | Write IO sequence* |
+-----------------------------------------+---------------------+--------------------------+--------------------+--------------------+--------------------+--------------------+--------------------+
|                                         |   Read   |  Write   |     Read   |   Write     |   Min   |    Max   |  Min    |    Max   |  Min    |    Max   |  Min    |    Max   |  Min    |    Max   |
|                                         |                     |                          |                    |                    |                    |                    |                    |
|3300 | 0xc80000  | 0xed0000  |  1        |   383    |   379    |  24.0 MB/s |  23.7 MB/s  |  2.6 ms |  26.7 ms |  3.5 ms |  28.7 ms | 12.0 us |   3.1 ms |   NA    |   1.4 ms |    0    |    0     |
+-----------------------------------------+---------------------+--------------------------+--------------------+--------------------+--------------------+--------------------+--------------------+
Total number of ITNs: 1
*These values are calculated since the metrics were last cleared.

This example shows how to display the minimum, maximum, and peak flow metrics of target ID 0xe80b40 of a target ITL for SCSI:


switch# ShowAnalytics --minmax --target-itl --target 0xe80b40
2019-04-09 11:22:08.652598
 
 Interface fc5/21
+----------------------------------------------------------+-------------+--------------------------+--------------------+--------------------+--------------------+--------------------+--------------------+
|VSAN | Initiator | VMID |  Target   |         LUN         |  Peak IOPS* |     Peak Throughput*     |     Read ECT*      |     Write ECT*     |    Host Delay*     |    Array Delay*    | Write IO sequence* |
+----------------------------------------------------------+-------------+--------------------------+--------------------+--------------------+--------------------+--------------------+--------------------+
|                                                          |Read | Write |     Read   |   Write     |   Min   |    Max   |  Min    |    Max   |  Min    |    Max   |  Min    |    Max   |  Min    |    Max   |
|                                                          |             |                          |                    |                    |                    |                    |                    |
|2200 | 0xe90440  |   - | 0xe80b40  | 0001-0000-0000-0000  |  0   | 8361 |      0 B/s |  4.1 MB/s   |   0 ns  |    0 ns  | 68.0 us |   2.6 ms |   0 ns  |    0 ns  |   NA    |    0 ns  |    0    |    0     |
|2200 | 0xe90440  |   - | 0xe80b40  | 0002-0000-0000-0000  |  0   | 7814 |      0 B/s |  3.8 MB/s   |   0 ns  |    0 ns  | 69.0 us |   2.6 ms |   0 ns  |    0 ns  |   NA    |    0 ns  |    0    |    0     |
+----------------------------------------------------------+-------------+--------------------------+--------------------+--------------------+--------------------+--------------------+--------------------+
Total number of ITLs: 2
*These values are calculated since the metrics were last cleared.

This example shows how to display the device alias information, minimum, maximum, and peak flow metrics of interface fc3/15 of a target ITN and limit the output to 10 random records for NVMe:


switch# ShowAnalytics --minmax --target-itn --alias  --interface fc3/15 --limit 10
2019-04-09 12:01:40.609197

 Interface fc3/15
+---------------------------------------------------------------+-----------------------+--------------------------+--------------------+---------------------+--------------------+--------------------+--------------------+
|VSAN |      Initiator       |        Target        | Namespace |       Peak IOPS*      |     Peak Throughput*     |     Read ECT*      |      Write ECT*     |    Host Delay*     |    Array Delay*    | Write IO sequence* |
+---------------------------------------------------------------+-----------------------+--------------------------+--------------------+---------------------+--------------------+--------------------+--------------------+
|                                                               |   Read    |   Write   |     Read   |   Write     |   Min   |    Max   |   Min    |    Max   |  Min    |    Max   |  Min    |    Max   |  Min    |    Max   |
|                                                               |                       |                          |                    |                     |                    |                    |                    |
|3300 | sanblaze-147-port7-p | sanblaze-147-port6-p |  1        |   2674    |   2595    | 167.1 MB/s | 162.2 MB/s  | 38.0 us |   2.3 ms |  69.0 us |   3.9 ms | 12.0 us |   3.7 ms |   NA    |  36.0 us |    0    |    0     |
|3300 | sanblaze-147-port7-p | sanblaze-147-port6-p |  1        |   10199   |   10163   | 637.4 MB/s | 635.2 MB/s  |  9.0 us |   2.4 ms |  65.0 us |   3.9 ms | 12.0 us |   3.7 ms |   NA    |  32.0 us |    0    |    0     |
|3300 | sanblaze-147-port7-p | sanblaze-147-port6-p |  1        |   2618    |   2587    | 163.6 MB/s | 161.7 MB/s  | 39.0 us |   2.4 ms |  69.0 us |   3.8 ms | 12.0 us |   3.6 ms |   NA    |  34.0 us |    0    |    0     |
|3300 | sanblaze-147-port7-p | sanblaze-147-port6-p |  1        |   2288    |   2287    | 143.0 MB/s | 143.0 MB/s  | 37.0 us |   2.4 ms |  69.0 us |   4.0 ms | 12.0 us |   3.7 ms |   NA    |  35.0 us |    0    |    0     |
|3300 | sanblaze-147-port7-p | sanblaze-147-port6-p |  1        |   2624    |   2583    | 164.0 MB/s | 161.4 MB/s  | 38.0 us |   2.5 ms | 108.0 us |   3.6 ms | 12.0 us |   3.4 ms |   NA    |  33.0 us |    0    |    0     |
|3300 | sanblaze-147-port7-p | sanblaze-147-port6-p |  1        |    383    |    379    |  24.0 MB/s |  23.7 MB/s  |  2.6 ms |  27.0 ms |   3.5 ms |  28.7 ms | 12.0 us |   3.1 ms |   NA    |   1.4 ms |    0    |    0     |
|3300 | sanblaze-147-port7-p | sanblaze-147-port6-p |  1        |   2624    |   2587    | 164.0 MB/s | 161.7 MB/s  | 38.0 us |   2.4 ms |  69.0 us |   3.7 ms | 12.0 us |   3.5 ms |   NA    |  39.0 us |    0    |    0     |
|3300 | sanblaze-147-port7-p | sanblaze-147-port6-p |  1        |   2621    |   2597    | 163.8 MB/s | 162.3 MB/s  | 38.0 us |   2.4 ms |  77.0 us |   3.9 ms | 12.0 us |   3.5 ms |   NA    |  31.0 us |    0    |    0     |
|3300 | sanblaze-147-port7-p | sanblaze-147-port6-p |  1        |   2646    |   2590    | 165.4 MB/s | 161.9 MB/s  | 38.0 us |   2.6 ms |  69.0 us |   3.8 ms | 12.0 us |   3.6 ms |   NA    |  33.0 us |    0    |    0     |
|3300 | sanblaze-147-port7-p | sanblaze-147-port6-p |  1        |   2651    |   2594    | 165.7 MB/s | 162.2 MB/s  | 39.0 us |   2.6 ms |  69.0 us |   3.6 ms | 12.0 us |   3.5 ms |   NA    |  32.0 us |    0    |    0     |
+---------------------------------------------------------------+-----------------------+--------------------------+--------------------+---------------------+--------------------+--------------------+--------------------+
Total number of ITNs: 10
*These values are calculated since the metrics were last cleared.

This example shows how to display the device alias information, minimum, maximum, and peak flow metrics of interface fc5/21 of a target ITL and limit the output to 10 random records for SCSI:


switch# ShowAnalytics --minmax --target-itl --alias  --interface fc5/21 --limit 10
2019-04-09 12:01:40.609197

 Interface fc5/21
+--------------------------------------------------------------------------------+-------------+--------------------------+--------------------+--------------------+--------------------+--------------------+--------------------+
|VSAN |      Initiator       | VMID |        Target        |         LUN         |  Peak IOPS* |     Peak Throughput*     |     Read ECT*      |     Write ECT*     |    Host Delay*     |    Array Delay*    | Write IO sequence* |
+--------------------------------------------------------------------------------+-------------+--------------------------+--------------------+--------------------+--------------------+--------------------+--------------------+
|                                                                                |Read | Write |     Read   |   Write     |   Min   |    Max   |  Min    |    Max   |  Min    |    Max   |  Min    |    Max   |  Min    |    Max   |
|                                                                                |             |                          |                    |                    |                    |                    |                    |
|2200 |       0xe902e0       |   - | Tgt_9706_206_fc5_21_ | 0002-0000-0000-0000  |  0   | 9242 |      0 B/s |  4.5 MB/s   |   0 ns  |    0 ns  | 66.0 us |   2.6 ms |   0 ns  |    0 ns  |   NA    |    0 ns  |    0    |    0     |
|2200 |       0xe902e0       |   - | Tgt_9706_206_fc5_21_ | 0003-0000-0000-0000  |  0   | 9243 |      0 B/s |  4.5 MB/s   |   0 ns  |    0 ns  | 66.0 us |   2.6 ms |   0 ns  |    0 ns  |   NA    |    0 ns  |    0    |    0     |
|2200 |       0xe902e0       |   - | Tgt_9706_206_fc5_21_ | 0001-0000-0000-0000  |  0   | 9242 |      0 B/s |  4.5 MB/s   |   0 ns  |    0 ns  | 66.0 us |   2.6 ms |   0 ns  |    0 ns  |   NA    |    0 ns  |    0    |    0     |
|2200 |       0xe90440       |   - | Tgt_9706_206_fc5_21_ | 0001-0000-0000-0000  |  0   | 8361 |      0 B/s |  4.1 MB/s   |   0 ns  |    0 ns  | 68.0 us |   2.6 ms |   0 ns  |    0 ns  |   NA    |    0 ns  |    0    |    0     |
|2200 |       0xe90440       |   - | Tgt_9706_206_fc5_21_ | 0002-0000-0000-0000  |  0   | 7814 |      0 B/s |  3.8 MB/s   |   0 ns  |    0 ns  | 69.0 us |   2.6 ms |   0 ns  |    0 ns  |   NA    |    0 ns  |    0    |    0     |
|2200 |       0xe906c0       |   - | Tgt_9706_206_fc5_21_ | 0001-0000-0000-0000  |  0   | 7779 |      0 B/s |  3.8 MB/s   |   0 ns  |    0 ns  | 69.0 us |   2.7 ms |   0 ns  |    0 ns  |   NA    |    0 ns  |    0    |    0     |
|2200 |       0xe906c0       |   - | Tgt_9706_206_fc5_21_ | 0002-0000-0000-0000  |  0   | 7779 |      0 B/s |  3.8 MB/s   |   0 ns  |    0 ns  | 69.0 us |   2.6 ms |   0 ns  |    0 ns  |   NA    |    0 ns  |    0    |    0     |
+--------------------------------------------------------------------------------+-------------+--------------------------+--------------------+--------------------+--------------------+--------------------+--------------------+
Total number of ITLs: 7
*These values are calculated since the metrics were last cleared.

This example shows how to display the NPU load for a range of interfaces:


switch# ShowAnalytics --evaluate-npuload --interface fc8/7-8
2019-05-09 10:56:54.021234
There are 2 interfaces to be evaluated. Expected time is 2 minutes 0 seconds
Do you want to continue [Yes|No]? [n]y
+-----------+--------+--------+---------+------+------+-------+------------+----------+
| Interface |        ITL/N Count        |      NPU Load %     |  Analyis   | Analysis |
|           |  SCSI  |  NVMe  |  Total  | SCSI | NVMe | Total | Start Time | End Time |
+-----------+--------+--------+---------+------+------+-------+------------+----------+
|   fc8/7   |  1000  |   0    |   1000  | 8.1  | 0.0  |  8.1  |  10:57:20  | 10:57:52 |
|   fc8/8   |  1000  |   0    |   1000  | 8.1  | 0.0  |  8.1  |  10:58:20  | 10:58:51 |
|           |        |        |         |      |      |       |            |          |
|   *Total  |  2000  |   0    |   2000  | 16.2 | 0.0  |  16.2 |            |          |
+-----------+--------+--------+---------+------+------+-------+------------+----------+
* This total is an indicative reference based on evaluated ports


Note


Evaluating NPU load takes some time. If the connection to the switch is lost during the evaluation process, the process continues to run in the background until completion and the output is saved in a file. A syslog message is generated after the process is complete with the filename and the location of the file where the output is saved.


This example shows how to duplicate the output to a file named output.txt on bootflash:


Note


You can use the --outfile option with all the ShowAnalytics command options to duplicate the command output to a file.


switch# ShowAnalytics --evaluate-npuload --outfile output.txt
2020-11-24 13:42:19.510351
There are 4 interfaces to be evaluated. Expected time is 4 minutes 0 seconds
Do you want to continue [Yes|No]? [n]y
Module 1
+-----------+-----------+--------+--------+---------+------+------+-------+------------+----------+
| Interface |    Type   |        ITL/N Count        |      NPU Load %     |  Analyis   | Analysis |
|           |           |  SCSI  |  NVMe  |  Total  | SCSI | NVMe | Total | Start Time | End Time |
+-----------+-----------+--------+--------+---------+------+------+-------+------------+----------+
|   fc1/1   |   Target  |   1    |   0    |    1    | 0.6  | 0.0  |  0.6  |  13:42:40  | 13:43:11 |
|   fc1/2   | Initiator |   1    |   0    |    1    | 0.6  | 0.0  |  0.6  |  13:43:40  | 13:44:11 |
|           |           |        |        |         |      |      |       |            |          |
|   *Total  |           |   2    |   0    |    2    | 1.2  | 0.0  |  1.2  |            |          |
+-----------+-----------+--------+--------+---------+------+------+-------+------------+----------+
Recommended port sampling size: 48

* This total is an indicative reference based on evaluated ports

Errors:
------

Traffic is not running on port fc1/47
Traffic is not running on port fc1/48

This example shows how to append the output to a file named output.txt on bootflash: that already contains some output:


switch# ShowAnalytics --evaluate-npuload --appendfile  output.txt
2020-11-24 13:45:07.535440
There are 4 interfaces to be evaluated. Expected time is 4 minutes 0 seconds
Do you want to continue [Yes|No]? [n]y
Module 1
+-----------+-----------+--------+--------+---------+------+------+-------+------------+----------+
| Interface |    Type   |        ITL/N Count        |      NPU Load %     |  Analyis   | Analysis |
|           |           |  SCSI  |  NVMe  |  Total  | SCSI | NVMe | Total | Start Time | End Time |
+-----------+-----------+--------+--------+---------+------+------+-------+------------+----------+
|   fc1/1   |   Target  |   1    |   0    |    1    | 0.6  | 0.0  |  0.6  |  13:45:40  | 13:46:11 |
|   fc1/2   | Initiator |   1    |   0    |    1    | 0.6  | 0.0  |  0.6  |  13:46:40  | 13:47:11 |
|           |           |        |        |         |      |      |       |            |          |
|   *Total  |           |   2    |   0    |    2    | 1.2  | 0.0  |  1.2  |            |          |
+-----------+-----------+--------+--------+---------+------+------+-------+------------+----------+
Recommended port sampling size: 48

* This total is an indicative reference based on evaluated ports

Errors:
------

Traffic is not running on port fc1/47
Traffic is not running on port fc1/48

This example shows how to display the VSAN throughput information for NVMe:


switch# ShowAnalytics --vsan-thput --nvme
2019-05-09 14:02:07.940600
 
 Interface fc16/12
+------+--------+--------+--------+
| VSAN |   Throughput (4s avg)    |
|      | Read   | Write  | Total  |
|      | (MBps) | (MBps) | (MBps) |
+------+--------+--------+--------+
| 3300 | 1605.8 | 1626.8 | 3232.6 |
+------+--------+--------+--------+
Note: This data is only for NVMe

This example shows how to display the VSAN throughput information for SCSI:


switch# ShowAnalytics --vsan-thput
2019-05-09 14:02:07.940600
 
Interface fc8/17
+------+--------+--------+--------+
| VSAN |   Throughput (4s avg)    |
|      | Read   | Write  | Total  |
|      | (MBps) | (MBps) | (MBps) |
+------+--------+--------+--------+
| 5    | 0.0    | 0.0    | 0.0    |
+------+--------+--------+--------+
 
Interface fc8/18
+------+--------+--------+--------+
| VSAN |   Throughput (4s avg)    |
|      | Read   | Write  | Total  |
|      | (MBps) | (MBps) | (MBps) |
+------+--------+--------+--------+
| 5    | 0.0    | 0.0    | 0.0    |
+------+--------+--------+--------+
 
Interface fc8/19
+------+--------+--------+--------+
| VSAN |   Throughput (4s avg)    |
|      | Read   | Write  | Total  |
|      | (MBps) | (MBps) | (MBps) |
+------+--------+--------+--------+
| 5    | 0.0    | 0.0    | 0.0    |
+------+--------+--------+--------+
 
Interface fc8/20
+------+--------+--------+--------+
| VSAN |   Throughput (4s avg)    |
|      | Read   | Write  | Total  |
|      | (MBps) | (MBps) | (MBps) |
+------+--------+--------+--------+
| 5    | 0.0    | 0.0    | 0.0    |
+------+--------+--------+--------+
 
Interface fc8/21
+------+--------+--------+--------+
| VSAN |   Throughput (4s avg)    |
|      | Read   | Write  | Total  |
|      | (MBps) | (MBps) | (MBps) |
+------+--------+--------+--------+
| 3500 | 301.9  | 302.8  | 604.7  |
+------+--------+--------+--------+
 
Interface fc8/22
+------+--------+--------+--------+
| VSAN |   Throughput (4s avg)    |
|      | Read   | Write  | Total  |
|      | (MBps) | (MBps) | (MBps) |
+------+--------+--------+--------+
| 3500 | 302.7  | 304.8  | 607.5  |
+------+--------+--------+--------+
Note: This data is only for SCSI

This example shows how to display the VSAN throughput information for a port channel:


switch# ShowAnalytics --vsan-thput --interface port-channel108
2019-05-09 15:01:32.538121

Interface port-channel108
+------+--------+--------+--------+
| VSAN |   Throughput (4s avg)    |
|      | Read   | Write  | Total  |
|      | (MBps) | (MBps) | (MBps) |
+------+--------+--------+--------+
| 1    | 0.0    | 0.0    | 0.0    |
| 5    | 145.9  | 0.0    | 145.9  |
| 3500 | 561.9  | 558.6  | 1120.5 |
+------+--------+--------+--------+
Note: This data is only for SCSI

This example shows how to display the outstanding IO per ITN for an interface for NVMe:


switch# ShowAnalytics --outstanding-io --interface fc16/12 --nvme
2019-05-20 11:59:48.306396                                      
 Interface : fc16/12  VSAN : 3300  FCNS_type : Initiator            

+------------------------------------+----------------+
| Initiator |  Target   | Namespace  | Outstanding IO |
+------------------------------------+----------------+
|                                    |  Read | Write  |
|                                    |                |
| 0xc80002  | 0xed0002  |   1        |    3  |  6     |
| 0xc80007  | 0xed0007  |   1        |    5  |  5     |
| 0xc80005  | 0xed0005  |   1        |    1  | 10     |
| 0xc80001  | 0xed0001  |   1        |    2  |  7     |
| 0xc80000  | 0xed0000  |   1        |    6  |  5     |
| 0xc80008  | 0xed0008  |   1        |    1  |  7     |
| 0xc80009  | 0xed0009  |   1        |    3  |  4     |
| 0xc80004  | 0xed0004  |   1        |    3  |  6     |
| 0xc80006  | 0xed0006  |   1        |    2  |  5     |
| 0xc80000  | 0xed0001  |   1        |    3  |  4     |
| 0xc80003  | 0xed0003  |   1        |    4  |  4     |
+------------------------------------+----------------+
Instantaneous Qdepth : 96

This example shows how to display the outstanding IO per ITL for an interface for SCSI:


switch# ShowAnalytics --outstanding-io --interface fc8/7 
2019-05-20 11:59:48.306396                                      

Interface : fc8/7  VSAN : 5  FCNS_type : Target

+---------------------------------------+----------------+
|          Initiator|Target|LUN         | Outstanding IO |
+---------------------------------------+----------------+
|                                       |  Read | Write  |
|                                       |                |
| 0xed0320|0xef0580|0001-0000-0000-0000 |    2  |  0     |
| 0xed0320|0xef0580|0002-0000-0000-0000 |    1  |  0     |
| 0xed0320|0xef0580|0003-0000-0000-0000 |    1  |  0     |
| 0xed0320|0xef0580|0004-0000-0000-0000 |    1  |  0     |
| 0xed0320|0xef0580|0005-0000-0000-0000 |    1  |  0     |
| 0xed0320|0xef0580|0006-0000-0000-0000 |    1  |  0     |
| 0xed0320|0xef0580|0007-0000-0000-0000 |    1  |  0     |
| 0xed0320|0xef0580|0008-0000-0000-0000 |    1  |  0     |
| 0xed0320|0xef0580|0009-0000-0000-0000 |    1  |  0     |
| 0xed0320|0xef0580|000a-0000-0000-0000 |    1  |  0     |
+---------------------------------------+----------------+
Instantaneous Qdepth : 11 

Note


The Instantaneous Qdepth value in the output represents the number of IOs that are currently active in the specified interface.


This example shows how to display the outstanding IO per ITN for an interface, limit the output to 10 records, and refresh the data periodically for NVMe:


switch# ShowAnalytics --outstanding-io --interface fc8/7  --limit 10 --refresh --nvme
2019-05-20 12:00:21.028228                                                             
 Interface : fc16/12  VSAN : 3300  FCNS_type : Initiator            

+------------------------------------+----------------+
| Initiator |  Target   | Namespace  | Outstanding IO |
+------------------------------------+----------------+
|                                    |  Read | Write  |
|                                    |                |
| 0xc80002  | 0xed0002  |   1        |    2  |  7     |
| 0xc80007  | 0xed0007  |   1        |    3  |  5     |
| 0xc80005  | 0xed0005  |   1        |    1  |  8     |
| 0xc80001  | 0xed0001  |   1        |    1  |  0     |
| 0xc80000  | 0xed0000  |   1        |    5  |  6     |
+------------------------------------+----------------+

This example shows how to display the outstanding IO per ITL for an interface, limit the output to 10 records, and refresh the data periodically for SCSI:


switch# ShowAnalytics --outstanding-io --interface fc8/7  --limit 10 --refresh
2019-05-20 12:00:21.028228                                                             

Interface : fc8/7  VSAN : 5  FCNS_type : Target

+---------------------------------------+----------------+
|          Initiator|Target|LUN         | Outstanding IO |
+---------------------------------------+----------------+
|                                       |  Read | Write  |
|                                       |                |
| 0xed0320|0xef0580|0001-0000-0000-0000 |    0  |  0     |
| 0xed0320|0xef0580|0002-0000-0000-0000 |    1  |  0     |
| 0xed0320|0xef0580|0003-0000-0000-0000 |    1  |  0     |
| 0xed0320|0xef0580|0004-0000-0000-0000 |    1  |  0     |
| 0xed0320|0xef0580|0005-0000-0000-0000 |    0  |  0     |
| 0xed0320|0xef0580|0006-0000-0000-0000 |    0  |  0     |
| 0xed0320|0xef0580|0007-0000-0000-0000 |    1  |  0     |
| 0xed0320|0xef0580|0008-0000-0000-0000 |    0  |  0     |
| 0xed0320|0xef0580|0009-0000-0000-0000 |    1  |  0     |
| 0xed0320|0xef0580|000a-0000-0000-0000 |    1  |  0     |
+---------------------------------------+----------------+
Estimated Qdepth : 6

This example shows how to display the histogram of a initiator ID 0xee008e, target ID 0xe80b22, and LUN ID 0060-0000-0000-0000 of a target ITL


switch# ShowAnalytics --histogram --initiator-itl --initiator 0xee008e --target 0xe80b22 --lun 0060-0000-0000-0000                                                          

Starting histogram monitor session
Session ID: 15789
+----------------+------------+
|                | 25-05-2022 |
| Metric         |  15:29:30  |
+----------------+------------+
| IOPS Read      |     0      |
| IOPS Write     |     11     |
| ECT Read       |   0 ns     |
| ECT Write      |  28.1 ms   |
| DAL Read       |   0 ns     |
| DAL Write      |  13.7 ms   |
| FAILURES Read  |     0      |
| FAILURES Write |     0      |
| ABORTS Read    |     0      |
| ABORTS Write   |     0      |
+----------------+------------+
Histogram data will get updated every 5 mins

This example shows how to display the histogram of a initiator ID 0xee008e and target ID 0xe80b22 of a target ITL


switch# ShowAnalytics --histogram --initiator-it --initiator 0xee008e --target 0xe80b22

Starting histogram monitor session
Session ID: 16205
+----------------+------------+
|                | 25-05-2022 |
| Metric         |  15:30:13  |
+----------------+------------+
| IOPS Read      |     0      |
| IOPS Write     |    106     |
| ECT Read       |   0 ns     |
| ECT Write      |  28.1 ms   |
| DAL Read       |   0 ns     |
| DAL Write      |  13.7 ms   |
| FAILURES Read  |     0      |
| FAILURES Write |     0      |
| ABORTS Read    |     0      |
| ABORTS Write   |     0      |
+----------------+------------+
Histogram data will get updated every 5 mins

This example shows how to display the histogram of all sessions.


switch# ShowAnalytics --histogram --show-sessions

+------------+----------------------------------------------------------------------------------------------------------------------------+
| Session ID | Arguments                                                                                                                  |
+------------+----------------------------------------------------------------------------------------------------------------------------+
|      15789 | --initiator-itl --initiator 0xee008e --target 0xe80b22 --lun 0060-0000-0000-0000 --interval 5 --metric IOPS,ECT,DAL,ERRORS |
|      16205 | --initiator-it --initiator 0xee008e --target 0xe80b22 --interval 5 --metric IOPS,ECT,DAL,ERRORS                            |
|      20924 | --target-itl --initiator 0xc80ba3 --target 0xc804e3 --lun 0002-0000-0000-0000 --interval 5 --metric IOPS,ECT,DAL,ERRORS    |
+------------+----------------------------------------------------------------------------------------------------------------------------+

Analytic-scale184# ShowAnalytics --histogram --sessionId 16205
+----------------+------------+------------+------------+
|                | 25-05-2022 | 25-05-2022 | 25-05-2022 |
| Metric         |  15:40:15  |  15:35:14  |  15:30:13  |
+----------------+------------+------------+------------+
| IOPS Read      |     0      |     0      |     0      |
| IOPS Write     |     95     |    142     |    106     |
| ECT Read       |   0 ns     |   0 ns     |   0 ns     |
| ECT Write      |  28.2 ms   |  27.7 ms   |  28.1 ms   |
| DAL Read       |   0 ns     |   0 ns     |   0 ns     |
| DAL Write      |  13.7 ms   |  13.6 ms   |  13.7 ms   |
| FAILURES Read  |     0      |     0      |     0      |
| FAILURES Write |     0      |     0      |     0      |
| ABORTS Read    |     0      |     0      |     0      |
| ABORTS Write   |     0      |     0      |     0      |
+----------------+------------+------------+------------+

This example shows how to display the histogram of a specific session 15789 that is stopped.


switch# ShowAnalytics --histogram --stop-session --sessionId 15789

Stopping session id: 15789

Analytic-scale184# ShowAnalytics --histogram --initiator-itn --initiator 0xc80960 --target 0xe80641 --namespace 3
Starting histogram monitor session
Session ID: 27792
+----------------+------------+
|                | 25-05-2022 |
| Metric         |  15:47:11  |
+----------------+------------+
| IOPS Read      |     0      |
| IOPS Write     |     0      |
| ECT Read       |  433.0 us  |
| ECT Write      |   1.0 ms   |
| DAL Read       |  421.0 us  |
| DAL Write      |  339.0 us  |
| FAILURES Read  |     0      |
| FAILURES Write |     0      |
| ABORTS Read    |     0      |
| ABORTS Write   |     0      |
+----------------+------------+
Histogram data will get updated every 5 mins

This example shows how to display the histogram with metric details such as IOPS, ECT, DAL, and Errors for an initiator ID 0xee008e and target ID 0xe80b22 every five minutes.


switch# ShowAnalytics --histogram --initiator-it --initiator 0xee008e --target 0xe80b22 --interval 5 --metric IOPS,ECT,DAL,ERRORS

Data collected at : Wed, 25 May 2022 16:20:12 +0530

+----------------+------------+------------+------------+------------+------------+------------+------------+------------+------------+------------+
|                | 25-05-2022 | 25-05-2022 | 25-05-2022 | 25-05-2022 | 25-05-2022 | 25-05-2022 | 25-05-2022 | 25-05-2022 | 25-05-2022 | 25-05-2022 |
| Metric         |  16:15:22  |  16:10:21  |  16:05:19  |  16:00:18  |  15:55:18  |  15:50:17  |  15:45:16  |  15:40:15  |  15:35:14  |  15:30:13  |
+----------------+------------+------------+------------+------------+------------+------------+------------+------------+------------+------------+
| IOPS Read      |     0      |     0      |     0      |     0      |     0      |     0      |     0      |     0      |     0      |     0      |
| IOPS Write     |    138     |    104     |     50     |    135     |     68     |     74     |     89     |     95     |    142     |    106     |
| ECT Read       |   0 ns     |   0 ns     |   0 ns     |   0 ns     |   0 ns     |   0 ns     |   0 ns     |   0 ns     |   0 ns     |   0 ns     |
| ECT Write      |  28.2 ms   |  27.8 ms   |  28.3 ms   |  28.0 ms   |  28.0 ms   |  28.0 ms   |  27.9 ms   |  28.2 ms   |  27.7 ms   |  28.1 ms   |
| DAL Read       |   0 ns     |   0 ns     |   0 ns     |   0 ns     |   0 ns     |   0 ns     |   0 ns     |   0 ns     |   0 ns     |   0 ns     |
| DAL Write      |  13.7 ms   |  13.6 ms   |  13.8 ms   |  13.7 ms   |  13.7 ms   |  13.7 ms   |  13.7 ms   |  13.7 ms   |  13.6 ms   |  13.7 ms   |
| FAILURES Read  |     0      |     0      |     0      |     0      |     0      |     0      |     0      |     0      |     0      |     0      |
| FAILURES Write |     0      |     0      |     0      |     0      |     0      |     0      |     0      |     0      |     0      |     0      |
| ABORTS Read    |     0      |     0      |     0      |     0      |     0      |     0      |     0      |     0      |     0      |     0      |
| ABORTS Write   |     0      |     0      |     0      |     0      |     0      |     0      |     0      |     0      |     0      |     0      |
+----------------+------------+------------+------------+------------+------------+------------+------------+------------+------------+------------+

This example shows how to display the histogram for an initiator ID 0xee008e and target ID 0xe80b22 with an refresh time of 120 minutes.


switch# ShowAnalytics --histogram --initiator-it --initiator 0xee008e --target 0xe80b22 --interval 120

Starting histogram monitor session
Session ID: 21352
+----------------+------------+
|                | 25-05-2022 |
| Metric         |  16:21:29  |
+----------------+------------+
| IOPS Read      |     0      |
| IOPS Write     |     84     |
| ECT Read       |   0 ns     |
| ECT Write      |  28.1 ms   |
| DAL Read       |   0 ns     |
| DAL Write      |  13.7 ms   |
| FAILURES Read  |     0      |
| FAILURES Write |     0      |
| ABORTS Read    |     0      |
| ABORTS Write   |     0      |
+----------------+------------+
Histogram data will get updated every 120 mins

This example shows how to display the histogram with metric details such as ECT and DAL for an initiator ID 0xee008e and target ID 0xe80b22 every five minutes.


switch# ShowAnalytics --histogram --initiator-it --initiator 0xee008e --target 0xe80b22 --metric ECT,DAL

Starting histogram monitor session
Session ID: 22073
+-----------+------------+
|           | 25-05-2022 |
| Metric    |  16:22:35  |
+-----------+------------+
| ECT Read  |   0 ns     |
| ECT Write |  28.1 ms   |
| DAL Read  |   0 ns     |
| DAL Write |  13.7 ms   |
+-----------+------------+
Histogram data will get updated every 5 mins

This example shows how to display the histogram for an initiator ID 0xee008e every five minutes.


switch# ShowAnalytics --histogram --initiator 0xee008e

Starting histogram monitor session
Session ID: 23254
+----------------+------------+
|                | 25-05-2022 |
| Metric         |  16:24:10  |
+----------------+------------+
| IOPS Read      |     0      |
| IOPS Write     |    124     |
| ECT Read       |   0 ns     |
| ECT Write      |  28.2 ms   |
| DAL Read       |   0 ns     |
| DAL Write      |  13.8 ms   |
| FAILURES Read  |     0      |
| FAILURES Write |     0      |
| ABORTS Read    |     0      |
| ABORTS Write   |     0      |
+----------------+------------+
Histogram data will get updated every 5 mins

This example shows how to display the histogram for a target 0xc804e3 every five minutes.


switch# ShowAnalytics --histogram --target 0xc804e3

Starting histogram monitor session
Session ID: 24003
+----------------+------------+
|                | 25-05-2022 |
| Metric         |  16:25:07  |
+----------------+------------+
| IOPS Read      |     0      |
| IOPS Write     |    3939    |
| ECT Read       |   0 ns     |
| ECT Write      |  23.3 ms   |
| DAL Read       |   0 ns     |
| DAL Write      |  10.7 ms   |
| FAILURES Read  |     0      |
| FAILURES Write |   30429    |
| ABORTS Read    |     0      |
| ABORTS Write   |     0      |
+----------------+------------+
Histogram data will get updated every 5 mins

Displaying Congestion Drops Per Flow

The SAN Analytics feature displays packet timeout drops on a per-flow basis. The number of packets dropped along with the time stamp for ports is displayed.

To display the packet drops on a per-flow basis, run this command:

switch# show analytics flow congestion-drops


Note


From Cisco MDS NX-OS Release 9.4(1), the command show analytics flow congestion-drops is available as part of the show tech-support slowdrain commands as slot <slot number> show analytics flow congestion-drops. The command is available on MDS switches that are capable of performing analytic.


Examples: Displaying Congestion Drops Per Flow

This example shows flows where frames are dropped due to congestion. The source and destination FCID, differential frame drop count for the IT pair, and timestamp of the drops are displayed.


switch# show analytics flow congestion-drops

|=====================================================================================|
| Source       |Destination            | Congestion    |     Timestamp                |
| INTF  | VSAN |  FCID     |  FCID     | Drops(delta)  |                              |
|=====================================================================================|
| fc2/13| 0002 | 0x9900E1  | 0x640000  |  00000105     | 1. 09/13/17 11:09:48.762     |
| fc2/13| 0002 | 0x9900E1  | 0x640000  |  00000002     | 2. 09/13/17 09:05:39.527     |
| fc2/13| 0002 | 0x990000  | 0x640020  |  00000002     | 3. 09/13/17 09:05:39.527     |
|=====================================================================================|
| fc2/31| 0002 | 0x640000  | 0x9900E1  |  00000084     | 1. 09/12/17 08:17:11.905     |
| fc2/31| 0002 | 0x640000  | 0x9900E1  |  00000076     | 2. 09/12/17 05:50:37.721     |
| fc2/31| 0002 | 0x640000  | 0x9900E1  |  00000067     | 3. 09/12/17 03:24:03.319     |
| fc2/31| 0002 | 0x640000  | 0x9900E1  |  00000088     | 4. 09/12/17 00:57:28.019     |
| fc2/31| 0002 | 0x640000  | 0x9900E1  |  00000088     | 5. 09/11/17 22:30:53.723     |
| fc2/31| 0002 | 0x640000  | 0x9900E1  |  00000086     | 6. 09/11/17 20:04:18.001     |
| fc2/31| 0002 | 0x640000  | 0x9900E1  |  00000026     | 7. 09/11/17 17:37:24.273     |
| fc2/31| 0002 | 0x640000  | 0x9900E1  |  00000076     | 8. 09/11/17 15:10:50.240     |
| fc2/31| 0002 | 0x640000  | 0x9900E1  |  00000074     | 9. 09/11/17 12:44:15.866     |
| fc2/31| 0002 | 0x640000  | 0x9900E1  |  00000087     |10. 09/11/17 10:17:41.402     |
| fc2/31| 0002 | 0x640000  | 0x9900E1  |  00000086     |11. 09/11/17 07:51:10.412     |
| fc2/31| 0002 | 0x640000  | 0x9900E1  |  00000084     |12. 09/11/17 05:24:35.981     |
| fc2/31| 0002 | 0x640000  | 0x9900E1  |  00000083     |13. 09/11/17 02:58:01.067     |
| fc2/31| 0002 | 0x640000  | 0x9900E1  |  00000086     |14. 09/11/17 00:31:26.709     |
| fc2/31| 0002 | 0x640000  | 0x9900E1  |  00000079     |15. 09/10/17 22:04:51.399     |
| fc2/31| 0002 | 0x640000  | 0x9900E1  |  00000084     |16. 09/10/17 19:38:17.217     |
| fc2/31| 0002 | 0x640000  | 0x9900E1  |  00000082     |17. 09/10/17 17:11:42.594     |
| fc2/31| 0002 | 0x640000  | 0x9900E1  |  00000086     |18. 09/10/17 14:44:52.786     |
| fc2/31| 0002 | 0x640000  | 0x9900E1  |  00000089     |19. 09/10/17 12:18:18.394     |
| fc2/31| 0002 | 0x640000  | 0x9900E1  |  00000087     |20. 09/10/17 09:51:44.067     |
|=====================================================================================|

This example shows the use of the command in the show tech-support slowdrain commands.

switch# show tech-support slowdrain commands  | inc congestion
slot 1 show analytics flow congestion-drops
switch#slot 1 show analytics flow congestion-drops
|=====================================================================================|
|       |      | Source    |Destination| Congestion    |     Timestamp                |
| INTF  | VSAN |  FCID     |  FCID     | Drops(delta)  |                              |
|=====================================================================================|
| fc1/3 | 0063 | 0xD70000  | 0x410000  |  00000374     | 1. 07/08/23 12:40:37.054     |
|=====================================================================================|
| fc1/12| 0063 | 0xD70000  | 0x420000  |  00000697     | 1. 07/08/23 12:40:37.054     |
| fc1/12| 0063 | 0xD70000  | 0x420000  |  00001024     | 2. 07/08/23 12:40:32.063     |
| fc1/12| 0063 | 0x660000  | 0x420000  |  00000314     | 3. 07/08/23 12:40:32.063     |
|=====================================================================================|

Verifying SAN Analytics

This example shows the list of interfaces that have the SAN Analytics feature enabled:


switch# show running-config analytics 

!Command: show running-config analytics
!Running configuration last done at: Mon Apr  1 05:27:54 2019
!Time: Mon Apr  1 05:28:42 2019

version 8.4(0)SK(1)
feature analytics
analytics port-sampling module 4 size 12 interval 30

analytics query "select all from fc-scsi.scsi_target_itl_flow" name VI_scsi type periodic interval 30  differential clear
analytics query "select all from fc-nvme.nvme_target_itn_flow" name nvme-184 type periodic interval 30  differential clear

interface fc4/25
  analytics type fc-scsi

interface fc4/26
  analytics type fc-nvme

interface fc12/44
  analytics type fc-scsi
  analytics type fc-nvme


This example shows the list of configured push queries that are installed on a switch:


switch# show analytics query all
Total queries:2
============================
Query Name      :VI_scsi
Query String    :select all from fc-scsi.scsi_target_itl_flow
Query Type      :periodic, interval 30
Query Options   :differential clear

Query Name      :nvme-184
Query String    :select all from fc-nvme.nvme_target_itn_flow
Query Type      :periodic, interval 30
Query Options   :differential clear


This example shows how to display the NPU load, ITL, and ITN count per module:


switch# show analytics system-load 
 n/a - not applicable
 ----------------------------------- Analytics System Load Info -------------------------------
 | Module | NPU Load (in %) | ITLs   ITNs   Both  |        Hosts        |       Targets       |
 |        | SCSI NVMe Total | SCSI   NVMe   Total | SCSI   NVMe   Total | SCSI   NVMe   Total |
 ----------------------------------------------------------------------------------------------
 |   1    | 0    0    0     | 0      0      0     | 0      0      0     | 0      0      0     |
 |   4    | 64   0    64    | 20743  0      20743 | 0      0      0     | 346    0      346   |
 |   5    | 0    0    0     | 0      0      0     | 0      0      0     | 0      0      0     |
 |   8    | 0    0    0     | 0      0      0     | 0      0      0     | 0      0      0     |
 |   12   | 0    12   12    | 0      300    300   | 0      0      0     | 0      40     40    |
 |   13   | 0    0    0     | 0      0      0     | 0      0      0     | 0      0      0     |
 |   18   | 0    13   13    | 1      1      2     | 1      1      2     | 0      0      0     |
 | Total  | n/a  n/a  n/a   | 20744  301    21045 | 1      1      2     | 346    40     386   |

As of Mon Apr  1 05:31:10 2019

Note


The show analytics system-load command provides the system load information based on all ITL counts, including active and inactive ITL counts. Hence, we recommend that you use the purge analytics query “query_string” command to remove the inactive ITL counts, and then run this command to get the active ITL counts.


This example displays the NPU load, ITL, and ITN of all active modules:


switch# ShowAnalytics --systemload-active 

This will run differential query on scsi_initiator_itl_flow, scsi_target_itl_flow,
nvme_initiator_itn_flow, nvme_target_itn_flow, scsi_initiator, scsi_target,
nvme_initiator and nvme_target  or use the result of installed query if present
 Do you want to continue [Yes|No]? [n]y

Data collected at : Wed, 25 May 2022 16:29:24 +0530

Using result of installed queries: dcnmtgtITN,dcnmtgtITL

+--------+--------+--------+---------+------+------+-------+-------+-------+--------+
| Module |        ITL/N Count        |      Initiators     |        Targets         |
|        |  SCSI  |  NVMe  |  Total  | SCSI | NVMe | Total |  SCSI |  NVMe |  Total |
+--------+--------+--------+---------+------+------+-------+-------+-------+--------+
|   1    |  5571  |    0   |   5571  |   2  |   0  |    2  |   55  |    0  |   55   |
|   2    |  14904 |    1   |   14905 |  191 |   1  |   192 |   191 |    0  |   191  |
|   3    |  7588  |    0   |   7588  |  128 |   0  |   128 |   128 |    0  |   128  |
|   5    |    0   |    0   |     0   |  56  |   0  |   56  |    0  |    0  |    0   |
|   12   |    0   |    0   |     0   |   0  |   0  |    0  |    0  |    1  |    1   |
| Total  |  28063 |    1   |   28064 |  377 |   1  |   378 |   374 |    1  |   375  |
+--------+--------+--------+---------+------+------+-------+-------+-------+--------+

This example displays the NPU load, ITL, and ITN details for a particular active module:


switch# ShowAnalytics --systemload-active --module 1 --detail 

This will run differential query on scsi_initiator_itl_flow, scsi_target_itl_flow,
nvme_initiator_itn_flow, nvme_target_itn_flow, scsi_initiator, scsi_target,
nvme_initiator and nvme_target  or use the result of installed query if present
 Do you want to continue [Yes|No]? [n]y

Data collected at : Wed, 25 May 2022 16:35:35 +0530

Using result of installed queries: dcnmtgtITN,dcnmtgtITL

+--------+--------+--------+---------+------+------+-------+-------+-------+--------+
| Module |        ITL/N Count        |      Initiators     |        Targets         |
|        |  SCSI  |  NVMe  |  Total  | SCSI | NVMe | Total |  SCSI |  NVMe |  Total |
+--------+--------+--------+---------+------+------+-------+-------+-------+--------+
|   1    |  5571  |    0   |   5571  |   2  |   0  |    2  |   55  |    0  |   55   |
| Total  |  5571  |    0   |   5571  |   2  |   0  |    2  |   55  |    0  |   55   |
+--------+--------+--------+---------+------+------+-------+-------+-------+--------+

Detailed output for DS-X9748-3072K9 modules
Module : 1
+-----------------------------+--------+--------+---------+------+------+-------+-------+-------+--------+
|            Ports            |        ITL/N Count        |      Initiators     |        Targets         |
|                             |  SCSI  |  NVMe  |  Total  | SCSI | NVMe | Total |  SCSI |  NVMe |  Total |
+-----------------------------+--------+--------+---------+------+------+-------+-------+-------+--------+
|   fc1/1,fc1/3,fc1/5,fc1/7   |  186   |   0    |   186   |  0   |  0   |   0   |   2   |   0   |   2    |
|   fc1/2,fc1/4,fc1/6,fc1/8   |  186   |   0    |   186   |  0   |  0   |   0   |   2   |   0   |   2    |
|  fc1/9,fc1/11,fc1/13,fc1/15 |  185   |   0    |   185   |  0   |  0   |   0   |   2   |   0   |   2    |
| fc1/10,fc1/12,fc1/14,fc1/16 |   93   |   0    |    93   |  0   |  0   |   0   |   1   |   0   |   1    |
| fc1/17,fc1/19,fc1/21,fc1/23 |  186   |   0    |   186   |  0   |  0   |   0   |   2   |   0   |   2    |
| fc1/18,fc1/20,fc1/22,fc1/24 |  186   |   0    |   186   |  0   |  0   |   0   |   2   |   0   |   2    |
| fc1/25,fc1/27,fc1/29,fc1/31 |  171   |   0    |   171   |  2   |  0   |   2   |   0   |   0   |   0    |
| fc1/33,fc1/35,fc1/37,fc1/39 |  2188  |   0    |   2188  |  0   |  0   |   0   |   22  |   0   |   22   |
| fc1/34,fc1/36,fc1/38,fc1/40 |  2190  |   0    |   2190  |  0   |  0   |   0   |   22  |   0   |   22   |
|            Total            |  5571  |   0    |   5571  |  2   |  0   |   2   |   55  |   0   |   55   |
+-----------------------------+--------+--------+---------+------+------+-------+-------+-------+--------+

This example shows how to check the port sampling status and the instantaneous NPU load:


switch# show analytics port-sampling module 1
Sampling Window Size: 12
Rotation Interval: 30
NPU LOAD : 64%      [SCSI 64%, NVMe 0%]  
========================================================================
  Port               Monitored Start Time           Monitored End Time
========================================================================
  fc4/25             04/01/19 - 05:25:29            04/01/19 - 05:25:59    
  fc4/26             04/01/19 - 05:25:29            04/01/19 - 05:25:59    
  fc4/27             04/01/19 - 05:25:29            04/01/19 - 05:25:59    
  fc4/28             04/01/19 - 05:25:29            04/01/19 - 05:25:59    
  fc4/29             04/01/19 - 05:25:29            04/01/19 - 05:25:59    
  fc4/30             04/01/19 - 05:25:29            04/01/19 - 05:25:59    
  fc4/31             04/01/19 - 05:25:29            04/01/19 - 05:25:59    
  fc4/32             04/01/19 - 05:25:29            04/01/19 - 05:25:59    
  fc4/33             04/01/19 - 05:25:29            04/01/19 - 05:25:59    
  fc4/34             04/01/19 - 05:25:29            04/01/19 - 05:25:59    
  fc4/35             04/01/19 - 05:25:29            04/01/19 - 05:25:59    
  fc4/36             04/01/19 - 05:25:29            04/01/19 - 05:25:59    
  fc4/37*            04/01/19 - 05:25:59            -                      
  fc4/38*            04/01/19 - 05:25:59            -                      
  fc4/39*            04/01/19 - 05:25:59            -                      
  fc4/40*            04/01/19 - 05:25:59            -                      
  fc4/41*            04/01/19 - 05:25:59            -                      
  fc4/42*            04/01/19 - 05:25:59            -                      
  fc4/43*            04/01/19 - 05:25:59            -                      
  fc4/44*            04/01/19 - 05:25:59            -                      
  fc4/45*            04/01/19 - 05:25:59            -                      
  fc4/46*            04/01/19 - 05:25:59            -                      
  fc4/47*            04/01/19 - 05:25:59            -                      
  fc4/48*            04/01/19 - 05:25:59            -                      
========================================================================
! - Denotes port is link down but analytics enabled.
* - Denotes port in active analytics port sampling window.


The star symbol (*) next to a port indicates that the port is currently being sampled.

This example shows the output of a push query that has already been configured:


switch# show analytics query name iniitl result 
{ "values": {
        "1": {
                "port": "fc1/6",
                "vsan": "10",
                "app_id": "255",
                "initiator_id": "0xe800a0",
                "target_id": "0xd601e0",
                "lun": "0000-0000-0000-0000",
                "active_io_read_count": "0",
                "active_io_write_count": "7",
                "total_read_io_count": "0",
                "total_write_io_count": "1008608573",
                "total_seq_read_io_count": "0",
                "total_seq_write_io_count": "1",
                "total_read_io_time": "0",
                "total_write_io_time": "370765952314",
                "total_read_io_initiation_time": "0",
                "total_write_io_initiation_time": "52084968152",
                "total_read_io_bytes": "0",
                "total_write_io_bytes": "2065630357504",
                "total_read_io_inter_gap_time": "0",
                "total_write_io_inter_gap_time": "16171468343166",
                "total_time_metric_based_read_io_count": "0",
                "total_time_metric_based_write_io_count": "1008608566",
                "total_time_metric_based_read_io_bytes": "0",
                "total_time_metric_based_write_io_bytes": "2065630343168",
                "read_io_rate": "0",
                "peak_read_io_rate": "0",
                "write_io_rate": "16070",
                "peak_write_io_rate": "32468",
                "read_io_bandwidth": "0",
                "peak_read_io_bandwidth": "0",
                "write_io_bandwidth": "32912384",
                "peak_write_io_bandwidth": "66494976",
                "read_io_size_min": "0",
                "read_io_size_max": "0",
                "write_io_size_min": "2048",
                "write_io_size_max": "2048",
                "read_io_completion_time_min": "0",
                "read_io_completion_time_max": "0",
                "write_io_completion_time_min": "111",
                "write_io_completion_time_max": "9166",
                "read_io_initiation_time_min": "0",
                "read_io_initiation_time_max": "0",
                "write_io_initiation_time_min": "36",
                "write_io_initiation_time_max": "3265",
                "read_io_inter_gap_time_min": "0",
                "read_io_inter_gap_time_max": "0",
                "write_io_inter_gap_time_min": "100",
                "write_io_inter_gap_time_max": "1094718",
                "peak_active_io_read_count": "0",
                "peak_active_io_write_count": "23",
                "read_io_aborts": "0",
                "write_io_aborts": "0",
                "read_io_failures": "0",
                "write_io_failures": "0",
                "read_io_scsi_check_condition_count": "0",
                "write_io_scsi_check_condition_count": "0",
                "read_io_scsi_busy_count": "0",
                "write_io_scsi_busy_count": "0",
                "read_io_scsi_reservation_conflict_count": "0",
                "write_io_scsi_reservation_conflict_count": "0",
                "read_io_scsi_queue_full_count": "0",
                "write_io_scsi_queue_full_count": "0",
                "sampling_start_time": "1529993232",
                "sampling_end_time": "1529993260"
        },
        "2": {
                "port": "fc1/6",
                "vsan": "10",
                "app_id": "255",
                "initiator_id": "0xe800a1",
                "target_id": "0xd601e1",
                "lun": "0000-0000-0000-0000",
                "active_io_read_count": "0",
                "active_io_write_count": "8",
                "total_read_io_count": "0",
                "total_write_io_count": "1004271260",
                "total_seq_read_io_count": "0",
                "total_seq_write_io_count": "1",
                "total_read_io_time": "0",
                "total_write_io_time": "370004164726",
                "total_read_io_initiation_time": "0",
                "total_write_io_initiation_time": "51858511487",
                "total_read_io_bytes": "0",
                "total_write_io_bytes": "2056747540480",
                "total_read_io_inter_gap_time": "0",
                "total_write_io_inter_gap_time": "16136686881766",
                "total_time_metric_based_read_io_count": "0",
                "total_time_metric_based_write_io_count": "1004271252",
                "total_time_metric_based_read_io_bytes": "0",
                "total_time_metric_based_write_io_bytes": "2056747524096",
                "read_io_rate": "0",
                "peak_read_io_rate": "0",
                "write_io_rate": "16065",
                "peak_write_io_rate": "16194",
                "read_io_bandwidth": "0",
                "peak_read_io_bandwidth": "0",
                "write_io_bandwidth": "32901632",
                "peak_write_io_bandwidth": "33165824",
                "read_io_size_min": "0",
                "read_io_size_max": "0",
                "write_io_size_min": "2048",
                "write_io_size_max": "2048",
                "read_io_completion_time_min": "0",
                "read_io_completion_time_max": "0",
                "write_io_completion_time_min": "114",
                "write_io_completion_time_max": "9019",
                "read_io_initiation_time_min": "0",
                "read_io_initiation_time_max": "0",
                "write_io_initiation_time_min": "37",
                "write_io_initiation_time_max": "3158",
                "read_io_inter_gap_time_min": "0",
                "read_io_inter_gap_time_max": "0",
                "write_io_inter_gap_time_min": "101",
                "write_io_inter_gap_time_max": "869035",
                "peak_active_io_read_count": "0",
                "peak_active_io_write_count": "19",
                "read_io_aborts": "0",
                "write_io_aborts": "0",
                "read_io_failures": "0",
                "write_io_failures": "0",
                "read_io_scsi_check_condition_count": "0",
                "write_io_scsi_check_condition_count": "0",
                "read_io_scsi_busy_count": "0",
                "write_io_scsi_busy_count": "0",
                "read_io_scsi_reservation_conflict_count": "0",
                "write_io_scsi_reservation_conflict_count": "0",
                "read_io_scsi_queue_full_count": "0",
                "write_io_scsi_queue_full_count": "0",
                "sampling_start_time": "1529993232",
                "sampling_end_time": "1529993260"
        }
}}


Note


The output of these queries are in JSON format.


This example shows the list of view instances supported in the fc-scsi analytics type:


switch# show analytics schema fc-scsi views

fc-scsi db schema tables:
        port
        logical_port
        app
        scsi_target
        scsi_initiator
        scsi_target_app
        scsi_initiator_app
        scsi_target_tl_flow
        scsi_target_it_flow
        scsi_initiator_it_flow
        scsi_target_itl_flow
        scsi_initiator_itl_flow
        scsi_target_io
        scsi_initiator_io


This example shows the list of view instances supported in the fc-nvme analytics type:


switch# show analytics schema fc-nvme views

fc-nvme db schema tables:
        port
        logical_port
        app
        nvme_target
        nvme_initiator
        nvme_target_app
        nvme_initiator_app
        nvme_target_tn_flow
        nvme_target_it_flow
        nvme_initiator_it_flow
        nvme_target_itn_flow
        nvme_initiator_itn_flow
        nvme_target_io
        nvme_initiator_io


This example shows the list of flow metrics supported in the fc-scsi.port view instance:


Note


The exceed_count counters in the output will be supported in a future Cisco MDS NX-OS Release.


switch# show analytics schema fc-scsi view-instance port

fc-scsi.port table schema columns:
        *port
         scsi_target_count
         scsi_initiator_count
         io_app_count
         logical_port_count
         scsi_target_app_count
         scsi_initiator_app_count
         active_io_read_count
         active_io_write_count
         scsi_target_it_flow_count
         scsi_initiator_it_flow_count
         scsi_target_itl_flow_count
         scsi_initiator_itl_flow_count
         scsi_target_tl_flow_count
         total_abts_count
         total_read_io_count
         total_write_io_count
         total_seq_read_io_count
         total_seq_write_io_count
         total_read_io_time
         total_write_io_time
         total_read_io_initiation_time
         total_write_io_initiation_time
         total_read_io_bytes
         total_write_io_bytes
         total_read_io_inter_gap_time
         total_write_io_inter_gap_time
         total_time_metric_based_read_io_count
         total_time_metric_based_write_io_count
         total_time_metric_based_read_io_bytes
         total_time_metric_based_write_io_bytes
         read_io_rate
         peak_read_io_rate
         write_io_rate
         peak_write_io_rate
         read_io_bandwidth
         peak_read_io_bandwidth
         write_io_bandwidth
         peak_write_io_bandwidth
         read_io_size_min
         read_io_size_max
         write_io_size_min
         write_io_size_max
         read_io_completion_time_min
         read_io_completion_time_max
         write_io_completion_time_min
         write_io_completion_time_max
         read_io_initiation_time_min
         read_io_initiation_time_max
         write_io_initiation_time_min
         write_io_initiation_time_max
         read_io_inter_gap_time_min
         read_io_inter_gap_time_max
         write_io_inter_gap_time_min
         write_io_inter_gap_time_max
         peak_active_io_read_count
         peak_active_io_write_count
         read_io_aborts
         write_io_aborts
         read_io_failures
         write_io_failures
         read_io_timeouts
         write_io_timeouts
         read_io_scsi_check_condition_count
         write_io_scsi_check_condition_count
         read_io_scsi_busy_count
         write_io_scsi_busy_count
         read_io_scsi_reservation_conflict_count
         write_io_scsi_reservation_conflict_count
         read_io_scsi_queue_full_count
         write_io_scsi_queue_full_count
         read_io_rate_exceed_count
         write_io_rate_exceed_count
         read_io_bandwidth_exceed_count
         write_io_bandwidth_exceed_count
         read_io_size_min_exceed_count
         read_io_size_max_exceed_count
         write_io_size_min_exceed_count
         write_io_size_max_exceed_count
         read_io_initiation_time_min_exceed_count
         read_io_initiation_time_max_exceed_count
         write_io_initiation_time_min_exceed_count
         write_io_initiation_time_max_exceed_count
         read_io_completion_time_min_exceed_count
         read_io_completion_time_max_exceed_count
         write_io_completion_time_min_exceed_count
         write_io_completion_time_max_exceed_count
         read_io_inter_gap_time_min_exceed_count
         read_io_inter_gap_time_max_exceed_count
         write_io_inter_gap_time_min_exceed_count
         write_io_inter_gap_time_max_exceed_count
         read_io_abort_exceed_count
         write_io_abort_exceed_count
         read_io_failure_exceed_count
         write_io_failure_exceed_count
         sampling_start_time
         sampling_end_time

        (* - indicates the metric is a 'key' for the table)


This example shows the list of flow metrics supported in the fc-nvme.port view instance:


Note


The exceed_count counters in the output will be supported in a future Cisco MDS NX-OS Release.


switch# show analytics schema fc-nvme view-instance port

fc-nvme.port table schema columns:
        *port
         nvme_target_count
         nvme_initiator_count
         io_app_count
         logical_port_count
         nvme_target_app_count
         nvme_initiator_app_count
         active_io_read_count
         active_io_write_count
         nvme_target_it_flow_count
         nvme_initiator_it_flow_count
         nvme_target_itn_flow_count
         nvme_initiator_itn_flow_count
         nvme_target_tn_flow_count
         total_abts_count
         total_read_io_count
         total_write_io_count
         total_seq_read_io_count
         total_seq_write_io_count
         total_read_io_time
         total_write_io_time
         total_read_io_initiation_time
         total_write_io_initiation_time
         total_read_io_bytes
         total_write_io_bytes
         total_read_io_inter_gap_time
         total_write_io_inter_gap_time
         total_time_metric_based_read_io_count
         total_time_metric_based_write_io_count
         total_time_metric_based_read_io_bytes
         total_time_metric_based_write_io_bytes
         read_io_rate
         peak_read_io_rate
         write_io_rate
         peak_write_io_rate
         read_io_bandwidth
         peak_read_io_bandwidth
         write_io_bandwidth
         peak_write_io_bandwidth
         read_io_size_min
         read_io_size_max
         write_io_size_min
         write_io_size_max
         read_io_completion_time_min
         read_io_completion_time_max
         write_io_completion_time_min
         write_io_completion_time_max
         read_io_initiation_time_min
         read_io_initiation_time_max
         write_io_initiation_time_min
         write_io_initiation_time_max
         read_io_inter_gap_time_min
         read_io_inter_gap_time_max
         write_io_inter_gap_time_min
         write_io_inter_gap_time_max
         peak_active_io_read_count
         peak_active_io_write_count
         read_io_aborts
         write_io_aborts
         read_io_failures
         write_io_failures
         read_io_timeouts
         write_io_timeouts
         read_io_nvme_lba_out_of_range_count
         write_io_nvme_lba_out_of_range_count
         read_io_nvme_ns_not_ready_count
         write_io_nvme_ns_not_ready_count
         read_io_nvme_reservation_conflict_count
         write_io_nvme_reservation_conflict_count
         read_io_nvme_capacity_exceeded_count
         write_io_nvme_capacity_exceeded_count
         read_io_rate_exceed_count
         write_io_rate_exceed_count
         read_io_bandwidth_exceed_count
         write_io_bandwidth_exceed_count
         read_io_size_min_exceed_count
         read_io_size_max_exceed_count
         write_io_size_min_exceed_count
         write_io_size_max_exceed_count
         read_io_initiation_time_min_exceed_count
         read_io_initiation_time_max_exceed_count
         write_io_initiation_time_min_exceed_count
         write_io_initiation_time_max_exceed_count
         read_io_completion_time_min_exceed_count
         read_io_completion_time_max_exceed_count
         write_io_completion_time_min_exceed_count
         write_io_completion_time_max_exceed_count
         read_io_inter_gap_time_min_exceed_count
         read_io_inter_gap_time_max_exceed_count
         write_io_inter_gap_time_min_exceed_count
         write_io_inter_gap_time_max_exceed_count
         read_io_abort_exceed_count
         write_io_abort_exceed_count
         read_io_failure_exceed_count
         write_io_failure_exceed_count
         sampling_start_time
         sampling_end_time

        (* - indicates the metric is a 'key' for the table)


Troubleshooting SAN Analytics

Due to an ASIC issue, it is possible that the ITO table is not flushed, if the response to an exchange is received on another link (due to port channel flap or such rare occasions). This event itself does not affect analytics. But if this happens for a large number of ITLs and if there is a lot of churn in the fabric (such that the ITLs which had an ITO table hitare now quiet and a fresh set of ITLs are now active in the fabric), then scale can be affected. An error can occur in AMC when the scale limits are exceeded. On 64G modules and switches the analytics are collected via the AlertMgrCollector(AMC).

The AMC reset feature provides a non-disruptive recovery of analytics by resetting only the ASIC analytics. You can reset the AMC on the line card using the analytics reset module <module-number> command. For scale limits, see the Cisco MDS NX-OS Configuration Limits, Release 9.x.

This command resets only the AMC modules and flushes all the entries in the table and recover the AMC from ITO_HIT_ON_CMD.

For example:

switch # analytics reset module 6
switch # 2022 Jun 15 12:24:48 sw184-9706 %ANALYTICS_LC_MGR-SLOT6-5-ANALYTICS_LC_MGR_RESET_SUCCESS:
Analytics reset successful on module 6

On a successful reset, following syslog will be seen:

switch# 2022 Mar 13 22:35:54 switch
        %ANALYTICS_LC_MGR-SLOT6-5-ANALYTICS_LC_MGR_RESET_SUCCESS: Reset of Analytics engine
        succeeded. 

On failure to reset, following syslog will be seen:

switch# 2022 Mar 13 22:35:54 switch
        %ANALYTICS_LC_MGR-SLOT6-3-ANALYTICS_LC_MGR_RESET_FAILURE: Reset of Analytics engine
        failed

If a failure syslog is seen, collect the tech-support and reload the module for recovery.