Monitoring VM Host Metrics
Beginning with release 25.0(1), support is available for monitoring metrics for the VM host where the Cisco Cloud APIC is deployed using the Prometheus Node Exporter. The Prometheus Node Exporter provides visibility to a wide variety of hardware and kernel-related metrics, where it collects technical information from Linux nodes, such as CPU, disk, and memory statistics. For overview information on the Prometheus Node Exporter, see:
https://prometheus.io/docs/introduction/overview/
If your Cisco Cloud APIC is running on release 25.0(1) or later, the Prometheus Node Exporter is automatically available by default.
Guidelines and Limitations
HTTP is not supported for monitoring metrics using the Prometheus Node Exporter. Only HTTPS is supported for monitoring metrics using the Prometheus Node Exporter.
Monitoring VM Host Metrics Using the GUI
These procedures describe how to enable the Prometheus Node Exporter to monitor VM host metrics using the GUI.
Procedure
| Step 1 |
In the Cisco Cloud APIC GUI, navigate to , then click on the Management Access tab. |
| Step 2 |
In the HTTPS area to the right of the window, note the entry in the Node Exporter field. 
|
| Step 3 |
Click the pencil icon in the HTTPS area to edit the HTTPS settings. The HTTPS Settings window appears. |
| Step 4 |
Locate the Node Exporter field and click Enable. 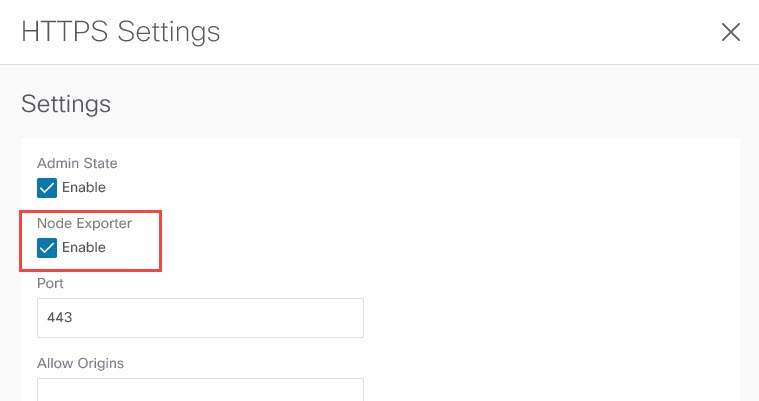
A warning message appears, telling you that saving these settings will restart the web service, and that it will take a moment for it to resume responding to requests. Click OK to confirm these changes. |
| Step 5 |
At the bottom of the window, click Save. You are returned to the System Configuration/Management Access window. The web service reboots and comes back online in a few seconds. |
| Step 6 |
In the HTTPS area to the right of the window, verify that the entry in the Node Exporter field is set to Enabled. This verifies that the Prometheus Node Exporter is enabled. 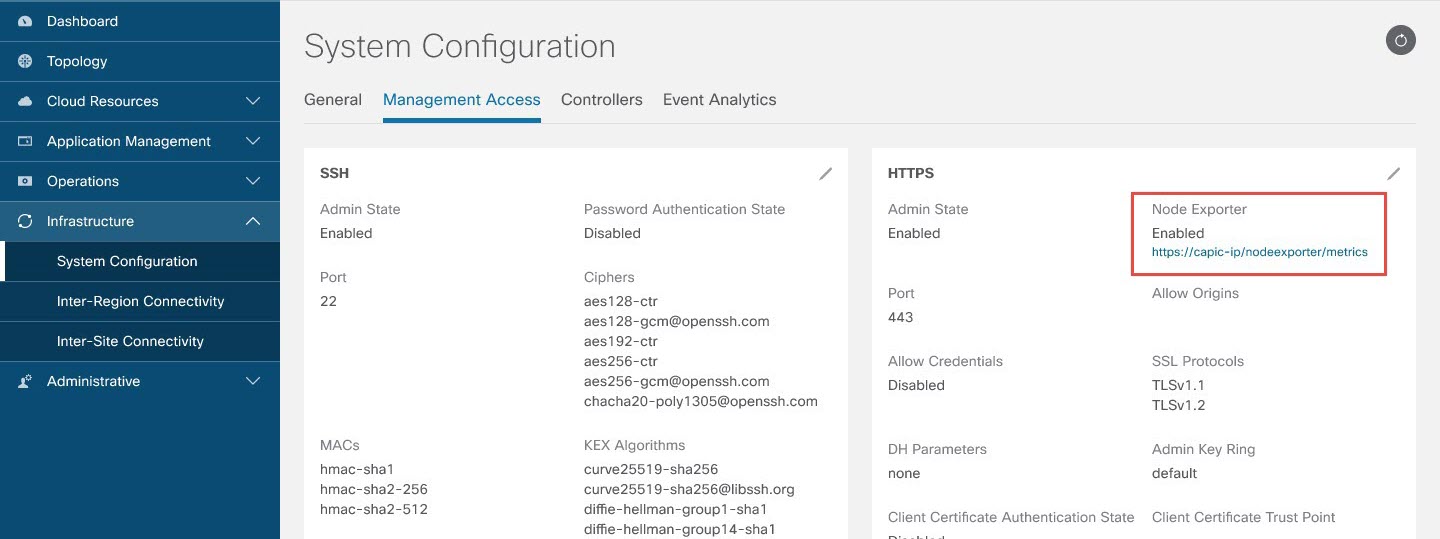
|
| Step 7 |
Click the link under the Enabled text in the Node Exporter area. Another tab in your browser appears, showing the metrics for the VM host where the Cisco Cloud APIC is deployed. |
Monitoring VM Host Metrics Using the REST API
These procedures describe how to enable the Prometheus Node Exporter to monitor VM host metrics using the REST API.
Procedure
| Step 1 |
To determine if the Prometheus Node Exporter is enabled or not, send the following GET call: Locate the |
| Step 2 |
To monitor VM host metrics, send the following post to enable the Prometheus Node Exporter: The metrics are displayed for the VM host where the Cisco Cloud APIC is deployed. |
| Step 3 |
To view the metrics using REST API, send the following GET call: |
| Step 4 |
To disable the Prometheus Node Exporter, send the following post: |

 Feedback