Cisco Cloud APIC Statistics

About Cisco Cloud APIC Statistics

Cisco Cloud Application Policy Infrastructure Controller (APIC) supports statistics that are collected from the cloud routers. Additionally, it supports statistics that are derived by processing Amazon Web Services (AWS) flow logs. Because AWS flow logs is not a free service, the Cisco Cloud APIC provides a policy that allows you to control this feature. This feature is not enabled by default.

For more information about CloudWatch and flow logs, see "VPC Flow Logs" for Amazon Virtual Private Cloud on the AWS website.

Beginning in Cisco Cloud APIC Release 5.0(1), you can do the following:

  • You can use filters to see specific information from the AWS flow logs. You can define up to eight filters for a given flow log policy (or VPC) at the same time. You can filter for a combination of source or destination IP address, port and protocol. See Cisco Cloud APIC Statistics Filters for more information.

  • You can collect statistics for traffic to and from AWS Transit Gateways. See the section AWS Transit Gateway Statistics in this guide.

AWS Networking Interface Statistics Collection

AWS provides the nonreal-time IP traffic information per network interface through flow logs. Cisco Cloud APIC provides a policy for enabling flow logs per cloudCtxProfile. Because the cloudCtxProfile maps to a VPC in AWS, enabling flow logs per cloudCtxProfile or VPC means that you enabled flow logs for each interface belonging to that VPC. Once flow logs are enabled, flow records are periodically pushed to AWS Cloudwatch. The Cisco Cloud APIC then periodically polls AWS CloudWatch for these flow records and parses these records to extract statistics. Because it can take up to 15 minutes to publish flow records to CloudWatch, the Cisco Cloud APIC delays its flow logs query to CloudWatch by 15 minutes too. This means that there is a lag between the flow logs being present in CloudWatch and the corresponding statistics showing up on the Cisco Cloud APIC. Cisco Cloud APIC does not process flow records that take longer than 15 minutes to publish to CloudWatch.

Cisco Cloud APIC Endpoints and cloudEPg Statistics Processing

The Cisco Cloud APIC extracts the following statistics for each AWS networking endpoint that has flow logs present in CloudWatch:

  • Number of bytes or packets sent (egress)

  • Number of bytes or packets received (ingress)

  • Number of bytes or packets rejected (egress drop)

  • Number of bytes or packets dropped (ingress drop)

These statistics are associated with the cloudEpInfoHolder observable.

Also, the Cisco Cloud APIC maps the flow log records to one or more per region cloudEPg objects. This is because a cloudEPg can be present in multiple regions. These statistics are associated with the cloudRgInfoHolder observable. This observable is a child of cloudEPg and the accumulation of statistics for the cloudRgInfoHolder children results in statistics for cloudEPg. The cloudEPg supports the following statistics:

  • Number of bytes or packets sent (egress)

  • Number of bytes or packets received (ingress)

  • Number of bytes or packets rejected (egress drop)

  • Number of bytes or packets dropped (ingress drop)

The cloudEPg statistics are aggregated up fvApp and then up fvTenant.

Cisco Cloud APIC Statistics Filters

Beginning in Cisco Cloud Application Policy Infrastructure Controller Release 5.0(1), you can use filters to see specific information from the Amazon Web Services (AWS) flow logs.

Statistics are collected for each endpoint on which the filter is deployed. The filters enable you to see information about a flow, filtered by a combination of source or destination IP address, port, and protocol. You can define up to eight filters for a given AWS log group at the same time.

A statistics filter has the following three attributes:

  • PeerIP: The IPv4 address to filter

  • PeerPort: The port number to listen to

  • Protocol: The protocol number to listen to


Note

We recommend that you configure statistics filters using the Cisco Cloud APIC GUI. You can alternatively use REST API; however, if you do and then switch to the GUI, the feature will appear incomplete. You should stick to the method that you choose.

Use of statistics filters depend on enabling Virtual Private Cloud (VPC) flow log; you must enable the logs before you configure the statistics filters.

Flow logs, which are stored in AWS CloudWatch, consist of flow log records. Cisco Cloud Application Policy Infrastructure Controller (APIC) extracts statistics by parsing the flow log records.

It can take up to 15 minutes from the occurrence of a particular flow record to its being present in AWS CloudWatch. Cisco Cloud APIC polls for flow records that occurred 15 minutes or more in the past. It does not process flow records that take longer than 15 minutes to appear in AWS CloudWatch.

AWS Transit Gateway Statistics

You can collect statistics for traffic going through Amazon Web Services (AWS) Transit Gateways on both the infra tenant and the user tenant. Statistics reported for user tenant represent the traffic of an attachment between an user VPC and an AWS Transit Gateway. Statistics reported from infra tenant represents the traffic of an attachment between an infra VPC and a Transit Gateway.

The following statistics are collected for AWS Transit Gateway:

  • Ingress packets

  • Ingress packet bytes

  • Ingress packet drops

  • Ingress packet drop bytes

  • Egress packets

  • Egress packet bytes

  • Egress packet drops

  • Egress packet drop bytes

You can enable infra tenant Transit Gateway statistics collection from the Cisco Cloud Application Policy Infrastructure Controller Setup - Region Management page. See the section "Set Up the Cloud Site to Use AWS Transit Gateway" in Increasing Bandwidth Between VPCs by Using AWS Transit Gateway.

You can enable user tenant Transit Gateway statistics collection by enabling flow logs on the user VPC. See the sections Enabling VPC Flow Logs and Enabling VPC Flow Logs Using the Cisco Cloud APIC GUI in this guide.

To view AWS Transit Gateway statistics, in the Cisco Cloud APIC GUI, click the Statistics tab and then click AWS Transit Gateway in the left navigation pane. The central pane displays the information.

Enabling VPC Flow Logs

Steps to enable VPC Flow Logs:

  1. Define a log group policy.

  2. Define a flow log policy and associate the log group that you defined in the first step.

  3. Associate the flow log policy to one or more cloudCtxProfile.

Log group properties:

  • name—The location in CloudWatch where flow logs are sent.


    Note

    The actual log group name that is programmed in AWS is the concatenation of <tenant name><cloudCtxProfile name><log group name>.


  • retention—The length of duration for storing the logs in CloudWatch. The default is 5-days.

Flow log properties:

  • trafficType—The type of traffic to collect. Supported types are all, accepted only, and rejected only. The default is all.

Enabling VPC Flow Logs Using the Cisco Cloud APIC GUI

This section explains how to enable VPC flow logs using the Cisco Cloud APIC GUI.


Note

If you want to use filters to see specific information from AWS flow logs, perform the optional steps in this procedure.

Procedure


Step 1

Click the Navigation menu and choose Application Management > Tenants.

The Tenants window appears with the tenants listed as rows in a summary table.

Step 2

Double-click on a tenant.

The tenant dialog box appears over the Work pane. The tenant dialog box displays the Overview, Cloud Resources, Application Management, Statistics, and Event Analytics tabs.

Step 3

Click the Statistics tab.

The EPGs, CCRs, and Flow Log Collection subtabs appear.

Step 4

Click Flow Log Collection.

The Flow Log Collection Settings information appears at the top of the dialog box with the edit icon in the top-right corner.

Step 5

Click the edit icon.

The Flow Log Collection Settings dialog box appears.

Step 6

Enter the appropriate values in each field as listed in the following Flow Log Collection Settings Dialog Box Fields table then continue.

Table 1. Flow Log Collection Settings Dialog Box Fields

Properties

Description

Type of Traffic to be Logged

Click the Type of Traffic to be Logged drop-down list and choose one of the following options:

  • All Traffic (default)

  • Accepted Only Traffic

  • Rejected Only Traffic

Destination

Click the Destination drop-down list and choose CloudWatch (default).

Retention

Click the Retention drop-down list and chose from the following options:

  • 1 day

  • 3 days

  • 5 days (default)

  • 1 month

  • 13 months

  • 18 months

  • 2 months

  • 3 months

  • 4 months

  • 5 months

  • 6 months

  • 1 week

  • 2 weeks

  • 1 year

  • 10 years

  • 2 years

  • 5 years

Step 7

(Optional) Add flow filters to get information about source and destination IP addresses, ports, or protocols by completing the following tasks:

For information about statistics filters, see the section Cisco Cloud APIC Statistics Filters.

  1. Click Add Flow Filters at the bottom of the Flow Log Collection Settings dialog box.

    Fields for the filter attributes appear.

    After you click on the Add Flow Filters button, you will see a new filter being created; fill out the attributes.

  2. In the Peer IP field, enter the IPv4 IP address of the peer.

    The address needs to be in the format x.x.x.x/x. It tells the filter which network to monitor. An address of 0.0.0.0/0 will match all.

  3. (Optional) From the Protocol drop-down list, choose a protocol to listen to.

    The choices are integers from 0 to 255. Entering 255 will match any protocol. Well-known protocols are translated when text format is given:

    • "icmp": 1

    • "igmp": 2

    • "tcp": 6

    • "egp": 8

    • "igp": 9

    • "l2tp": 115

    • "udp": 17

    • "icmpv6": 58

    • "eigrp": 88

    • "ospfigp": 89

    • "pim": 103

  4. (Optional) In the Peer Port field, enter the port number to listen to.

    This number must be an integer from 0 to 65535 or text input for a well-known port number. Entering 0 will match any port. Well-known protocols are translated when text format is given:

    • "dns": 53

    • "ftpData": 20

    • "smtp": 25

    • "http": 80

    • "https": 443

    • "rtsp": 554

    • "pop3": 110

  5. (Optional) Check the Active check box and then click the check icon.

Step 8

Click Save.


Enabling VPC Flow Logs Using the REST API

This section demonstrates how to enable VPC flow logs using the REST API.

Procedure


Step 1

Create a log group:


<cloudAwsLogGroup name="lg1" retention="days-3" status="">
    </cloudAwsLogGroup>
Step 2

Create a flow log policy:


<cloudAwsFlowLogPol name="flowLog1" trafficType="ALL" status="">
        <cloudRsToLogGrp tDn="uni/tn-t20/loggrp-lg1" status=""/>
    </cloudAwsFlowLogPol>
Step 3

Create a relationship from a CtxProfile to a flow log policy:


    <cloudCtxProfile name=" vrf1" status="">
      <cloudRsCtxToFlowLog tnCloudAwsFlowLogPolName="flowLog1" status=""/>
    </cloudCtxProfile>

Cloud Router Statistics

These statistics are available for the cloud router:

  • Ingress packets

  • Egress packets

  • Ingress bytes

  • Egress bytes

The Cisco Cloud Application Policy Infrastructure Controller (APIC) collects and stores the cloud router statistics by the following granularities:

  • 15-minutes

  • 1-hour

  • 1-month

  • 1-year

Collection Mechanism

Each cloud router instance captures and stores the previously mentioned 4-stat values for each physical and tunnel interface.

The Cisco Cloud Application Policy Infrastructure Controller (APIC) queries the cloud routers for these statistics and maps the response to cloud router statistics on the Cisco Cloud APIC. The statistics query repeats every 5 minutes for as long as the tunnel is up and operational.

Raw Statistics

The raw statistics are stored under 2 Dns:

  • uni/tn-<infraTenant>/ctx-<infraCtx>/region-<infraRegion>/router-<csrname>/to-<ip or user-region>/tunn-<tunnel-id>

  • uni/tn-<userTenant>/ctx-<userCtx>/region-<userRegion>/region-<infraRegion>/router-<csrname>/tunn-<tunnel-id>


    Note

    • The second Dn holder is the statistics as seen from the user endpoints connected to the cloud router. These statistics are hence flipped (Ingress on the CCR becomes egress on the user region)

    • Not all tunnels have a corresponding user dn. This is only applicable to internal tunnels. External tunnels statistics are only available on the 1st Dn.


In the following figure, internal tunnels are between the user VPC and infra VPC. The infra VPC contains the CCR router. The user VPC can contain the CCR or VGW router. Cisco Cloud APIC creates these tunnels. As a result, statistics are available for both the infra side and the user side. External tunnels are between infra VPC and an external IP address. Statistics are only available on the infra side (Dn-1).
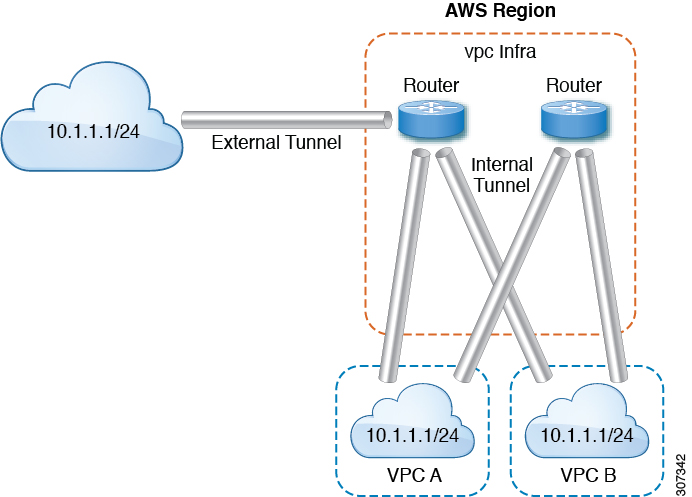
In the logical model diagram, a tenant can be infra or a user tenant. You configure a VRF (or fvCtx) to be inside a tenant (per tenant). A VRF can be within one region or span across multiple regions.

Aggregated Statistics

Statistics are aggregated at each parent level of the DN. For the preceding case, statistics on tunnel, statistics are aggregated on to the destination IP, cloud router, region, vrf (ctx), and tenant.

For example, if you want to find the egress packets from the infra cloud router to a user region, it is available under uni/tn-<infraTenant>/ctx-<infraCtx>/region-<infraRegion>/router-<csrname>/to-<ip or user-region>/

If you want to get all the packets between user region1 and infra region2, it is available under uni/tn-<userTenant>/ctx-<userCtx>/region-<userRegion>/region-<infraRegion>/

Also, if you want to find statistics per cloudCtxProfile, it is available under uni/tn-<userTenant>/ctx-<userCtx>/region-<userRegion>/ or uni/tn-<infraTenant>/ctx-<infraCtx>/region-<infraRegion>/.

Cloud Router GUI Statistics

In the Cisco Cloud APIC GUI, statistics are visible available under the tenant, VRF, infra region, and cloud context profile.

For Amazon Web Services (AWS) Transit Gateway stats, in the Cloud Context Profile work pane, click AWS Transit Gateway For all other stats, in the Cloud Context Profile work pane, click Endpoints.