Configuration Drifts

Configuration Drift Notifications and Faults

When you deploy Cisco ACI in a public cloud, you will perform most of the fabric configuration from the Cloud APIC. However, there may be cases where you or another cloud administrator changes the deployed configuration directly in the cloud provider's GUI using the tools provided by AWS or Azure. In these cases, the intended configuration you deployed from the Cloud APIC and the actual configuration in the cloud site may become out of sync, we call this a configuration drift.

Starting with release 5.0(2), Cloud APIC provides visibility into any security policy (contracts) configuration discrepancy between what you deploy from the Cloud APIC and what is actually configured in the cloud site.


Note

  • Beginning with release 25.0(1), configuration drift information is available for EPGs and VRFs, in addtion to contracts.

  • Beginning with release 25.0(4), contract drift information is available for contracts with or without Layer 4 to Layer 7 service graphs attached.

See Updates in Release 25.0(4) for more information.


There are two aspects to analyzing configuration drift:

  • Have all the fabric elements configured in the Cloud APIC and intended to be deployed in the cloud fabric been properly deployed?

    This scenario can occur due to user configuration errors in Cloud APIC that could not be deployed in the cloud, connection or API issues on the cloud provider end, or if a cloud administrator manually deletes or modifies security rules directly in the cloud provider's UI. Any intended but missing configurations may present an issue for the Cloud APIC fabric.

  • Are there any additional configurations that exist in the cloud but were not intended to be deployed from the Cloud APIC?

    Similarly to the previous scenario, this can occur if there are connection or API issues or if a cloud administrator manually creates additional security rules directly in the cloud provider's UI. Any existing but not intended configuration may present issues.

Updates in Release 25.0(4)

Beginning with release 25.0(1), configuration drift information is available for EPGs and VRFs, in addtion to contracts.

Beginning with release 25.0(4), the following changes have been made for configuration drift:

  • Configuration drift is now enabled by default.

  • Prior to release 25.0(4), configuration drift information was not available for contracts that had Layer 4 to Layer 7 service graphs attached. Beginning with release 25.0(4), contract drift information is now available for contracts with or without Layer 4 to Layer 7 service graphs attached. See Deploying Layer 4 to Layer 7 Services for more information.

  • Configuration drift information is now consolidated under a single page, located at Cloud Resources > Drifts.

    See Accessing the Main Configuration Drift Page for more information.

Accessing the Main Configuration Drift Page

Beginning with release 25.0(4), configuration drift information is now consolidated under a single Drifts page.

The Drifts page is used to provide the following pieces of information:

  • To identify if something has been deleted

  • To ensure that anything that should be present is correctly shown as present

Procedure


Step 1

Log in to your Cloud APIC GUI.

Step 2

Navigate to the main configuration drift page:

Cloud Resources > Drifts

The consolidated Drifts page appears.

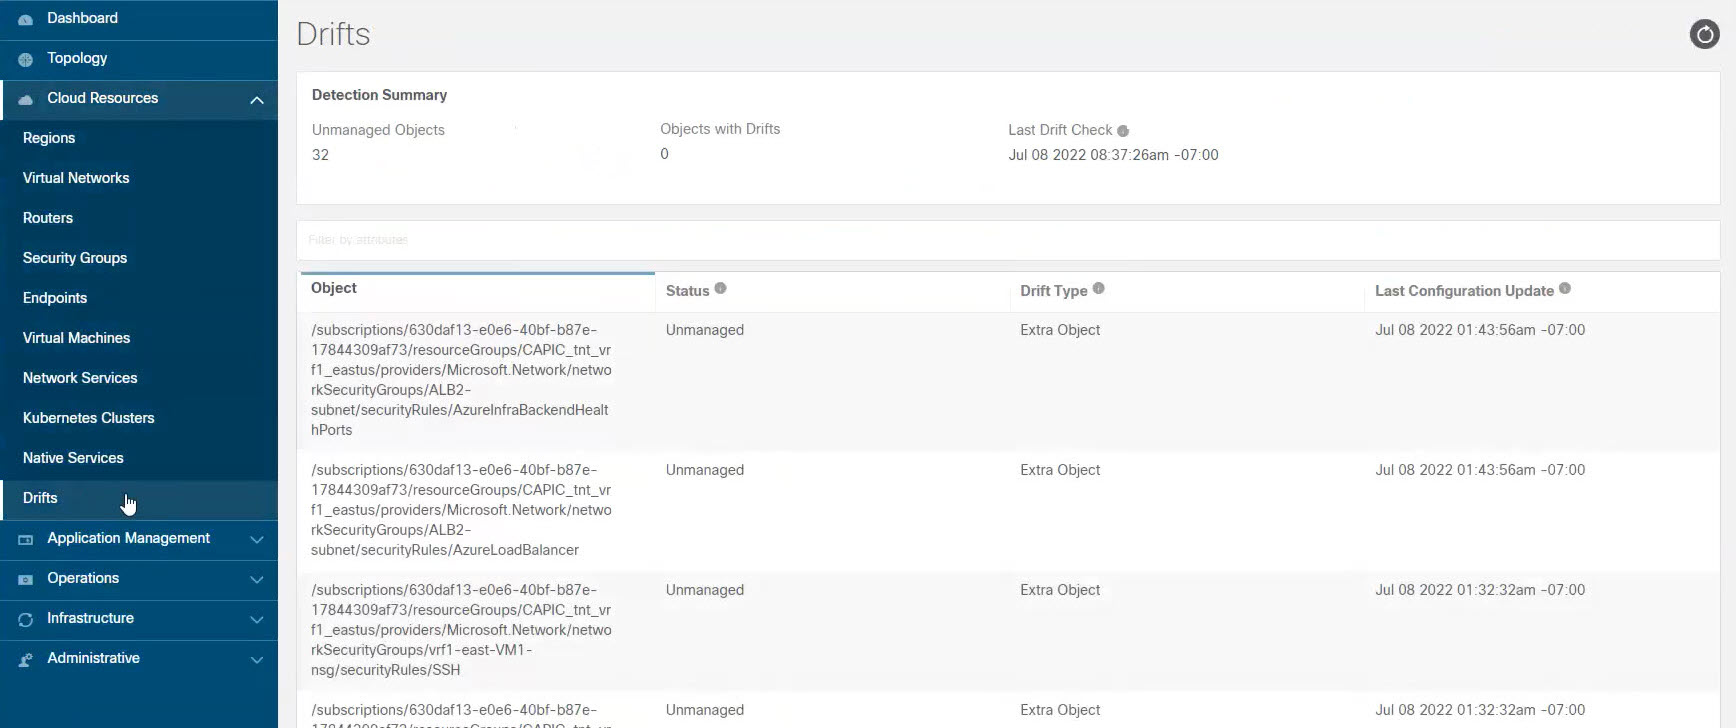
In the Drifts page, you can see a summary of any configuration issues in your fabric.

The Detection Summary area provides an overview of how many configuration drifts were detected with managed or unmanaged objects, and the time when this information was last updated. If the inventory update timestamp is out of date, you can refresh the information by clicking the Refresh icon in the top right corner of this screen.

Step 3

Use the information in the table below the Detection Summary area to find any configuration drifts.

  • Object: Provides information on the object associated with the configuration drift.

  • Status: Following are the different values that might appear in the Status column:

    • Transient (low): Drifts that are likely due to recent configuration changes. We recommend waiting for the fabric to stabilize and the drift will likely resolve on its own after the next configuration refresh.

    • Presumed (medium): Drifts that may or may not be transient. We recommend monitoring the status and troubleshoot the configuration should the drift persist.

    • Raised (high): Critical drifts. We recommend verifying the configuration on Cloud APIC and checking for any associated faults. Redeploying the configuration may help resolve communication issues between the Cloud APIC and cloud services. If the issue persists, check the tech-support logs.

    • Unmanaged: Configuration drifts related to extra inventory objects not created through the Cisco Cloud APIC.

  • Drift Type: Following are the different values that might appear in the Drift Type column:

    • Configuration: External changes on the cloud providers site that could result in the intended configuration and the actual configuration being out of sync. Used for configuration drifts related to EPGs or VRFs.

    • Rule: External changes on the cloud providers site that could result in the intended security rules and the expected rules that are established through a contract being out of sync. Used for configuration drifts related to contracts.

    • Extra Object: Used to show extra inventory objects that were not created through the Cisco Cloud APIC. Cisco Cloud APIC does not perform drift detection on these objects.

  • Last Configuration Update: Provides information on when the last configuration update occurred.

Step 4

Enter information in the filter line to filter the configuration drifts provided in the table, if necessary.

  1. Click in the filter line below the Detection Summary area. The following filter types appear:

    • Object

    • Status

    • Drift Type

    • Last Configuration Update

    • Parent Path

    Select the appropriate type for your filter.

  2. Click the necessary operator.

    The options are:

    • ==: The equal-to operator

    • !=: The not-equal-to operator

  3. Click the necessary drift type.

    The options are Extra Object, Rule, and Configuration. See the explanations for the Drift Type field above for more information.

The entries in the table are filtered based on your selections above.

Step 5

View additional information on a specific configuration drift, if necessary.

For any object listed in this page, you can bring up additional configuration drift information by clicking the appropriate line in the Configuration Drifts table. A side panel appears with additional information on this particular configuration drift; clicking the Details icon () automatically brings you to the appropriate Cloud Mapping page for this particular object.

Refer to the following sections for additional configuration drift information for specific objects:


Checking for Missing Contracts Configuration

This section describes how to check for any contract settings you have configured from the Cloud APIC, but which have not been properly deployed to the cloud fabric.

Procedure


Step 1

Log in to your Cloud APIC GUI.

Step 2

Click Application Management > Contracts.

Step 3

Double-click the appropriate contract to bring up the Overview page for that contract.

Step 4

Note the service graph information provided in the Service Graph area, if applicable.

Prior to release 25.0(4), configuration drift information was not available for contracts that had Layer 4 to Layer 7 service graphs attached. Beginning with release 25.0(4), contract drift information is now available for contracts with or without Layer 4 to Layer 7 service graphs attached. See Deploying Layer 4 to Layer 7 Services for more information.

Step 5

Click the Cloud Mapping tab.

The Cloud Mapping view displays all the information about the contract and the cloud resources it uses.

Note 

You can also navigate to this page by navigating to Cloud Resources > Drifts, then clicking the appropriate line in the Configuration Drifts table. A side panel appears with additional information on this particular configuration drift; clicking the Details icon () automatically brings you to the appropriate Cloud Mapping page for this particular object. See Accessing the Main Configuration Drift Page for more information.
The screen is divided into four sections: Detection Summary, Related Objects, Configuration Drifts, and Presented Cloud Resources. Each section contains a table that lists the respective information about the contract you selected.

  • The Detection Summary area provides an overview of how many configuration drifts were detected, number of intended and actual cloud resources configured, and the time when this information was last updated. If the inventory update timestamp is out of date, you can refresh the information by clicking the Refresh icon in the top right corner of this screen.

  • The Related Objects area shows any other objects that have a relation to the contract, such as consumer and provider EPGs, and filters.

  • The Configuration Drifts table lists all the issues with the contract rules. Specifically, all the contract rules that were intended to be deployed but are missing in the actual fabric configuration.

    The table contains detailed information, such as the protocol used, port ranges, source and destination IP or group, consumer and provider EPGs, description of the issue, and the recommended action to resolve it. For each configuration drift, the Status field will indicate the severity and recommended action:

    • Transient (low): Drifts that are likely due to recent configuration changes. We recommend waiting for the fabric to stabilize and the drift will likely resolve on its own after the next configuration refresh.

    • Presumed (medium): Drifts that may or may not be transient. We recommend monitoring the status and troubleshoot the configuration should the drift persist.

    • Raised (high): Critical drifts. We recommend verifying the configuration on Cloud APIC and checking for any associated faults. Redeploying the configuration may help resolve communication issues between the Cloud APIC and cloud services. If the issue persists, check the tech-support logs.

  • The Presented Cloud Resources table shows the information about all the resources that were properly configured in your cloud. This table is designed to provide you with better visibility into what rules are configured in your cloud for a specific contract.


Checking for Missing EPGs Configuration

This section describes how to check for any EPG settings you have configured from the Cloud APIC, but which have not been properly deployed to the cloud fabric.

Procedure


Step 1

Log in to your Cloud APIC GUI.

Step 2

Click Application Management > EPGs.

Step 3

Double-click the appropriate EPG to bring up the Overview page for that EPG.

Step 4

Click the Cloud Mapping tab.

The Cloud Mapping view displays all the information about the EPG and the cloud resources it uses.

Note 

You can also navigate to this page by navigating to Cloud Resources > Drifts, then clicking the appropriate line in the Configuration Drifts table. A side panel appears with additional information on this particular configuration drift; clicking the Details icon () automatically brings you to the appropriate Cloud Mapping page for this particular object. See Accessing the Main Configuration Drift Page for more information.
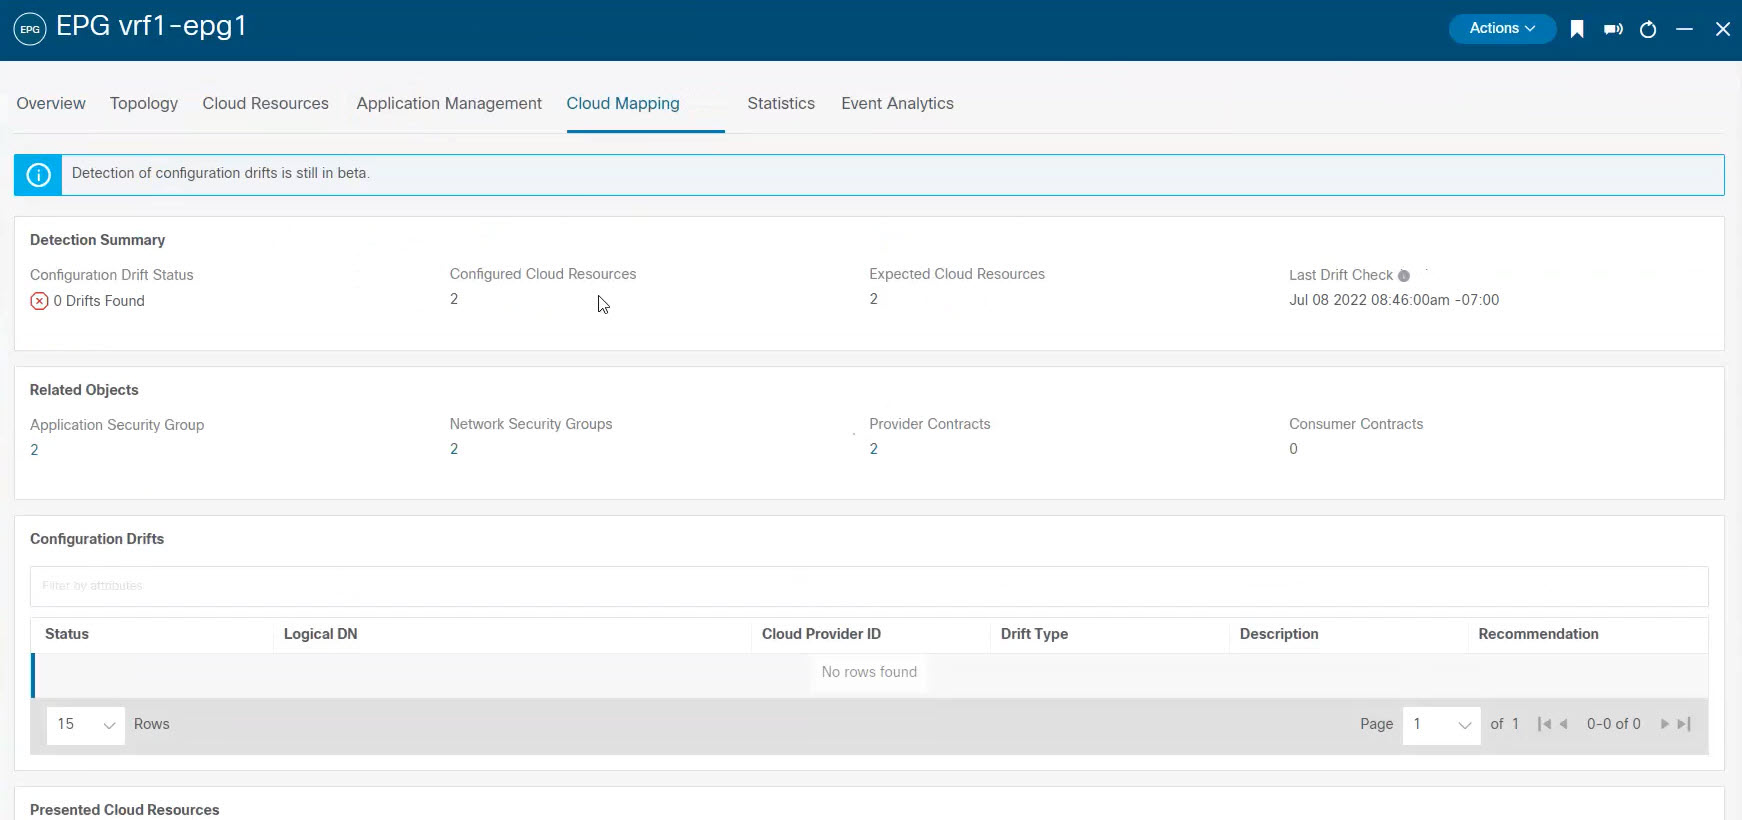
The screen is divided into four sections: Detection Summary, Related Objects, Configuration Drifts, and Presented Cloud Resources. Each section contains a table that lists the respective information about the EPG you selected.

  • The Detection Summary area provides an overview of how many configuration drifts were detected, number of intended and actual cloud resources configured, and the time when this information was last updated. If the inventory update timestamp is out of date, you can refresh the information by clicking the Refresh icon in the top right corner of this screen.

  • The Related Objects area shows any other objects that have a relation to the EPG, such as security groups and contracts.

  • The Configuration Drifts table lists all the issues with the security groups associated with the EPG. Specifically, all the security groups that were intended to be deployed but are missing in the actual fabric configuration.

    The table contains detailed information, such as the logical DN, cloud provider ID, drift type, description of the issue, and the recommended action to resolve it. For each configuration drift, the Status field will indicate the severity and recommended action:

    • Transient (low): Drifts that are likely due to recent configuration changes. We recommend waiting for the fabric to stabilize and the drift will likely resolve on its own after the next configuration refresh.

    • Presumed (medium): Drifts that may or may not be transient. We recommend monitoring the status and troubleshoot the configuration should the drift persist.

    • Raised (high): Critical drifts. We recommend verifying the configuration on Cloud APIC and checking for any associated faults. Redeploying the configuration may help resolve communication issues between the Cloud APIC and cloud services. If the issue persists, check the tech-support logs.

  • The Presented Cloud Resources table shows the information about all the resources that were properly configured in your cloud. This table is designed to provide you with better visibility into what security groups are associated with a specific EPG in your cloud.


Checking for Missing VRFs Configuration

This section describes how to check for any VRF settings you have configured from the Cloud APIC, but which have not been properly deployed to the cloud fabric.

Procedure


Step 1

Log in to your Cloud APIC GUI.

Step 2

Click Application Management > VRFs.

Step 3

Double-click the appropriate VRF to bring up the Overview page for that VRF.

Step 4

Click the Cloud Mapping tab.

The Cloud Mapping view displays all the information about the VRF and the cloud resources it uses.

Note 

You can also navigate to this page by navigating to Cloud Resources > Drifts, then clicking the appropriate line in the Configuration Drifts table. A side panel appears with additional information on this particular configuration drift; clicking the Details icon () automatically brings you to the appropriate Cloud Mapping page for this particular object. See Accessing the Main Configuration Drift Page for more information.

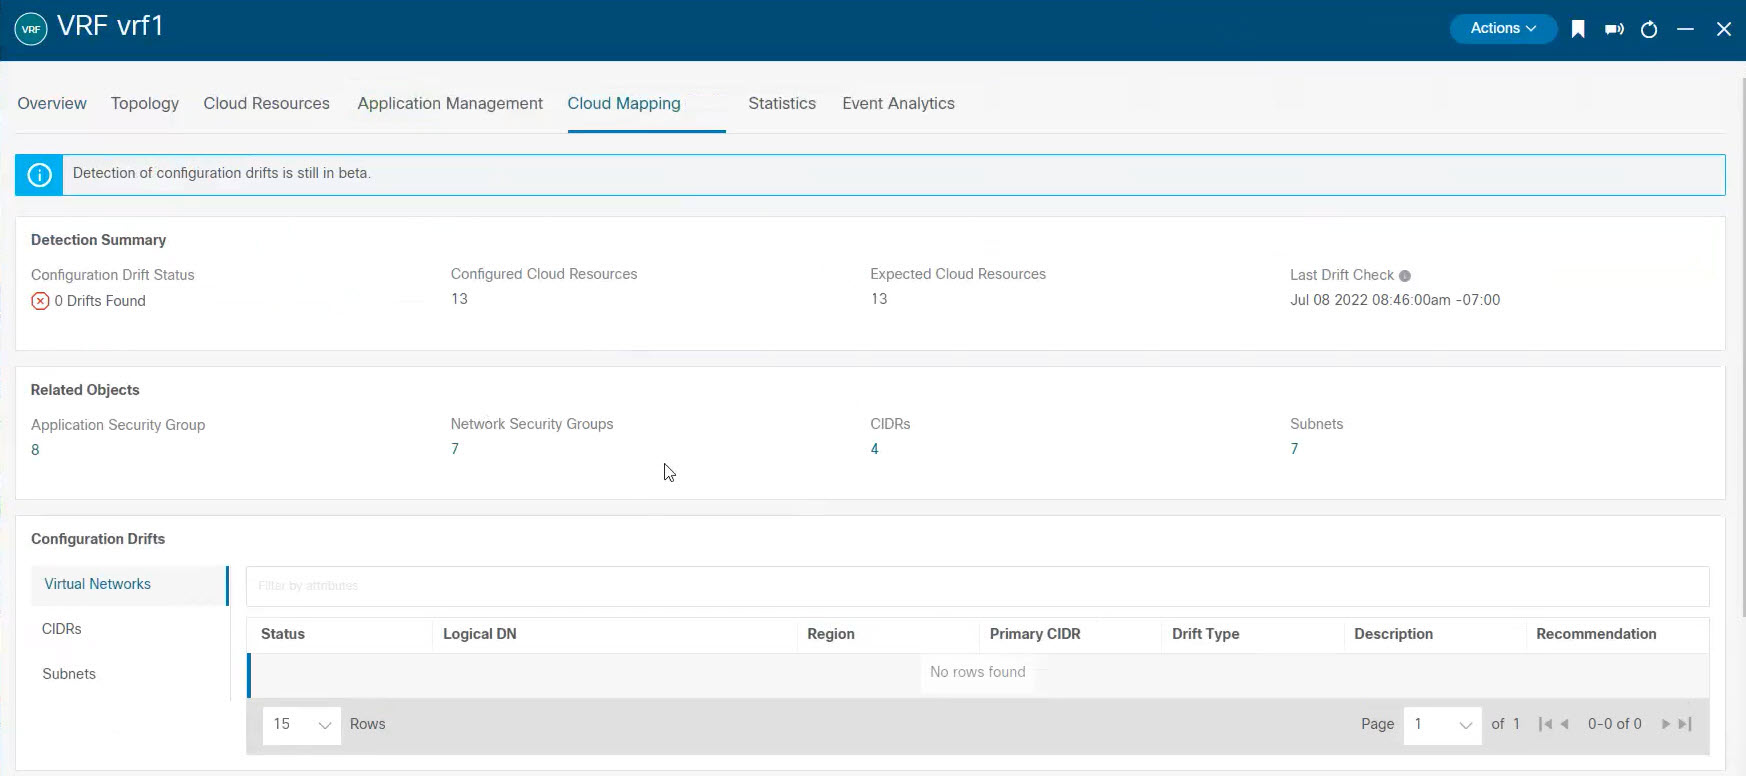
The screen is divided into four sections: Detection Summary, Related Objects, Configuration Drifts, and Presented Cloud Resources. Each section contains a table that lists the respective information about the VRF you selected.

  • The Detection Summary area provides an overview of how many configuration drifts were detected, number of intended and actual cloud resources configured, and the time when this information was last updated. If the inventory update timestamp is out of date, you can refresh the information by clicking the Refresh icon in the top right corner of this screen.

  • The Related Objects area shows any other objects that have a relation to the VRF, such as security groups, CIDRs, and subnets.

  • The Configuration Drifts table lists all the issues with the virtual networks, the CIDRs that are associated with the virtual networks, and the subnets within those CIDRs. Specifically, all the virtual networks, CIDRs, and subnets that were intended to be deployed but are missing in the actual fabric configuration.

    Note that if there are configuration drifts at any one level, the table will show the configuration drift at that level and not any configuration drifts at the levels below it. For example, if a configuration drift occurs at a CIDR level and the corresponding subnets within that CIDR, the table will be display the configuration drifts in the CIDR area but not the configuration drifts for the corresponding subnets within that CIDR.

    The table contains detailed information in these areas:

    • Virtual Networks: Provides information on logical DN, region, primary CIDR, drift type, description of the issue, and the recommended action to resolve it.

    • CIDRs: Provides information on logical DN, region, CIDR block range, whether it is a primary CIDR or not, the subnets within the CIDR, drift type, description of the issue, and the recommended action to resolve it.

    • Subnets: Provides information on logical DN, region, IP address, drift type, description of the issue, and the recommended action to resolve it.

    For each configuration drift, the Status field will indicate the severity and recommended action:

    • Transient (low): Drifts that are likely due to recent configuration changes. We recommend waiting for the fabric to stabilize and the drift will likely resolve on its own after the next configuration refresh.

    • Presumed (medium): Drifts that may or may not be transient. We recommend monitoring the status and troubleshoot the configuration should the drift persist.

    • Raised (high): Critical drifts. We recommend verifying the configuration on Cloud APIC and checking for any associated faults. Redeploying the configuration may help resolve communication issues between the Cloud APIC and cloud services. If the issue persists, check the tech-support logs.

  • The Presented Cloud Resources table shows the information about all the resources that were properly configured in your cloud, split into the same hierarchies that is shown in the Configuration Drifts table (Virtual Networks, CIDRs, and Subnets). This table is designed to provide you with better visibility into what virtual networks, CIDRs, and subnets are associated with a specific VRF in your cloud.


Configuration Drift Troubleshooting

This section provides a few useful command to verify that the configuration drift processes are up and running on your Cloud APIC, check the application logs, and if necessary generate tech support information.

Procedure


Step 1

Log in to the Cisco Cloud APIC via console as a root user.

Step 2

Check the status of the configuration drift application.

ACI-Cloud-Fabric-1# moquery -d pluginContr/plugin-Cisco_CApicDrift | egrep "dn |pluginSt |operSt |version"
dn: pluginContr/plugin-Cisco_CApicDrift
operSt: active
pluginSt: active
Verison: 5.1.0
Step 3

Check the status of the application container.

ACI-Cloud-Fabric-1# docker ps | grep drift
CONTAINER ID    IMAGE           COMMAND                 CREATED         STATUS          NAMES
649af6feb72c    a5ea08bbf541    "/opt/bin/conit.bi..."  13 hours ago    Up 13 hours     drift-api-b703e569-0aa6-859f-c538-a5fecbc5708f
Step 4

Check memory consumed by all Docker containers.

Total amount of memory consumed must be under 12GB.

ACI-Cloud-Fabric-1# systemctl status ifc-scheduler_allocations.slice| grep Memory
Step 5

If necessary, collect the tech support logs.

Logs will be saved in the /data/techsupport directory on the controller.

ACI-Cloud-Fabric-1# trigger techsupport controllers application CApicDrift
ACI-Cloud-Fabric-1# trigger techsupport controllers application CApicDrift vendorName Cisco
Step 6

Check the application logs.

The logs for configuration drift process are stored in the /data2/logs/Cisco_CApicDrift directory.

The runhist.log file provides information about each time the application was started, for example:

# cat runhist.log
1 - Thu Jun 11 23:55:59 UTC 2020
2 - Fri Jun 12 01:19:41 UTC 2020

The drift.log file is the application log file and can be used to view the number of times configuration drift was updated and how long each update took.

# cat drift.log | grep ITER
{"file":"online_snapshot.go:178","func":"Wait","level":"info","msg":"ITER# 109 ENDED ===  RDFGEN TIME: 1m40.383751649s,  MODEL UPLOAD TIME 5m54.245550374s; TOTAL       TIME:: 7m34.629447083s","time":"2020-06-12T19:53:13Z"}