Cable Modem Diagnosis Tool
In a Data-over-Cable Systems Interface Standard (DOCSIS) environment, various elements can affect a modem's ability to maintain a connection and remain online. When a cable modem goes offline, it is difficult to diagnose the cause and identify the issues.
The Cisco cnBR includes a Cable Modem Diagnosis Tool to enable easy diagnosis of such issues. Checkpoints are created periodically for online modems, where information such as system logs, configuration details, and system statistics are saved. When a cable modem goes offline, this system information is analyzed from the saved checkpoints.
The Cable Modem Diagnosis Tool supports the following modes:
-
On-demand mode: System logs related to a modem is collected with a single click, when needed.
-
Background mode: Logs, health metrics and performance metrics are actively analyzed in the background to detect, diagnose, and report modem issues.
The Cable Modem Diagnosis Tool provides the following utilities:
-
Detect malfunctioning modems.
-
Enable debugging for malfunctioning modems and disable debugging when modems are recovered.
-
Supports interactive enabling or disabling of per modem debugging.
-
Display modem logs and telemetry on the Grafana dashboard.
-
Download of modem logs containing modem log messages.
Configure Cable Modem Diagnosis Tool for On-Demand Diagnosis
On-Demand diagnosis allows debugging a cable modem from the Cisco Operations Hub dashboard. On-Demand diagnosis does not require any configuration changes.
Complete the following steps to enable On-Demand Diagnosis:
Procedure
| Step 1 |
Enter the Cisco Operations Hub URL |
| Step 2 |
On the Cisco Operations Hub, click the Cisco Operations Hub main menu button. |
| Step 3 |
Choose Dashboard to open the Dashboard page. |
| Step 4 |
Click Find a Dashboard to open the search pane. |
| Step 5 |
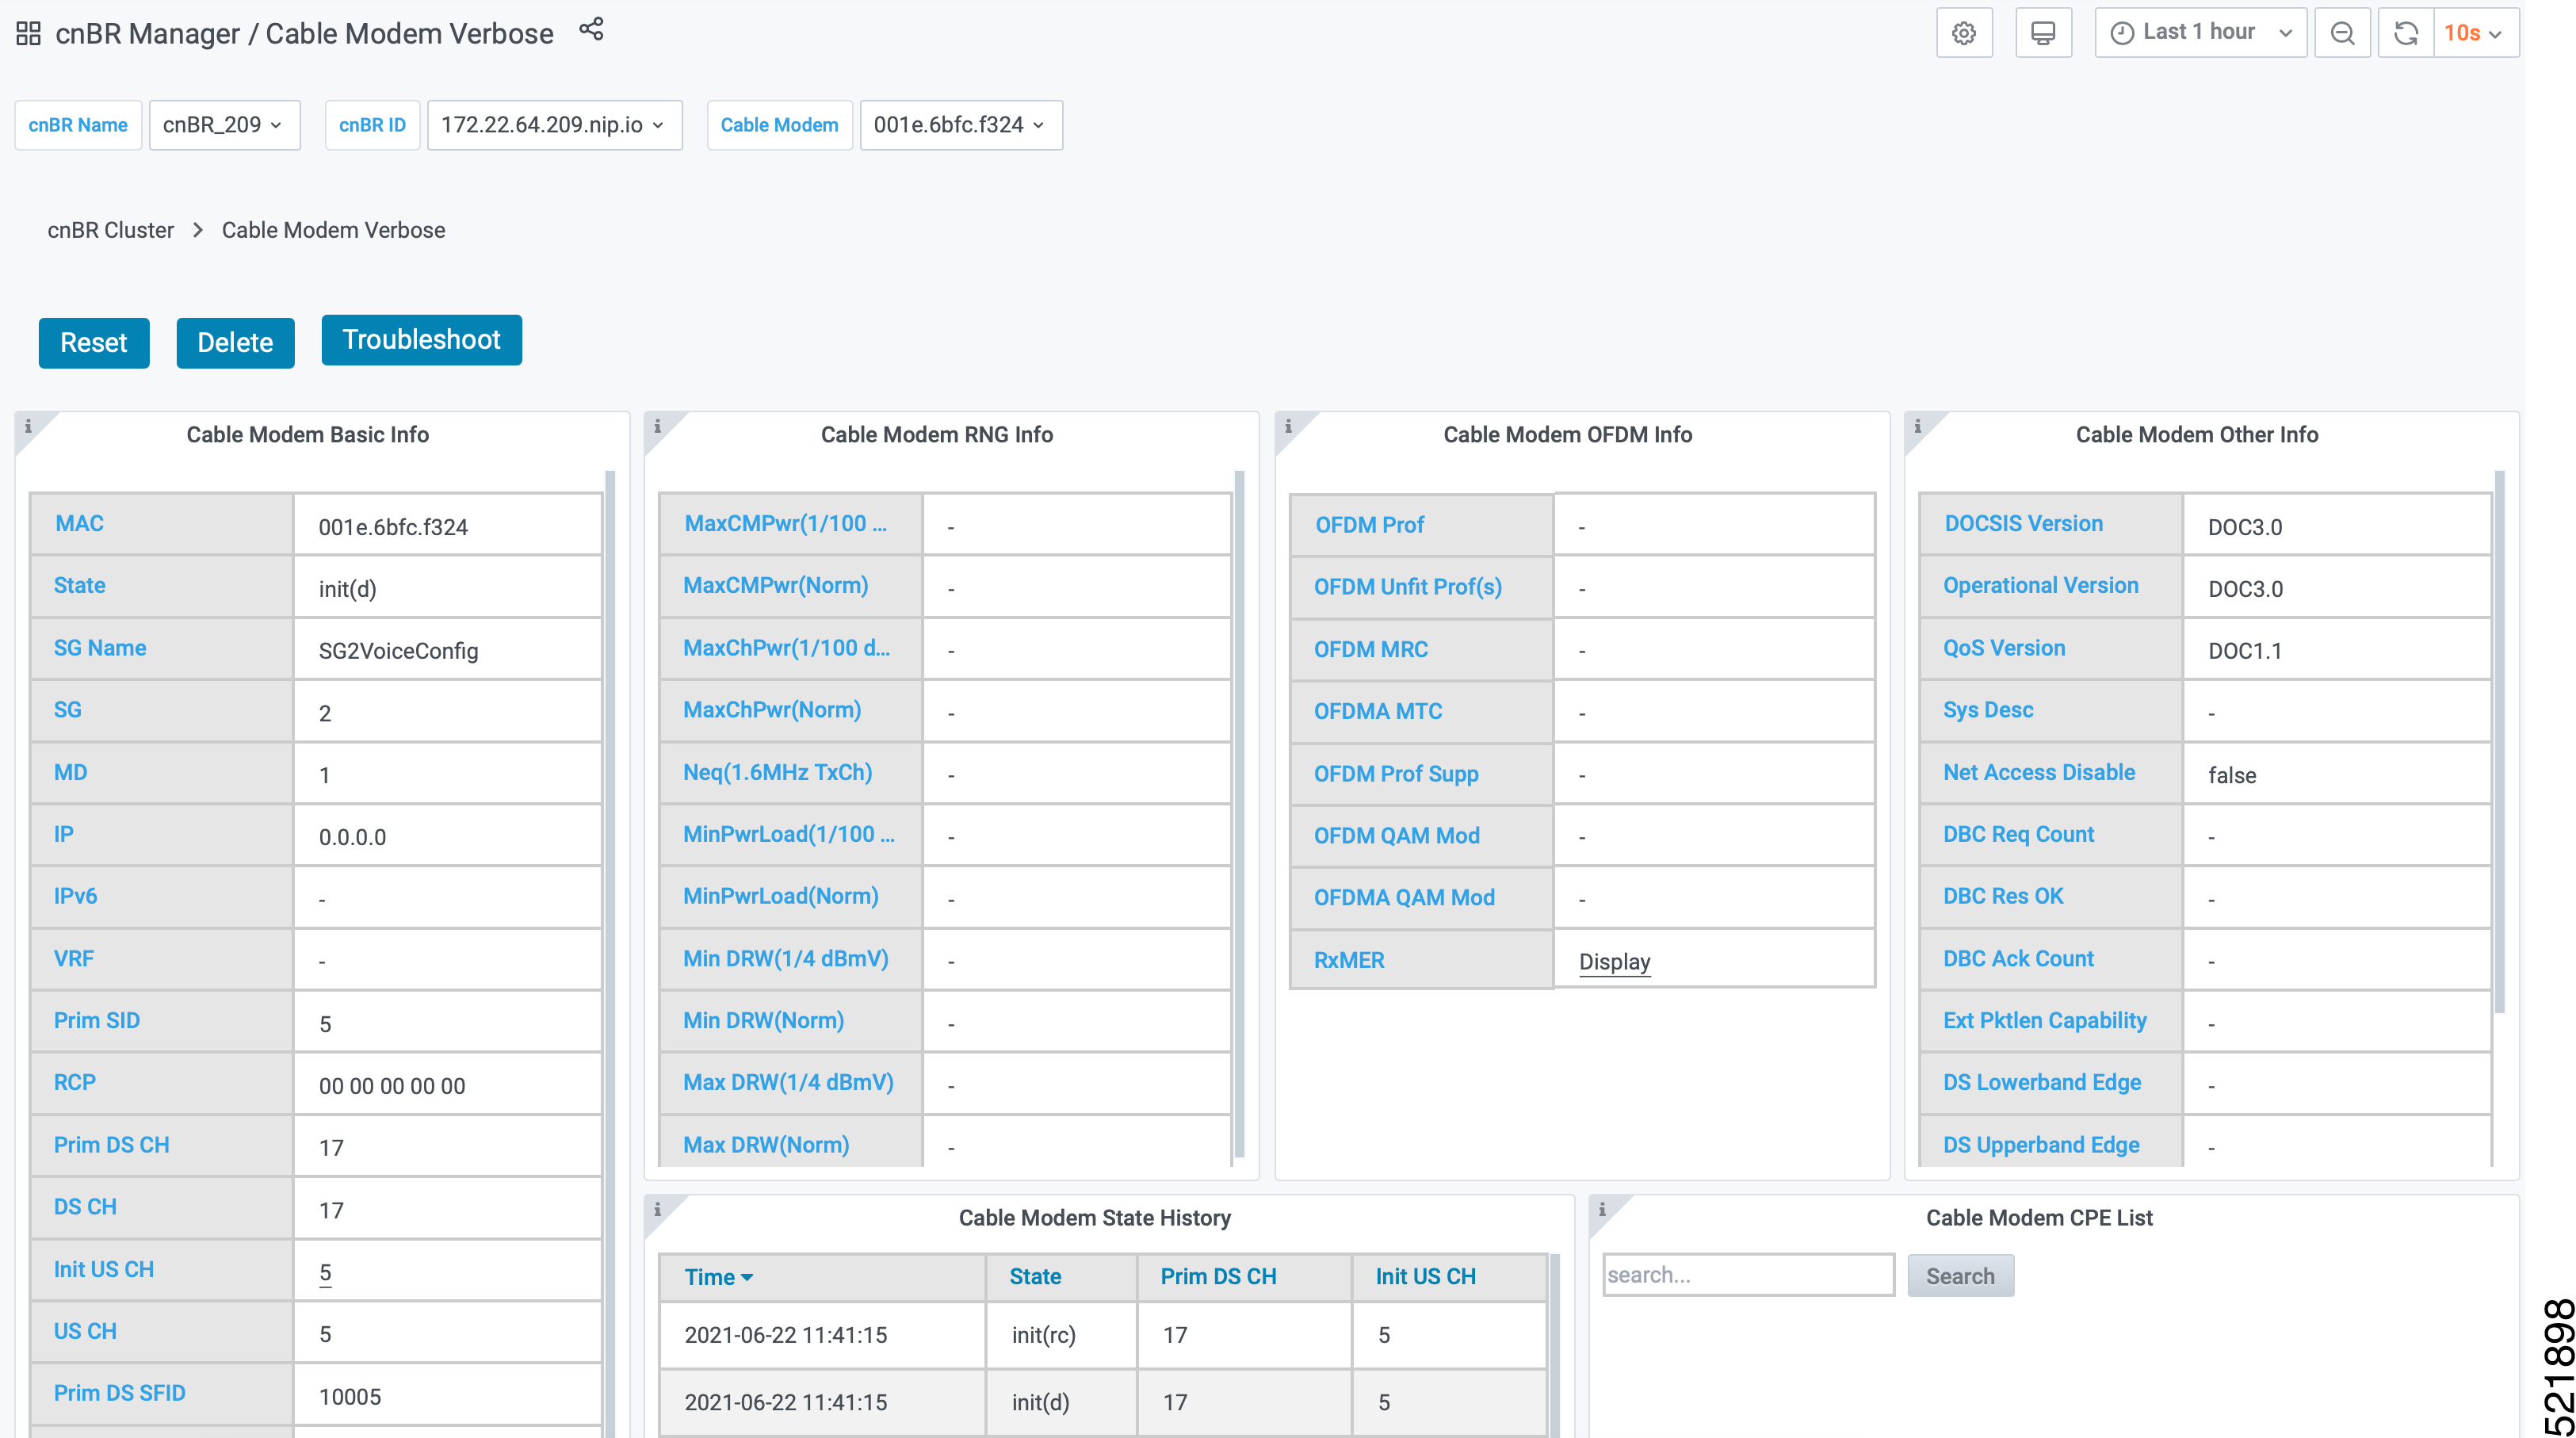
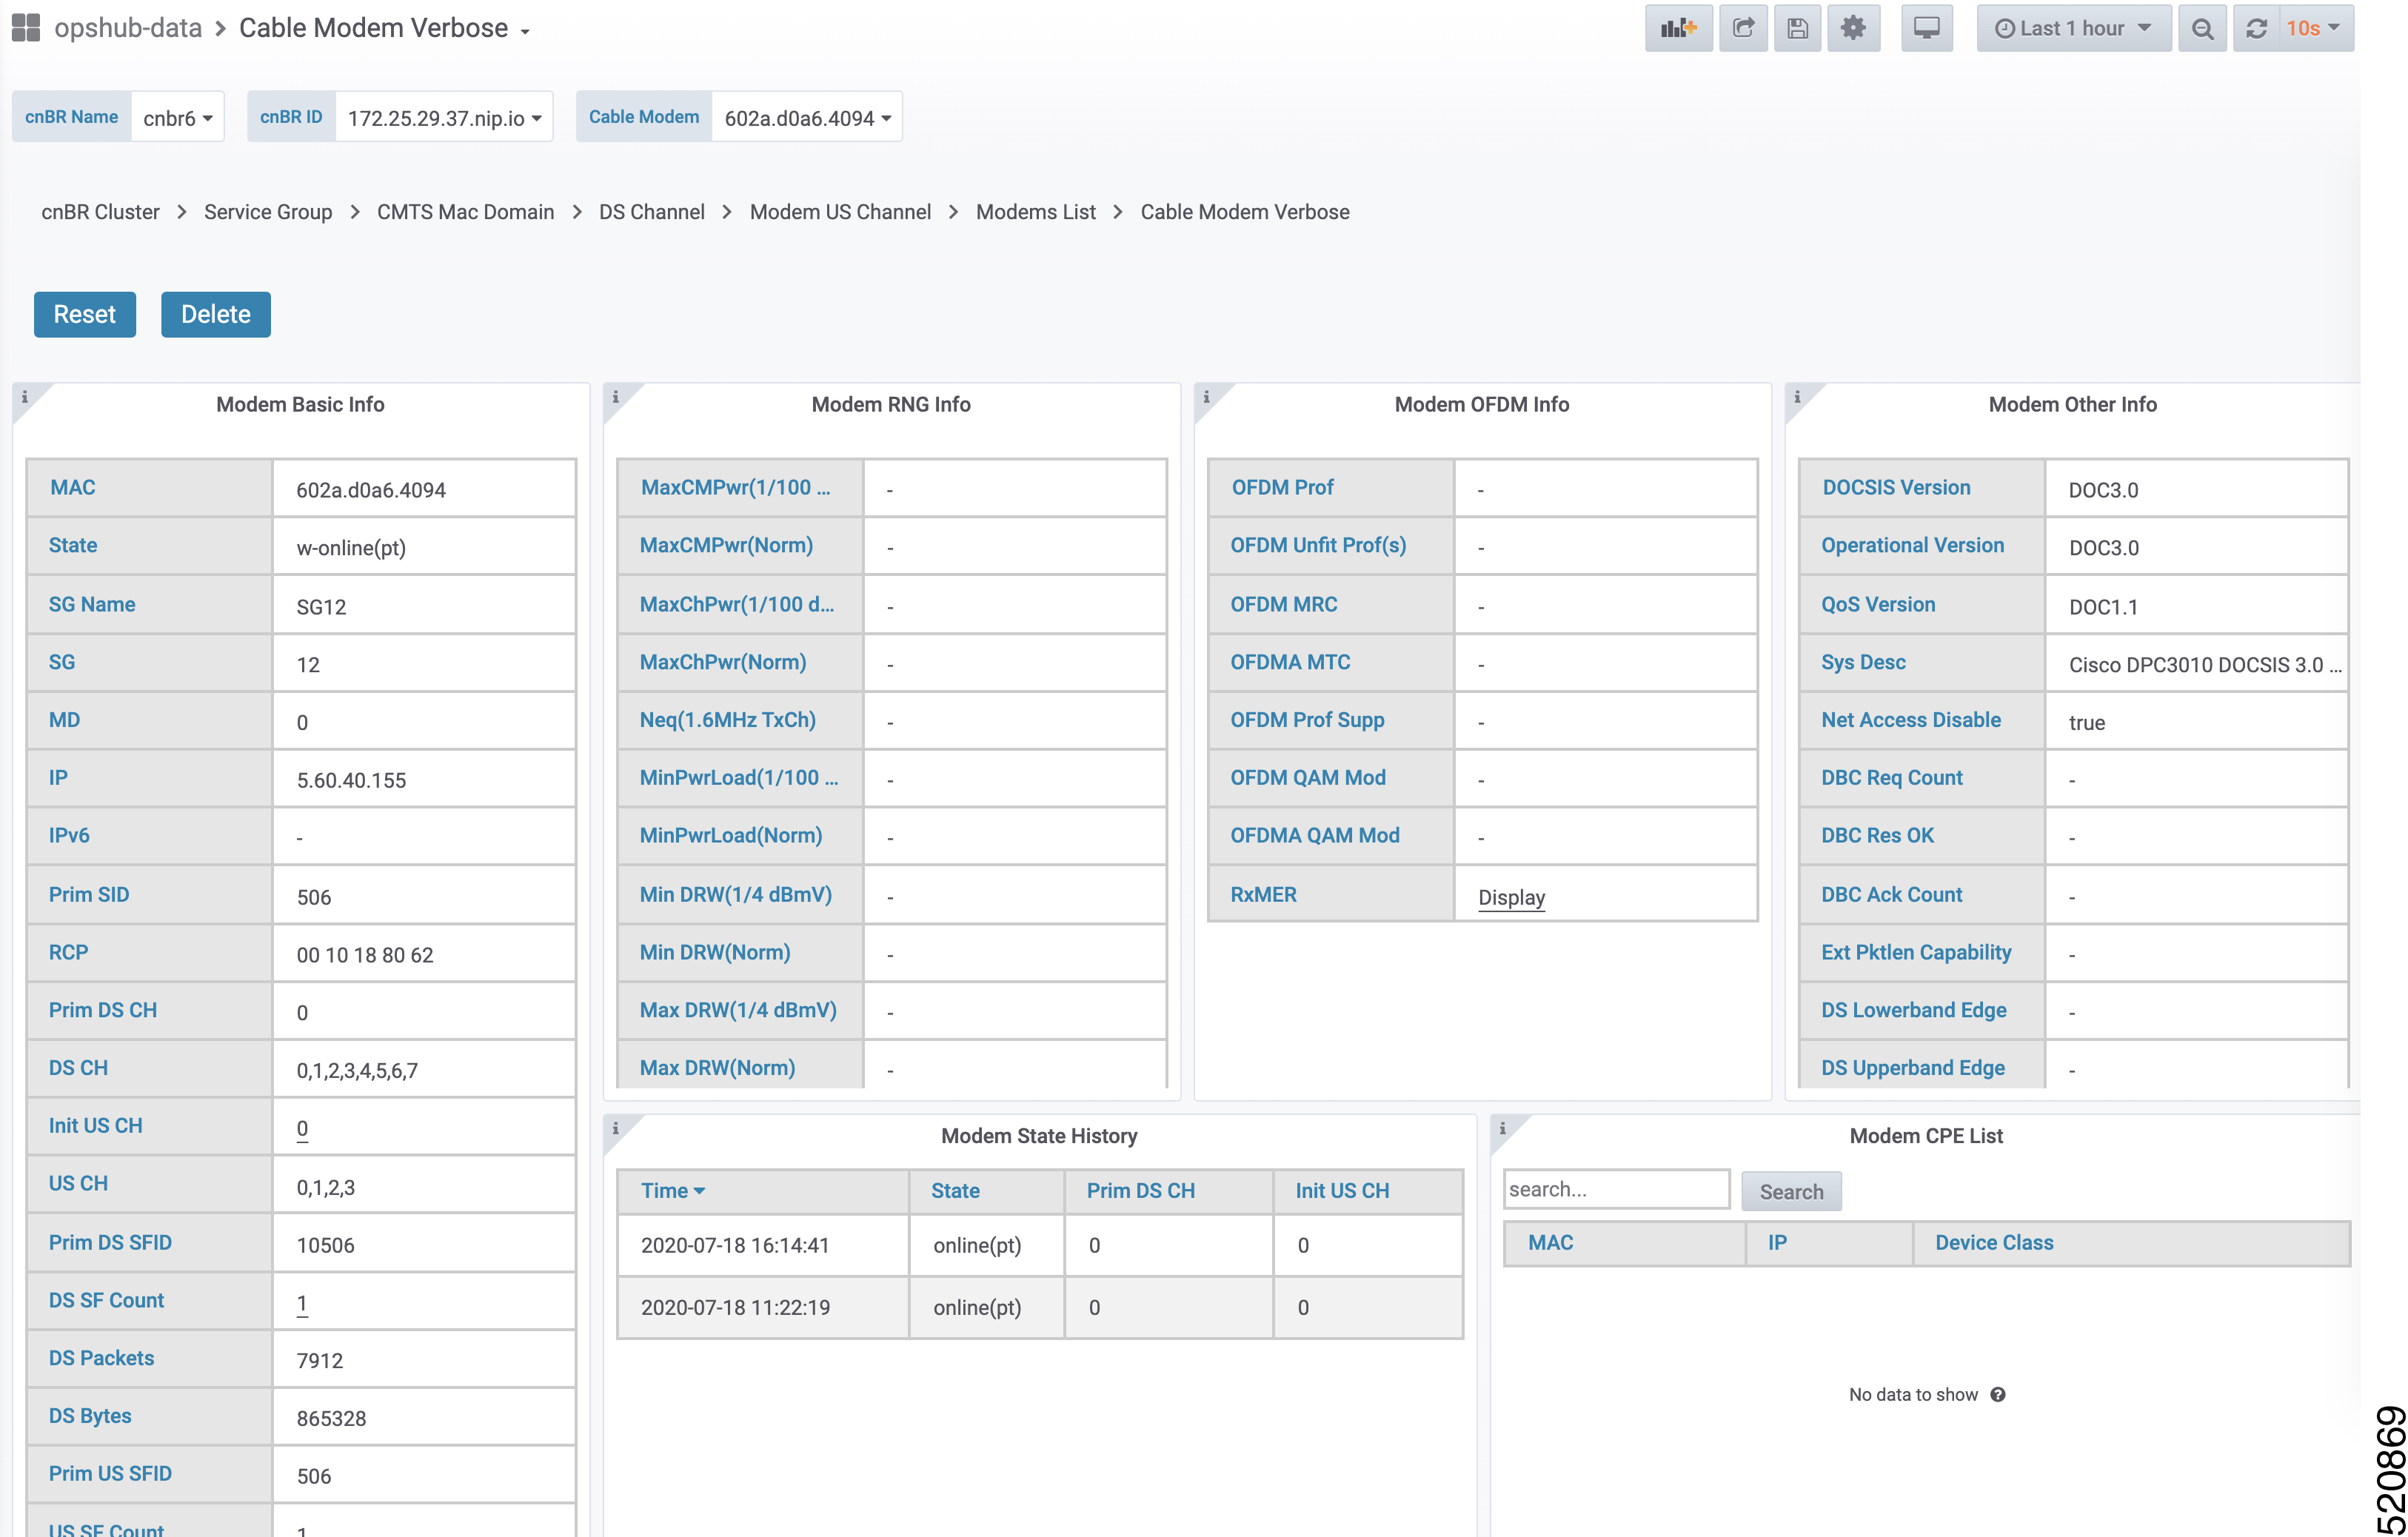
Enter Cable Modem Verbose in the Search dashboards by name field and click the Cable Modem Verbose row to open the Cable Modem Verbose dashboard. |
| Step 6 |
Select the Cisco cnBR name and modem that you want to debug from the cnBR Name and Cable Modem drop-down lists. |
| Step 7 |
Click Cable Modem Log From cnBR pane. |
| Step 8 |
Click Debug. |
| Step 9 |
Click Disable to disable debugging. |
Configure Cable Modem Diagnosis Tool for Background Diagnosis
The Background diagnosis utility runs periodically, and detects malfunctioning modems. The utility runs automatically in the background, and is enabled by default.
Using the Background diagnosis method, debug functions that collect modem logs are enabled. Complete the following steps to view the logs:
Procedure
| Step 1 |
Enter the Cisco Operations Hub URL |
| Step 2 |
On the Cisco Operations Hub, click the Cisco Operations Hub main menu button. |
| Step 3 |
Choose Dashboard to open the Dashboard page. |
| Step 4 |
Click Find a Dashboard to open the search pane. |
| Step 5 |
Enter diagnosis in the Search dashboards by name field and click the Diagnosis row to open the Diagnosis dashboard. The debugging information is available in the Diagnosis Job Summary, cnBR Debug CMD Control, and Cable Modem Online Anomaly Detection Job tables. |
| Step 6 |
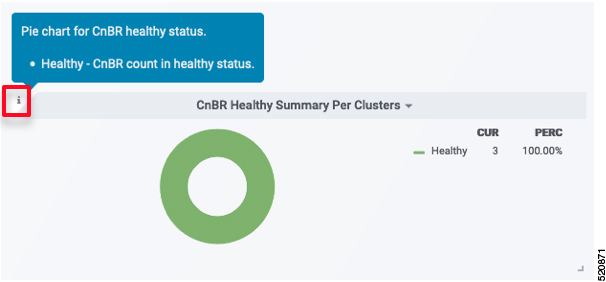
To view detailed information about these tables, expand the tables and click the i icon at the top-left corner. |








 Feedback