Monitoring Dashboard
The controller GUI has a monitoring dashboard that gives a single-window overview of the network devices that are connected to the controller.
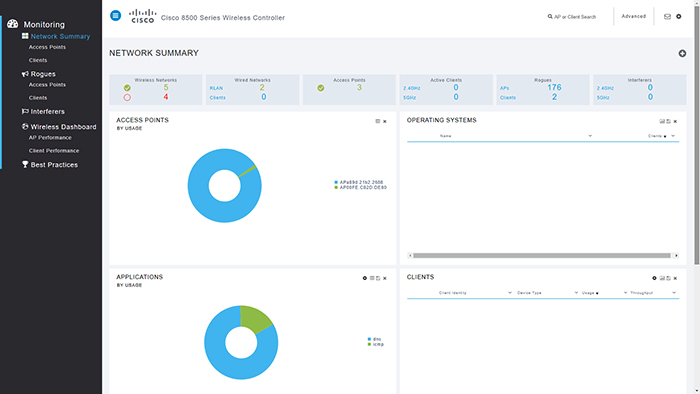
The monitoring dashboard is displayed by default when you log in to the controller GUI. The dashboard is split into three sections:
-
Numerical statistics
-
Graphical widgets
-
Monitor pane with selection options
At an interval of 60 seconds, the dashboard widgets and the statistical data are automatically refreshed.
 Note |
After you enable debugging on the controller using SSH protocol, you may experience sluggish GUI response. We recommend that you use one of the following two ciphers for SSH connection to minimize the sluggish response:
You can SSH to the controller by entering this command: ssh -c{ aes128-gcm@openssh.com | aes256-gcm@openssh.com} controller username controller ip-addr |
This section contains the following subsections:
Numerical Statistics
This is the top section of the dashboard where you get a quick view of what is on the network:
-
Wireless Networks: Shows the number of WLANs enabled and disabled on this WLC.
-
Wired Networks: Shows the number of RLANs and clients that are associated to the network.
-
Access Points: Shows the number of active Cisco APs in the network.
-
Active Clients: Shows the number of 2.4 and 5–GHz clients in the network.
-
Rogues: Shows the number of APs and clients which are found in your network.
-
Interferers: Shows the number of detected interference devices on 2.4 and 5–GHz bands.
Note |
Selecting the headline or the statistical value takes you to the respective page in the Advanced section. |
Graphical Widgets
These graphical widgets present the numbers in the form of graphs. You can select the widgets to display from the available list.
Access Points
You can see the doughnut graph representing the AP usage in percentage on this
controller. To change to the list view, click  on the top right of the widget. The list view displays the APs with the number of
connected clients, amount of data traffic served, and the throughput values. By
default, the AP list is sorted by name; however, you can also sort the list by
clients, usage, or throughput.
on the top right of the widget. The list view displays the APs with the number of
connected clients, amount of data traffic served, and the throughput values. By
default, the AP list is sorted by name; however, you can also sort the list by
clients, usage, or throughput.
Note |
The AP list is limited to display only top 10 APs. Therefore, you might not see all the APs associated with the controller in this widget. |
Clicking on the AP takes you to the Access Point View page. The Access Point View page gives the Cisco AP’s general, performance, and radio parameter details for both 2.4 GHz and 5-GHz radios. You can restart the AP from this page.
The AP performance values displayed are gathered from the AP. The Usage Traffic parameter shows the total amount of data transferred during the uptime duration of the AP. The Throughput value is the cumulative value of number of bytes (during the past 90 seconds) divided by the number of seconds (90 seconds).
To export the values, click  and save the excel sheet to your system.
Click  to remove this widget from the dashboard.
Operating Systems
You can see the operating system running in the connected clients. This list is sorted according to the number of clients of each OS type.
Applications
You can see the doughnut graph presenting the application with its usage and
throughput. This widget gives you the ability to clear the current records to start
afresh, click  on the top right of this widget to clear the records.
To change to list view, click  . This view shows details of each application like usage and the throughput
values.
. This view shows details of each application like usage and the throughput
values.
To export the values, click and save the excel sheet to your system.
Click to remove this widget from the dashboard.
Clients
You can see the doughnut graph presenting the network usage by each client in
percentage. This widget gives you the ability to clear the current records to start
afresh, click the on top right of this widget to clear the records.
To change to list view, click . This view shows each client’s details like the type of device, data usage, and
the throughput values. You can sort the client list by identity, device type, usage,
throughput also.
Click the client to open the Client View page. The Client View page displays the general, the connectivity, the QoS, and the security and policy details.
To export the values, click and save the excel sheet to your system.
Click to remove this widget from the dashboard.
Top WLANs
The doughnut graph shows the top SSIDs based on the number of clients and usage. The list view displays the SSIDs with the statistics in numbers.
 icon. This icon is found at the top right corner of the Best Practices page. This icon displays the
  Feedback