Plan of Action and Milestones


Note


To achieve simplification and consistency, the Cisco SD-WAN solution has been rebranded as Cisco Catalyst SD-WAN. In addition, from Cisco IOS XE SD-WAN Release 17.12.1a and Cisco Catalyst SD-WAN Release 20.12.1, the following component changes are applicable: Cisco vManage to Cisco Catalyst SD-WAN Manager, Cisco vAnalytics to Cisco Catalyst SD-WAN Analytics, Cisco vBond to Cisco Catalyst SD-WAN Validator, Cisco vSmart to Cisco Catalyst SD-WAN Controller, and Cisco Controllers to Cisco Catalyst SD-WAN Control Components. See the latest Release Notes for a comprehensive list of all the component brand name changes. While we transition to the new names, some inconsistencies might be present in the documentation set because of a phased approach to the user interface updates of the software product.

Overview of Plan of Actions and Milestones

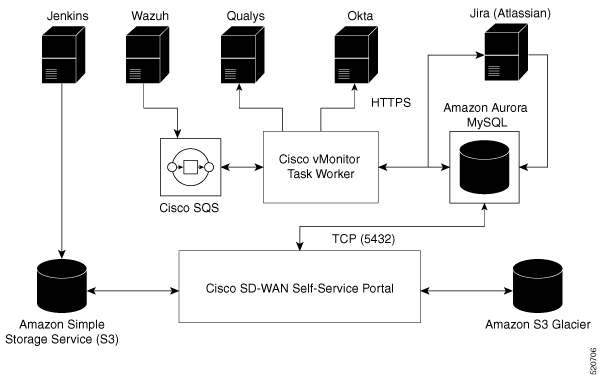
Cisco vMonitor constantly scans Cisco Catalyst SD-WAN for government for potential issues. Cisco vMonitor processes the collected data and creates a Plan of Actions & Milestones (POA&M) alert for potential vulnerabilities. Each POA&M alert generates a JIRA ticket.

Cisco FedOps users can view and download the POA&M report in the Cisco Catalyst SD-WAN Portal. This is enabled by checking if the user is logged in through a federal IdP. Cisco FedOps regardless of their role can access the POA&M reports. These reports can be used to monitor your Cisco Catalyst SD-WAN for government environment, and to identify potential risks and issues.

Cisco Catalyst SD-WAN for government uses a decentralized model to collect data from the following sources:

  • Okta: Okta log events

  • Wazuh: Standard Wazuh scans

  • Tenable: Vulnerability and compliance alerts

Cisco vMonitor Process for Creating Plan of Actions and Milestones Alerts

The figure below shows how Cisco vMonitor processes the collected vulnerability data to create a POA&M alert:

Figure 1. Cisco vMonitor Process for Creating a POA&M Alert

Workflow for Generating Plan of Actions and Milestones Alerts

Cisco vMonitor uses task workers to create a POA&M vulnerability alert by performing the workflow illustrated in the following figure:

Figure 2. Workflow for Generating a POA&M Alert

Cisco vMonitor performs the following actions:

  1. Collects logs from various data sources:

    • Okta: Using the RESTful API, Cisco vMonitor filters for warning and error logs whose severity is either ERROR or WARN. Periodically, Cisco vMonitor also pulls these logs from the Okta server. In one call, Cisco vMonitor pulls a maximum of 500 events. If there are more than 500 events, the events are pulled in batches.

    • Tenable Security Center: Cisco vMonitor periodically pulls alert data.

    • Wazuh: This server sends the alert data to an Amazon Simple Queue Service (SQS). Cisco vMonitor periodically pulls data from the SQS.

  2. Correlates the logs, with data, from Cisco vOrchestrator to create POA&M alerts:

    • Tenable: Cisco vMonitor finds the application name and application version from the application table on Cisco vOrchestrator using the instance ID as a key.

    • Wazuh: Cisco vMonitor finds the application name and application version from the application table on Cisco vOrchestrator using the Wazuh agent ID as the key.

    • Okta: Cisco vMonitor finds the application name and application version from the application table on Cisco vOrchestrator using the Okta application target ID as the key.

  3. Creates or updates the following trackers:

    • JIRA ticket: Used by Cisco FedOps to track and address issues.

    • POA&M alert: An alert is generated using all the computed metadata, which is then saved to a POAM table in an Amazon Aurora database. (The Cisco Catalyst SD-WAN Portal uses this database to generate the POA&M alerts.)

Data Purging

Data from the last 180 days is stored on the Amazon Aurora database for quick retrieval. (The Cisco Catalyst SD-WAN Portal displays alerts for the last 30 days.)

Alerts older than 180 days are archived using Amazon S3 Glacier. A nightly job runs, and subsequently, moves the data to Amazon S3 Glacier for long-term storage. You can access data older than 180 days through a date range on the Cisco Catalyst SD-WAN Portal.

Figure 3. Workflow for Data Purging

View Plan of Action and Milestones

To view the POA&M report, do the following:

  1. From the Cisco Catalyst SD-WAN Portal dashboard, click Notifications.

  2. Click the POAM tab.

    The POAM tab, provides a vulnerability feed of your overlay networks. Using sources such as Tenable, Wazuh, and so on, the POAM window lists a variety of issues. You can search, categorize, and download the reports. You can feed the downloaded reports to a security information and event management (SIEM) software such as Splunk.

  3. Perform the following tasks in the POAM tab:

    • Use the search bar to filter and search for issues. You can filter by various parameters, such as POAM status, risk rating, custom date ranges for detection of issues, and so on.

    • To view information about a specific issue, click Details.

      A dialog box, which lists additional information about the alert, including a description of the issue, appears.

    • To filter by a specific column, click the text box under the column. For example, you can click under the Adjusted Risk column, and enter high to list all the high-risk issues.