Cisco WAE Live 6.3 User Guide
Bias-Free Language
The documentation set for this product strives to use bias-free language. For the purposes of this documentation set, bias-free is defined as language that does not imply discrimination based on age, disability, gender, racial identity, ethnic identity, sexual orientation, socioeconomic status, and intersectionality. Exceptions may be present in the documentation due to language that is hardcoded in the user interfaces of the product software, language used based on RFP documentation, or language that is used by a referenced third-party product. Learn more about how Cisco is using Inclusive Language.
- Updated:
- December 2, 2015
Chapter: Report Log
Report Log
Access: WAE Live > Analytics, click Show Report Log
The Analytics Report Log page lists all previously run reports and information that further defines them, such as their start and end time. From this page you can view report results, rerun the report, or edit the report configuration before rerunning.
The reports appear by default names unless you renamed them. To view reports for a specific network, select it from the Network list (top left). If there is only one network configured, the word “default” appears.
Like other Explore pages, you can filter and sort the Report Log table, as described in the Tables and Filters chapter.
Report Log Table
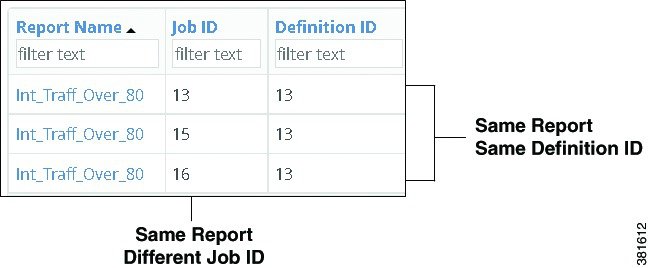
- Report Name—Name of the report. Click it to open the Configure Report page with the parameters selected that were used to create the report.
- Job ID—Specific instance of a report. A unique Job ID is generated each time a report is run. The Job ID is required information for importing traffic reports into the WAE Design GUI.
- Definition ID—Uniquely identifies the report. If the same report is run multiple times with the same parameters, its Definition ID stays the same.
–![]() View—Click to view the report output.
View—Click to view the report output.
–![]() View > Edit—Open the Configure Report page with the parameters selected that were used to create the report.
View > Edit—Open the Configure Report page with the parameters selected that were used to create the report.
–![]() View > Download CSV—Export the table in a tab-delimited format.
View > Download CSV—Export the table in a tab-delimited format.
Related Topics
- Tables and Filters chapter
- Creating new reports
–![]() Configuring Reports chapter
Configuring Reports chapter
–![]() Traffic Reports chapter
Traffic Reports chapter
–![]() Health Reports chapter
Health Reports chapter
–![]() Deviation Reports chapter
Deviation Reports chapter
–![]() Ad Hoc Reports chapter
Ad Hoc Reports chapter
- Reports chapter
 Feedback