Cisco WAE Live 6.3 User Guide
Bias-Free Language
The documentation set for this product strives to use bias-free language. For the purposes of this documentation set, bias-free is defined as language that does not imply discrimination based on age, disability, gender, racial identity, ethnic identity, sexual orientation, socioeconomic status, and intersectionality. Exceptions may be present in the documentation due to language that is hardcoded in the user interfaces of the product software, language used based on RFP documentation, or language that is used by a referenced third-party product. Learn more about how Cisco is using Inclusive Language.
- Updated:
- December 2, 2015
Chapter: Explore
Explore
The Explore component enables you to interactively navigate current network data and retrieve historical object performance data. For example, you can use Explore to do the following.
- Identify which LSPs are currently off their shortest TE paths.
- Determine which LSPs currently are going through a specific interface, or which IP address carries a specific interface and the historical changes on that interface.
- Determine whether IP address or metric changes have occurred on an interface during the last week.
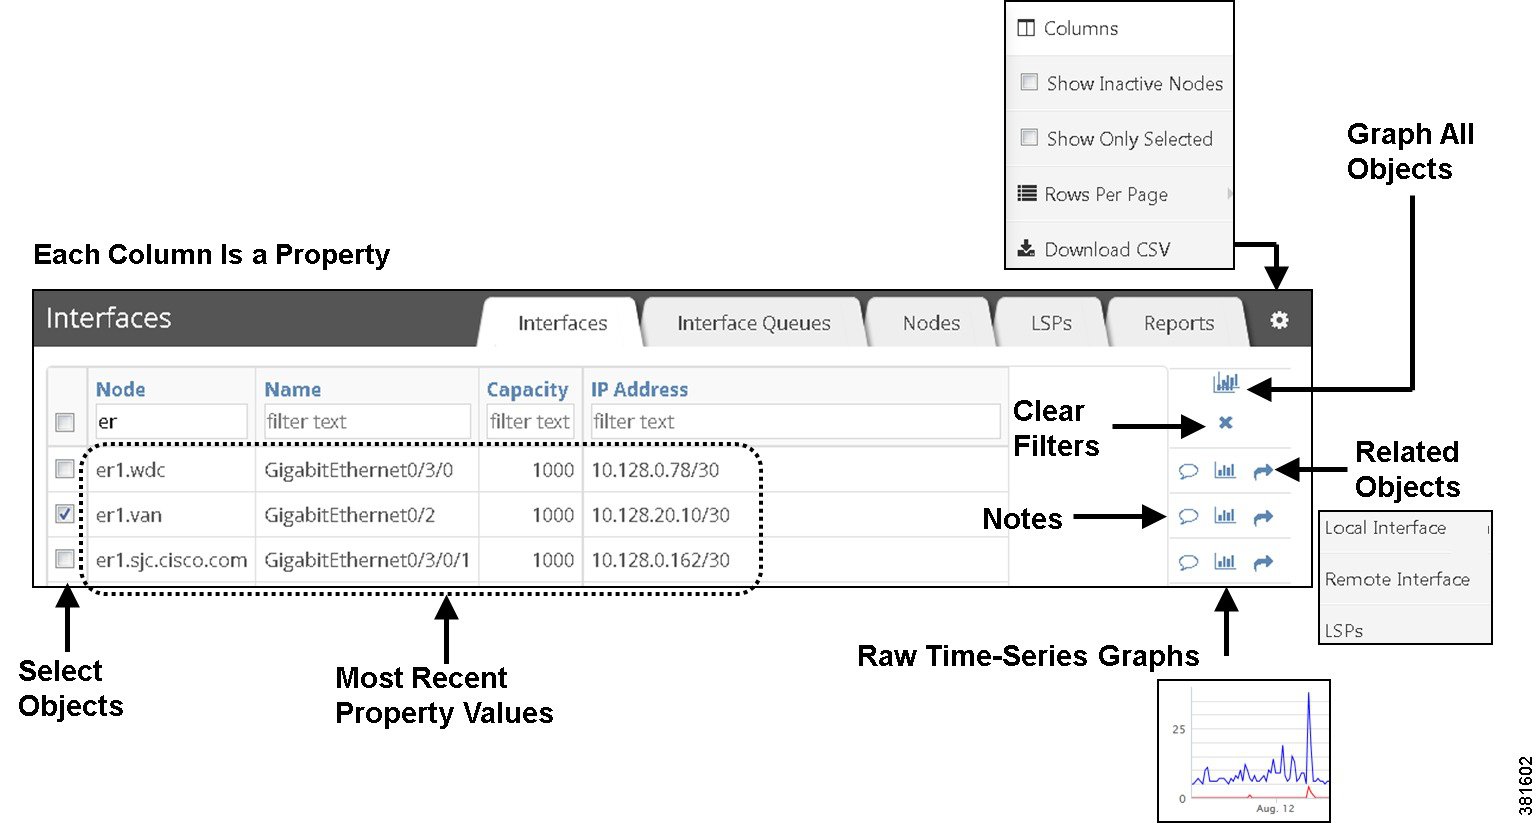
The Explore page (Figure 5-1) enables you to view and filter objects based on their current property values, as well as graph property values (raw data) over time and navigate to related objects.
Additionally, the Explore page enables you to view summaries of the named reports over a period of time. Interactions with this report summary is the same as with the objects. See the Reports section.

Note![]() For instructions on how to use graphs and tables, see the Graphs and Tables and Filters chapter, respectively.
For instructions on how to use graphs and tables, see the Graphs and Tables and Filters chapter, respectively.
To view Explore information for a specific network, select it from the Network list (top left). If there is only one network configured, the word “default” appears.
Figure 5-1 Example Explore Interfaces Table
Example: Explore LSPs
This example shows how to find the three LSPs with the highest setup bandwidth that are currently going through interface ae0.0 on node FRA-BB2 and that exceed 2 Gbps of traffic. It then shows how to find the source node of the LSP with the highest setup bandwidth with these parameters.
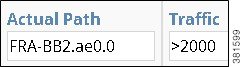
Step 1![]() On the Explore LSPs page, enter “FRA-BB2.ae0.0” as the filter in the Actual Path column.
On the Explore LSPs page, enter “FRA-BB2.ae0.0” as the filter in the Actual Path column.
Step 2![]() In the Traffic column, enter “>2000” as the filter, and then press Enter (Return).
In the Traffic column, enter “>2000” as the filter, and then press Enter (Return).
Step 3![]() Click the Setup BW column heading to toggle the list in descending order.
Click the Setup BW column heading to toggle the list in descending order.
Step 4![]() Click the Related Information icon (arrow) of the LSP with the highest setup bandwidth.
Click the Related Information icon (arrow) of the LSP with the highest setup bandwidth.
Step 5![]() Select Source Node. The resulting table is the source node of the LSP with the highest setup bandwidth that is currently going through interface ae0.0 on node FRA-BB2 and that exceeds 2 Gbps of traffic.
Select Source Node. The resulting table is the source node of the LSP with the highest setup bandwidth that is currently going through interface ae0.0 on node FRA-BB2 and that exceeds 2 Gbps of traffic.
Reports
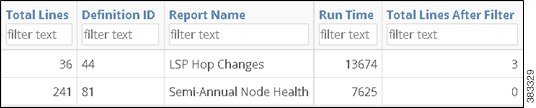
The Reports Explore page provides a report summary on the total number of lines in a report and the number of lines when run against a user-specified filter. Only named reports and only the most recently run reports are recorded.
This high-level report trend can be an indicator of the network’s health. For instance, if you run a node health report every week and filtered the percentage of time CPUs were over a given threshold, this table could show the number of nodes surpassing this threshold improving or worsening over time. If the number of nodes passing the threshold was increasing, it could be an indicator that the network is running hotter and you need to buy more nodes.
Example: This example report table indicates that in the last LSP Hop Changes report, only 3 out of 36 possible report entries were generated. For the Semi-Annual Node Health report, there were no lines in the report of possible 241 rows once filtering was applied.
Explore Table Options
Show More Data
Cell information that is blue or cell data that has a small arrow by it can be expanded to show more data. Following are examples.
- Count column—Click a blue number to see a list of objects included in that count value.
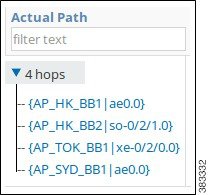
- LSP Actual Path column—Click the right arrow of an actual path in an LSPs table to see an expanded list of its individual LSP hops. Click any hop to show it in the Nodes table.
- Demand Path column—Click the right arrow of a path in a Demands table to see an expanded list of individual hops. Click any hop to show it in the Interfaces table.
Selections
- Per-row check boxes—Select the check box next to the desired object. This is a toggle that selects or deselects a single object.
When running reports, these selections are the default filters. For information on report filters, see the Configuring Reports chapter.
- Top check box—This is a toggle that selects or deselects all objects of the type you are viewing. For example, you can select all demands or all nodes.
If you have previously filtered to a subset of objects, this top check box applies only to them.
Graphs
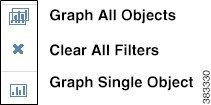
- Graph all icon—Graph the data for all objects in the table.
- Graph icon—Graph raw data of an object. From here, you can also list the raw data, which you can then save or send to others.
For more information, see the Graphs chapter.
Add Notes
You can add notes to the object rows in the Explore tables. All other users can read the notes and add further information to them. This enables multiple WAE Live users to share information that others might need to know, such as notes on interfaces that are reaching capacity or notes on when nodes are temporarily down for maintenance.
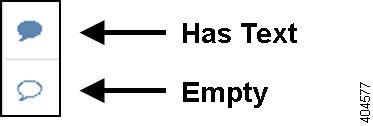
Notes that have information show as a solid blue to signal there is something to read.
To add a note, read a note, or add content to an existing note, click the Note icon.
Find Related Objects
To find objects that are related to an object of interest, click the related objects (arrow) icon associated with the object of interest, and then select the information you need from the list. The Explore page changes to list the related information.

Example: To find destination node information for a specific LSP, click this icon associated with that LSP and select Destination Node.
Gear Tool Options
The same set of gear tool options are available across all Explore pages with the exception of the Interface Type. To select any of the following Explore table options, click the gear tool.

- Columns—Click to select which properties appear as column headings. All available properties are listed. If a column (property) check box is gray, then you cannot turn it off. These non-optional properties always appear in the left-most columns of the table.
If you display the Type column, the property shows as number. Following is a description of each of these interface types and the number associated with them in the Type column.
–![]() (1) Individual physical interface—An interface that is not in a LAG and does not have an IP address. These interface names do not have a decimal.
(1) Individual physical interface—An interface that is not in a LAG and does not have an IP address. These interface names do not have a decimal.
–![]() (2) Individual logical interface—An interface with an IP address that is not in a LAG. These names might have a decimal.
(2) Individual logical interface—An interface with an IP address that is not in a LAG. These names might have a decimal.
–![]() (3) LAG logical interface—An interface with an IP address that contains member interfaces.
(3) LAG logical interface—An interface with an IP address that contains member interfaces.
Examples: ae0.0, Bundle-Ether1, Port-Channel7
–![]() (4) LAG physical interface—The physical representation of an aggregated interface to which a LAG logical interface (such as ae0.0) is assigned.
(4) LAG physical interface—The physical representation of an aggregated interface to which a LAG logical interface (such as ae0.0) is assigned.
Example: ae0 for Juniper interfaces
–![]() (5) LAG member interface—An interface that is in a LAG.
(5) LAG member interface—An interface that is in a LAG.
–![]() (6) Unknown—None of the above interface types
(6) Unknown—None of the above interface types
- Show Inactive <Object>—Show or hide all objects that have not been detected in the last four hours.
- Show Only Selected—Show only those objects that are selected in the far left column of the table.
- Rows per page—Select the number of objects per page to show in the table.
- Download CSV—Export the table in a tab-delimited format.
- Types—Specify the interface type so that you do not show duplicate traffic statistics. This option is applicable only on the Interfaces page.
Note![]() If you select specific interface types from the Explore Interfaces page for use in a report, then the report is only on those interfaces of those selected types. If you select Interfaces as the Object from a Configure Report page, then the report is run on all interfaces regardless of their type.
If you select specific interface types from the Explore Interfaces page for use in a report, then the report is only on those interfaces of those selected types. If you select Interfaces as the Object from a Configure Report page, then the report is run on all interfaces regardless of their type.
Run Report
Select the objects on which you want to run a report, and then click the Run Report button. The Configure Report page appears. For more information, see the Configuring Reports chapter.
Related Topics
- Objects, Properties, and Data chapter
- Graphs chapter
- Configuring Reports chapter
 Feedback