Deploying Nexus Dashboard Orchestrator

Deployment Overview

Cisco Nexus Dashboard Orchestrator (NDO) must be deployed as a service in Cisco Nexus Dashboard.

Cisco Nexus Dashboard is a central management console for multiple data center sites and a common platform for hosting Cisco data center services, such as the Nexus Dashboard Orchestrator or Nexus Insights. Nexus Dashboard provides a common platform and modern technology stack for these micro-services-based services, simplifying the life cycle management of the different modern services and reducing the operational overhead to run and maintain those services.

Each Nexus Dashboard cluster consists of 3 master nodes. You can also deploy additional worker nodes to enable horizontal scaling and a standby node for easy cluster recovery in case of a master node failure.

For detailed information about Nexus Dashboard cluster initial deployment and configuration, see Cisco Nexus Dashboard Deployment Guide.

For more information about using Nexus Dashboard, see the Cisco Nexus Dashboard User Guide.

This document describes initial installation requirements and procedures for the Nexus Dashboard Orchestrator service. Detailed configuration and use case information is available from the Cisco Nexus Dashboard Orchestrator Configuration Guide for Cisco ACI or Cisco Nexus Dashboard Orchestrator Configuration Guide for Cisco NDFC for your release and the Cisco Cloud Network Controller use case documents, depending on the type of fabrics you plan to manage.

Prerequisites and Guidelines

Nexus Dashboard

You must have Cisco Nexus Dashboard cluster deployed and its fabric connectivity configured, as described in Cisco Nexus Dashboard Deployment Guide before proceeding with any additional requirements and the Nexus Dashboard Orchestrator service installation described here.

Orchestrator Release Minimum Nexus Dashboard Release

Release 4.0(1) and later

Cisco Nexus Dashboard, Release 2.1(2d) or later

Nexus Dashboard Networks

When first configuring Nexus Dashboard, you will need to provide two IP addresses for the two Nexus Dashboard interfaces—one connected to the Data Network and the other to the Management Network. The data network is used for the nodes' clustering and Cisco fabrics traffic. The management network is used to connect to the Cisco Nexus Dashboard GUI, CLI, or API.


Note

The two interfaces must be in different subnets.


Connectivity between the nodes is required on both networks with the round trip time (RTT) not exceeding 150ms for Nexus Dashboard Orchestrator. Other services running in the same Nexus Dashboard cluster may have lower RTT requirements and you must always use the lowest RTT requirement when deploying multiple services in the same Nexus Dashboard cluster. We recommend consulting the Cisco Nexus Dashboard Deployment Guide for more information.

When Nexus Dashboard Orchestrator service is deployed in Nexus Dashboard, it uses each of the two networks for different purposes as shown in the following table:

NDO Traffic Type

Nexus Dashboard Network

Any traffic to and from:

  • Cisco APIC

  • Cisco NDFC

  • Any other remote devices or controllers

Data network

Intra-cluster communication

Data network

Audit log streaming (Splunk/syslog)

Management network

Remote backup

Management network

Nexus Dashboard Cluster Sizing and Services Cohosting

Nexus Dashboard supports co-hosting of services. Depending on the type and number of services you choose to run, you may be required to deploy additional worker nodes in your cluster. For cluster sizing information and recommended number of nodes based on specific use cases, see the Cisco Nexus Dashboard Capacity Planning tool.

If you plan to host other services in addition to the Nexus Dashboard Orchestrator, ensure that you deploy and configure additional Nexus Dashboard nodes based on the cluster sizing tool recommendation, as described in the Cisco Nexus Dashboard User Guide, which is also available directly from the Nexus Dashboard GUI.


Note

This release of Nexus Dashboard Orchestrator can be co-hosted with other services on physical or virtual (ESX) Nexus Dashboard clusters only. If you are deploying the Nexus Dashboard Orchestrator service in a virtual (KVM) or cloud Nexus Dashboard cluster, you must not install other services in the same cluster.


Network Time Protocol (NTP)

Nexus Dashboard Orchestrator uses NTP for clock synchronization, so you must have an NTP server configured in your environment.

Hardware Requirements For ACI Fabrics

Spine Switch Requirements

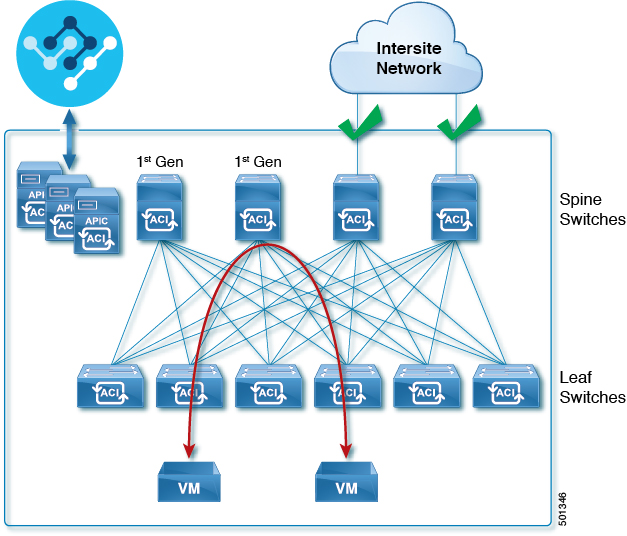
Multi-Site requires second generation (Cloud Scale) spine switches for intersite connectivity. All Cloud Scale spine switches supported by a given ACI release are supported by Nexus Dashboard Orchestrator.

Nexus 9000 first generation switches are not supported for Multi-Site intersite connectivity, but can still be used within a single fabric as long as that fabric is running an APIC release prior to 5.0(1).

Refer to the ACI-mode Switches Hardware Support Matrix for the complete list of supported spines for each release.

Leaf Switch Requirements

Multi-Site has no dependency on the fabrics' leaf switches and as such supports the same leaf switch models as the Cisco APIC. The full list of supported hardware is available in the ACI-mode Switches Hardware Support Matrix.

IPN Connectivity Across Sites

The following figure shows how spine switches supported with Multi-Site are connected to the intersite network.

You can choose to mix spine switches supported by Multi-Site with switches that are not supported within the same Cisco APIC fabric, but only the supported switches can connect to the intersite network as shown in the following figure.

Hardware Requirements For NDFC Fabrics

Border Gateways Requirements

The following table summarizes the hardware requirements for EVPN Multi-Site Architecture:

  • Cisco Nexus 9300 EX platform

  • Cisco Nexus 9300 FX platform

  • Cisco Nexus 9300 FX2 platform

  • Cisco Nexus 9300-GX platform

  • Cisco Nexus 9332C platform

  • Cisco Nexus 9364C platform

  • Cisco Nexus 9500 platform with X9700-EX line card

  • Cisco Nexus 9500 platform with X9700-FX line card

The hardware requirements for the site-internal BGP Route Reflector (RR) and VTEP of a VXLAN BGP EVPN site remain the same as those without the EVPN Multi-Site Border Gateways (BGW). This document does not cover the hardware and software requirements for the VXLAN EVPN site-internal network.

Installing Nexus Dashboard Orchestrator Service Using App Store

This section describes how to install Cisco Nexus Dashboard Orchestrator service in an existing Cisco Nexus Dashboard cluster.

Before you begin

  • Ensure that you meet the requirements and guidelines described in Prerequisites and Guidelines.

  • The Cisco DC App Center must be reachable from the Nexus Dashboard via the Management Network directly or using a proxy configuration. Nexus Dashboard proxy configuration is described in the Nexus Dashboard User Guide.

    If you are unable to establish the connection to the DC App Center, skip this section and follow the steps described in Installing Nexus Dashboard Orchestrator Service Manually.

  • The App Store allows you to install the latest version of the service only.

    If you want to install a version prior to Release 3.3(1), see the Nexus Dashboard Orchestrator Installation Guide specific to that release for the available deployment options and procedures.

Procedure


Step 1

Log in to the Nexus Dashboard GUI.

Step 2

From the left navigation menu, select Admin Console.

You must have admin privileges to deploy services.

Step 3

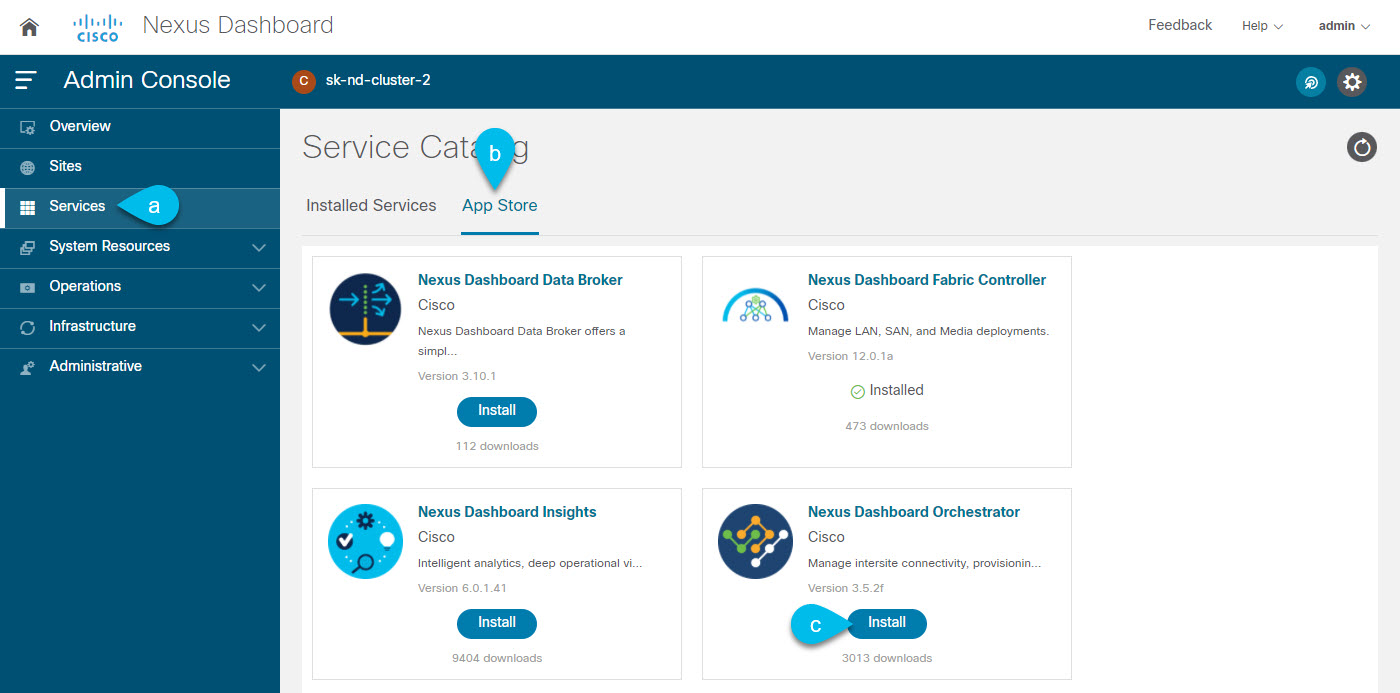
Navigate to the App Store and choose Nexus Dashboard Orchestrator app.

  1. From the left navigation menu, select Service Catalog.

  2. Select the App Store tab.

  3. In the Nexus Dashboard Orchestrator tile, click Install.

Step 4

In the License Agreement window that opens, click Agree and Download.

Step 5

Wait for the service to be downloaded to the Nexus Dashboard and deployed.

Step 6

Enable the app.

After installation is complete, the service will remain in the Disabled state by default and you must enable it.

To enable the app, click the ... menu on the app and select Enable.

Step 7

Launch the app.

To launch the app, simply click Open on the service tile in the Nexus Dashboard's Service Catalog page.

The single sign-on (SSO) feature allows you to log in to the service using the same credentials as you used for the Nexus Dashboard.


Installing Nexus Dashboard Orchestrator Service Manually

This section describes how to manually upload and install Cisco Nexus Dashboard Orchestrator service in an existing Cisco Nexus Dashboard cluster.

Before you begin

Procedure


Step 1

Download the Cisco Nexus Dashboard Orchestrator service.

  1. Browse to the Nexus Dashboard Orchestrator page on DC App Center:

    https://dcappcenter.cisco.com/nexus-dashboard-orchestrator.html
  2. From the Version dropdown, choose the version you want to install and click Download.

  3. Click Agree and download to accept the license agreement and download the image.

Step 2

Log in to your Cisco Nexus Dashboard dashboard.

When deploying a service, you need to install it in only one of the Nexus Dashboard nodes, the service will be replicated to the other nodes in the cluster automatically. So you can log in to any one of your Nexus Dashboard nodes using its management IP address.

Step 3

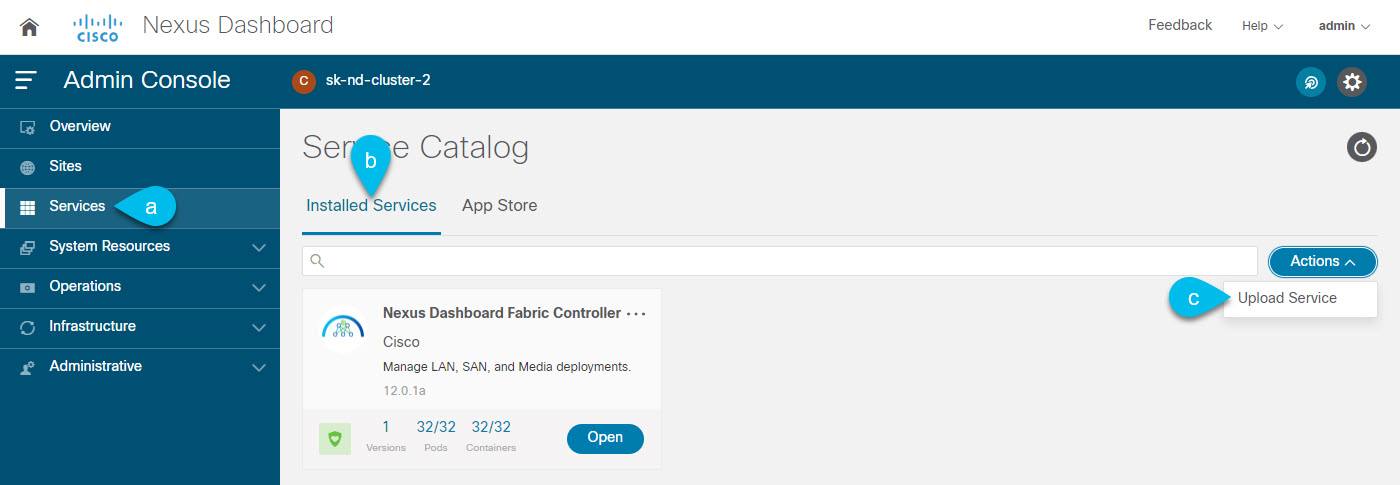
Choose to manually upload the image.

  1. In the left navigation bar, click Service Catalog.

  2. Select the Installed Services tab.

  3. In the top right of the main pane, select Actions > Upload Service.

Step 4

Select the image file to upload.

  1. Choose the location of the image.

    If you downloaded the service image to your system, choose Local.

    If you are hosting the image on a server, choose Remote.

  2. Choose the file.

    If you chose Local in the previous substep, click Select File and select the image you downloaded.

    If you chose Remote, provide the full URL to the image file, for example http://<ip-address>:<port>/<full-path>/cisco-mso-<version>.nap.

  3. Click Upload to add the service to the cluster.

Step 5

Wait for the service to be downloaded to the Nexus Dashboard and deployed.

Step 6

Enable the service.

After installation is complete, the service will remain in the Disabled state by default and you must enable it.

To enable the service, click the ... menu and select Enable.

Step 7

Launch the service.

To launch the service, simply click Open on the service tile in the Nexus Dashboard's Service Catalog page.

The single sign-on (SSO) feature allows you to log in to the service using the same credentials as you used for the Nexus Dashboard.