Tech Support and System Logs
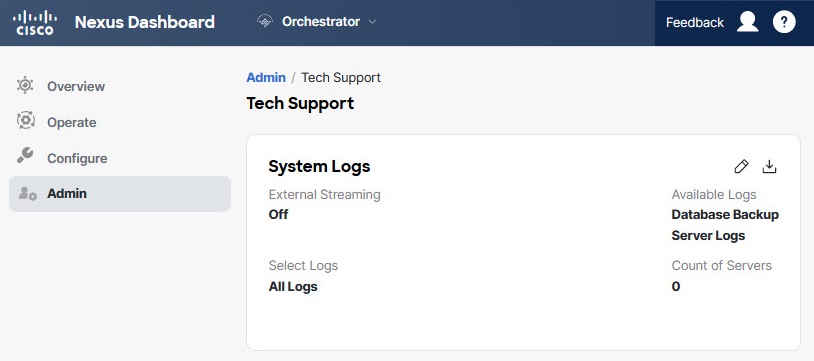
Cisco Nexus Dashboard Orchestrator system logging is automatically enabled when you first deploy the Orchestrator cluster and captures the events and faults that occur in the environment.
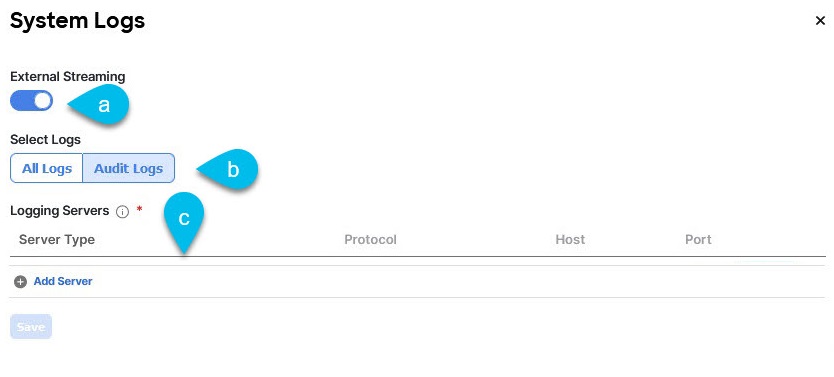
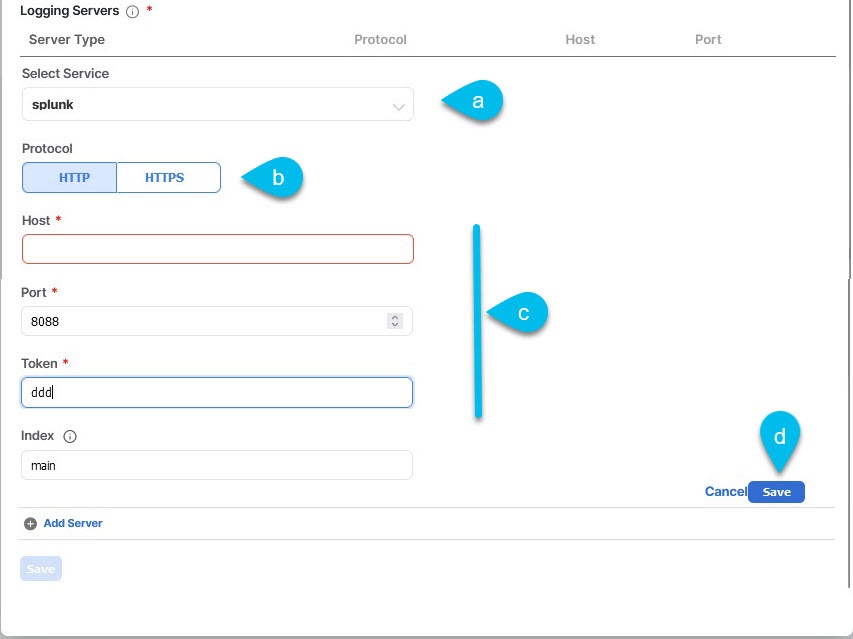
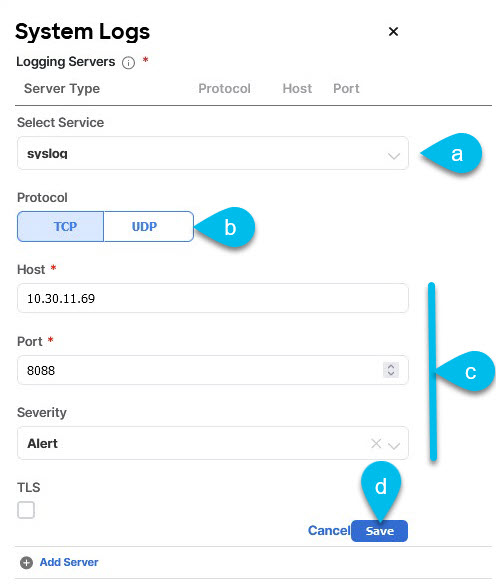
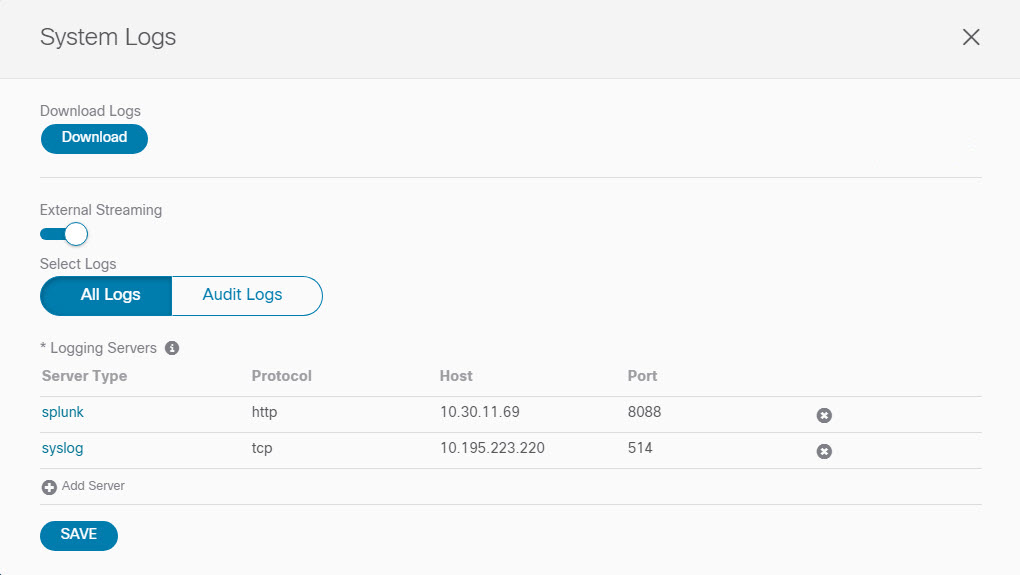
You can choose to download the logs at any time or stream them to an external log Analyzer, such as Splunk, if you want to use more tools to quickly parse, view, and respond to important events without a delay.
The tech support logs are split into two parts:
-
Original database backup files containing the same information as in prior releases
-
JSON-based database backup for ease of readability
Within each backup archive, you find the following contents:
-
x.x.x.x—One or more files in x.x.x.x format for container logs available at the time of the backup. -
msc-backup-<date>_temp—Original database backup containing the same information as previous releases. -
msc-db-json-<date>_temp—Back up contents in JSON format.For example:
msc_anpEpgRels.json
msc_anpExtEpgRels.json
msc_asyncExecutionStatus.json
msc_audit.json
msc_backup-versions.json
msc_backupRecords.json
msc_ca-cert.json
msc_cloudSecStatus.json
msc_consistency.json
...
 Feedback