Overview

Overview

Cisco Nexus Dashboard Fabric Controller is the comprehensive management solution for all NX-OS deployments spanning LAN Fabric, SAN, and IP Fabric for Media (IPFM) networks in data centers powered by Cisco. Cisco Nexus Dashboard Fabric Controller also supports other devices, such as IOS-XE switches, IOS-XR routers, and non-Cisco devices. Being a multi-fabric controller, Cisco Nexus Dashboard Fabric Controller manages multiple deployment models like VXLAN EVPN, Classic 3-Tier, FabricPath, and Routed based fabrics for LAN while providing ready-to-use control, management, monitoring, and automation capabilities for all these environments. In addition, Cisco NDFC when enabled as a SAN Controller automates Cisco MDS Switches and Cisco Nexus Family infrastructure in NX-OS mode with a focus on storage-specific features and analytics capabilities.

Nexus Dashboard Fabric Controller primarily focuses on Control and Management for three primary market segments:

  • LAN networking including VXLAN, Multi-Site, Classic Ethernet, and External Fabrics supporting Cisco Nexus switches running standalone NX-OS, with additional support for IOS-XR, IOS-XE, and adjacent Host, Compute, Virtual Machine, and Container Management systems.

  • SAN networking for Cisco MDS and Cisco Nexus switches running standalone NX-OS, including support for integration with storage arrays and additionally Host, Compute, Virtual Machine, and Container Orchestration systems.

  • Media Control for Multicast Video production networks running Cisco Nexus switches operated as standalone NX-OS, with additional integrations for 3rd party media control systems.

Previously, DCNM was an application server running on a VM deployed via OVA or ISO, a physical appliance deployed via ISO, or software installed on a qualified Windows or Linux machine. Cisco Nexus Dashboard Fabric Controller, Release 12 is available as an application running exclusively on top of the Cisco Nexus Dashboard Virtual or Physical Appliance.

Virtual Nexus Dashboard deployment with OVA is also referred to as virtual Nexus Dashboard (vND) deployment, while the deployment of Nexus Dashboard on physical appliance (Service Engine) is known as physical Nexus Dashboard (pND) deployment. To deploy Nexus Dashboard based on your requirement, refer to Cisco Nexus Dashboard Deployment Guide.

Beginning with Release 12, Cisco Nexus Dashboard Fabric Controller has a single installation mode. Post installation, it supports selection from multiple personas at run-time. After the Nexus Dashboard Fabric Controller Release 12.1.3 is installed, you can choose from one of the following personas:

  • Fabric Discovery—Discover, Monitor, and Visualize LAN Deployments.

  • Fabric Controller—LAN Controller for Classic Ethernet (vPC), Routed, VXLAN, and IP Fabric for Media Deployments.

  • SAN Controller—SAN Controller for MDS and Nexus switches. Enhanced SAN Analytics with streaming telemetry.


Note


For any given instance of Nexus Dashboard, only one version of NDFC service will be active. On the active NDFC service, you can configure only one persona at any given instance.


All features/services are modularized, broken into smaller microservices, and the required microservices are orchestrated based on the feature set or feature selections. Therefore, if any feature or microservice is down, only that microservice is restarted and recovered, resulting in minimal disruption.

In contrast to the previous DCNM Active-Standby HA model, Cisco NDFC introduces Active-Active HA deployment model utilizing all three nodes in a cluster for deploying microservices. This has significant improvement in both latency and effective resource utilization.

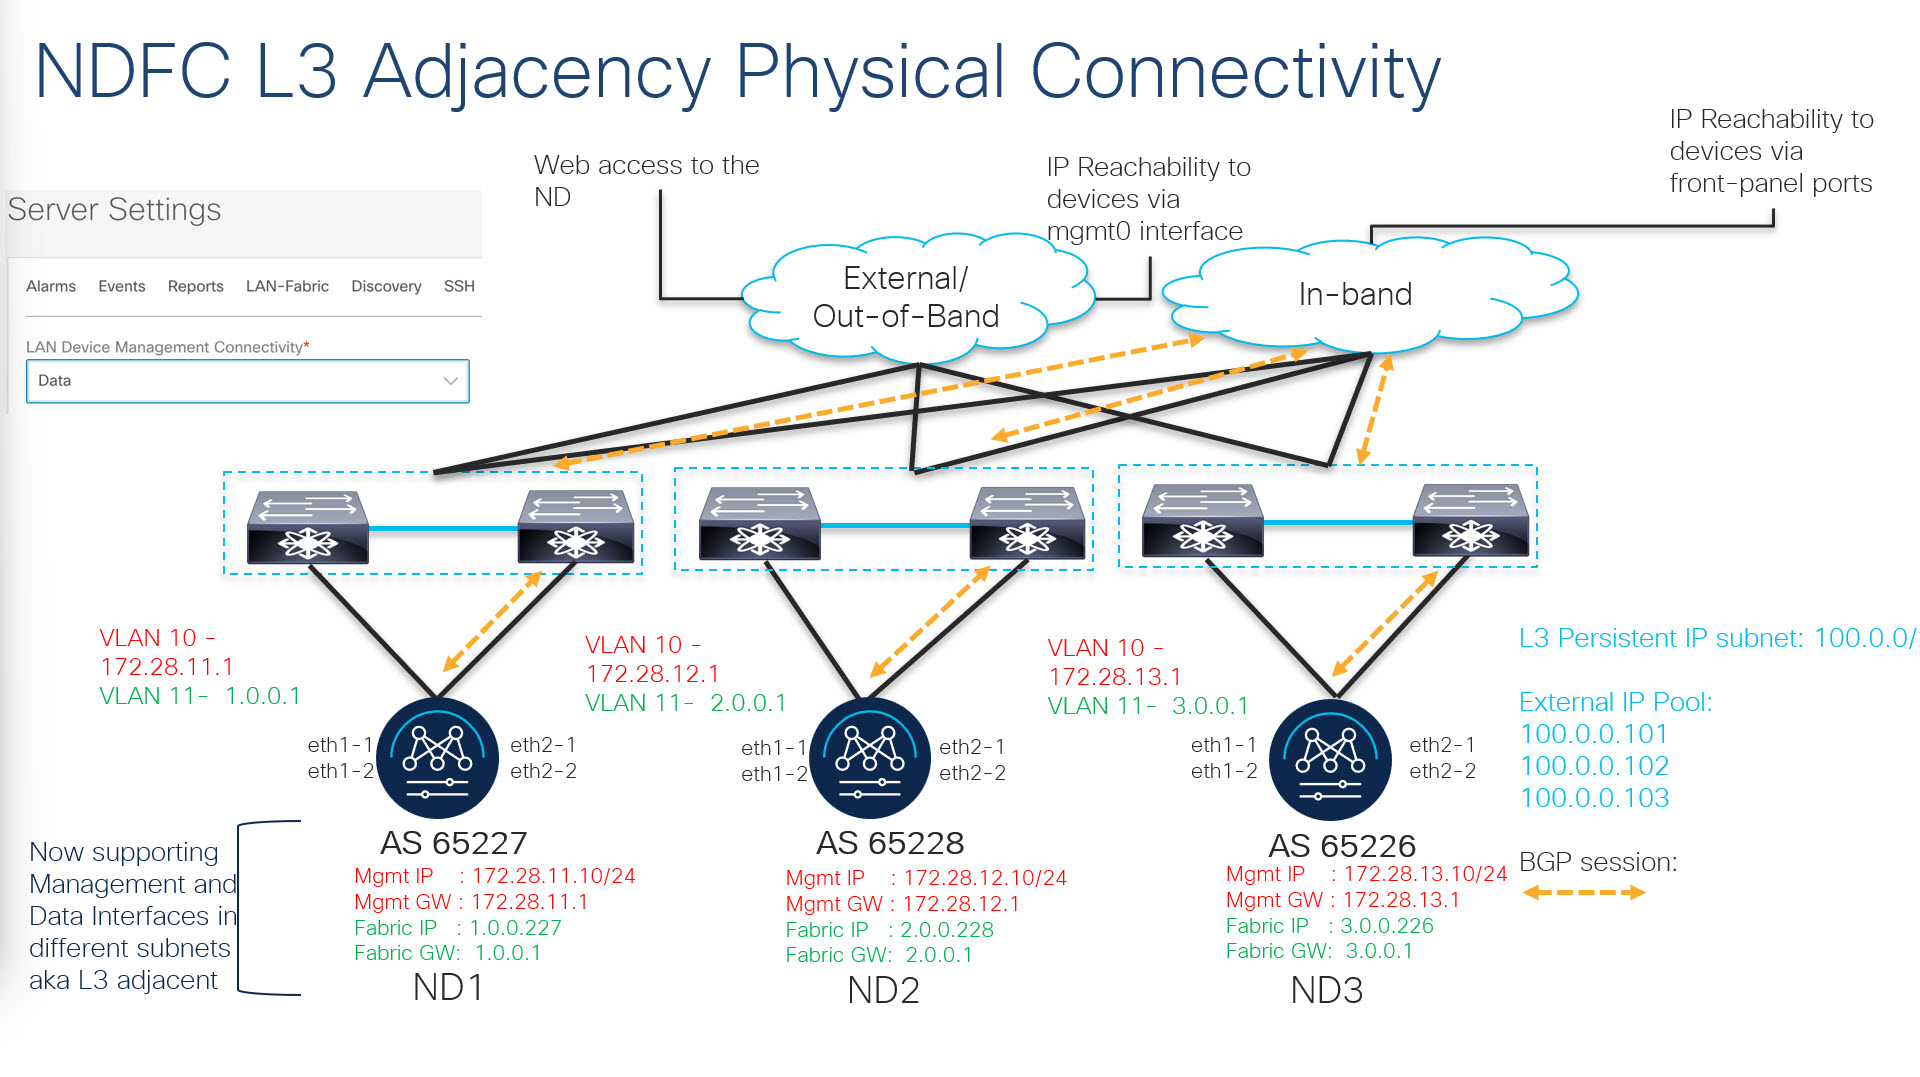
From Cisco NDFC Release 12.1.2, you can run NDFC on top of virtual Nexus Dashboard (vND) instance with promiscuous mode disabled on port groups that are associated with Nexus Dashboard interfaces where External Service IP addresses are specified. Recall that vND comprises a management interface and a data interface. By default, for LAN deployments, two external service IP addresses are required for the Nexus Dashboard management interface subnet. Similarly, by default, for SAN deployments, two external service IP addresses are required for the Nexus Dashboard data interface subnet.

Before the NDFC Release 12.1.2, if in-band management or Endpoint Locator or POAP feature was enabled on NDFC, you were required to enable promiscuous mode for the Nexus Dashboard data or fabric interface port-groups. This setting was mandatory for these features to work correctly. Again, as mentioned earlier, enabling promiscuous mode is no longer required for any port-groups associated with the vND. In fact, it is recommended to disable promiscuous mode for the port-groups post upgrade to ND 2.3.1/NDFC 12.1.2, in case customers are coming from previous versions.


Note


  • Disabling promiscuous mode is supported from Cisco Nexus Dashboard Release 2.3.1c.

  • You can disable promiscuous mode when Nexus Dashboard nodes are layer-3 adjacent on the Data network, BGP is configured, and fabric switches are reachable through the data interface.

  • You can now disable promiscuous mode even when Nexus Dashboard interfaces are Layer-2 adjacent on the Management and Data networks.


Note


Default option for promiscuous mode on VMware ESXi environments is Reject, meaning promiscuous mode is disabled.


This release of NDFC supports hybrid cloud connectivity between on-prem and public cloud networks. Using Cisco Nexus Dashboard Orchestrator, connectivity is orchestrated between NDFC managed VXLAN fabric and Cloud Application Policy Infrastructure Controller (cAPIC) deployed on public cloud.

For more information, see Cisco Nexus Dashboard Fabric Controller (Formerly DCNM).

Deployment Options

The following deployment options are available for Cisco Nexus Dashboard Fabric Controller:

  • NDFC on single-node (non-HA Cluster)

    • Fabric Discovery for production environments (<= 50 switches)

    • Fabric Controller for production environments (<= 50 switches)

    • Fabric Controller in IP Fabric for Media controller mode for production environments

    • SAN Controller for production environments (<= 80 switches)

  • NDFC on a 3-node Cluster (active-active HA mode)

    • Fabric Discovery

    • Fabric Controller

    • SAN Controller with or without SAN Insights

  • NDFC on a 5-node virtual Nexus Dashboard (vND) Cluster (active-active HA mode)

    • Fabric Discovery

    • Fabric Controller

  • NDFC on a 3-node physical Nexus Dashboard (pND) Cluster (active-active HA mode)

    • Nexus Dashboard Insights and NDFC in Fabric Controller persona (NDFC-Managed mode) – 3 pND nodes (<= 50 switches)

  • NDFC on a Nexus Dashboard running on top of Red Hat Enterprise Linux (RHEL)

    • SAN Controller with or without SAN Insights

  • NDFC on a virtual Nexus Dashboard (vND) with KVM hypervisor

    From Release 12.1.1e, on a virtual Nexus Dashboard with KVM hypervisor, you can deploy NDFC with the following personas:

    • Supports Fabric Controller, Fabric Discovery, and SAN Controller personas.

Refer to Nexus Dashboard Capacity Planning to determine the number of switches supported for each deployment.

In the 3-node and 5-node deployment, there are 3 Nexus Dashboard master nodes. In the 5-node deployment, the additional 2 nodes serve as worker nodes. The 3-node or 5-node cluster deployment is an active-active solution, that is, all nodes are utilized to run micro-services of Nexus Dashboard Fabric Controller. When a node fails, microservices running on the node, are moved to the other nodes. Nexus Dashboard Fabric Controller functions normally in a one-node failure scenario. However, it is expected that there will be a brief disruption to services that must be migrated on node failure. After the migration of services is complete, the supported scale will continue to be supported albeit at degraded performance. To restore optimal NDFC performance, a system running with one failed node is not the desired situation and must be rectified at the earliest. A 3-node or 5-node cluster cannot tolerate the failure of two Master nodes or all NDFC services will be disrupted.

Cohosting of NDFC Managed mode with Nexus Dashboard Insights

From Release 12.1.1e, you can host NDFC Fabric Controller persona and Nexus Dashboard Insights on the same Nexus Dashboard Cluster in Managed mode to manage fabrics and Nexus Dashboard Insights to monitor the same fabrics. Note that NDFC in Fabric discovery mode, that is, monitored mode with NDI on the same Nexus Dashboard cluster is supported with NDFC Release 12.0.2f. Cohosting requires 4 physical Nexus Dashboard nodes for a maximum scale of up to 50 switches. This functionality is also supported on NDFC Release 12.1.1e with the corresponding paired Nexus Dashboard Insights release.


Note


Nexus Dashboard deployed on KVM doesn’t support cohosting NDFC and Insights service on the same Nexus Dashboard cluster.


Note


For cohosting NDFC and Insights on the same Nexus Dashboard cluster, the Nexus Dashboard nodes must be Layer 2 adjacent. Support for Layer 3 adjacency for cohosting deployments will be introduced in future releases.


The following table shows the compatible versions for Nexus Dashboard and services.

Services

Compatible Version

Nexus Dashboard

3.0.1

Nexus Dashboard Insights

6.3.1

Nexus Dashboard Fabric Controller

12.1.3

The following table shows the system requirements for Nexus Dashboard.

Specification

Supported Scale

Number of physical Nexus Dashboard nodes

3

Number of switches supported

50

Number of flows supported in Nexus Dashboard Insights

1000

Installation of NDFC and NDI on the same Nexus Dashboard

Cisco NDFC can be cohosted with Nexus Dashboard Insights on the same Nexus Dashboard.

Before you begin

  • Ensure that you’ve installed the required form factor of Cisco Nexus Dashboard. For instructions, refer to Cisco Nexus Dashboard Deployment Guide.

  • Ensure that you meet the requirements and guidelines described in Prerequisites section in Cisco NDFC Installation Guide.

  • The Cisco DC App Center must be reachable from the Nexus Dashboard via the Management Network directly or using a proxy configuration. Nexus Dashboard proxy configuration is described in Cisco Nexus Dashboard User Guide.

  • If you are unable to establish the connection to the DC App Center, skip this section and follow the steps described in Installing Services Manually section in Cisco NDFC Installation Guide.

  • Ensure that the services are allocated with IP pool addresses on the Cisco Nexus Dashboard. For more information, refer to Cluster Configuration section in Cisco Nexus Dashboard User Guide.

Installing Nexus Dashboard

Install the required form factor of Cisco Nexus Dashboard. For instructions, refer to Cisco Nexus Dashboard Deployment Guide.

Installing NDFC

Refer to Cisco NDFC Installation Guide.

Configure NDFC sites on Nexus Dashboard. Refer to the Adding Sites section in the Cisco Nexus Dashboard Deployment Guide.

Installing NDI

On the same Nexus Dashboard set up, install the Nexus Dashboard Insights service. Refer to Cisco Nexus Dashboard Insights Deployment Guide, for more information.

Post Installation

After installing compatible versions of NDFC and NDI on the 5-node physical Nexus Dashboard, launch NDFC as Fabric (LAN) Controller. Create Fabric, discover and import switches on NDFC fabric. Nexus Dashboard automatically identifies the NDFC fabric and lists on the Sites page as entities.


Note


You must provide the password for each of the sites in the Nexus Dashboard site manager.


Deployment Profile Simplification

Nexus Dashboard deployment profile simplification is intended to help streamline the onboarding of services against a given deployment scale and relieve the task of remembering the cross-connect of deployments.

Beginning with Cisco Nexus Dashboard Release 2.2.1, resource profile selection has been reduced to several more intuitive parameters directly related to your deployment use case. These parameters, such as number of switches or flows describe the fabric size and use case intent, and allow the cluster to intelligently determine the resources needed for the service. The parameters are categorized as Network Scale.

NDFC selects an appropriate profile from among the predefined set of profiles to match the scale.


Note


You must restart the services on the Nexus Dashboard after modifying the network scale parameters.


To view or modify the Network Scale parameters on Cisco Nexus Dashboard, perform the following steps:

  1. In Nexus Dashboard, navigate to Admin > System Settings.

  2. In the Network Scale tile, click the Edit icon to modify the network scale parameters.

  3. In the Number of Sites field, provide the target number of sites for your deployment that this Nexus Dashboard cluster will manage.

  4. In the Number of Switches field, provide the target number of switch nodes for your deployment.

  5. In the Flows per second field, provide the target number of flows across sites for LAN/IPFM/SAN-Insights deployments or scale supported by NDFC/NDI cohosted setup.

From Release 12.1.1e, NDFC deployment profiles use a different naming convention for these deployment profiles which is more in line with the scale numbers that each profile supports.

On the fresh install of Nexus Dashboard, the Network Scale is empty. We recommend that you define the number of sites, switches, and flows per second in the Network Scale. In such a scenario, the service selects a default profile based on the number of cluster nodes.

If the available cluster compute capacity is less than the desired Network Scale, Cisco NDFC installation displays an error. You must resolve the network scale values on Nexus Dashboard and proceed to install NDFC. Note that the recommendations specified in the error message provide useful suggestions about remedial action.

Nexus Dashboard assigns profile names for supported scale values with NDFC. For validated scale numbers, refer to Cisco NDFC Verified Scalability, Release 12.1.1e.

When you upgrade to this release, the individual containers are restarted and the newly spawned containers start with new resource requests and limit values.

Layer 3 Reachability Between Cluster Nodes

From Release 12.1.1e, NDFC can be deployed as a service on Nexus Dashboard with Layer 3 adjacent nodes. A sample NDFC Layer 3 adjacent Physical Connectivity topology is as shown in the following image.

When using Layer 3 adjacency between the Nexus Dashboard nodes on which the NDFC service is running, the persistent IP addresses are advertised using the Nexus Dashboard Data or Fabric interface. The Layer 3 Persistent IP subnet pool must be unique and will be advertised to the fabric using BGP on Nexus Dashboard. Cisco NDFC pods, such as EPL/SNMP Trap/SCP that requires Persistent IPs, are advertised as /32 BGP entries with the next hop of Nexus Dashboard Data Interface. Also, the BGP session between the Nexus Dashboard node and the uplink switches must be configured using directly connected links.

For information about persistent IP addresses, see Persistent IP Requirements for NDFC.

To deploy Layer 3 cluster connectivity, Nexus Dashboard nodes use BGP local and remote autonomous system configuration, along with Data Network gateway of the node to establish eBGP sessions with neighboring routers over the Data interface. As Nexus Dashboard nodes use gateway IPs to establish sessions, during Nexus Dashboard cluster configuration, the neighboring BGP peers must be Layer 2 adjacent. Peers without Layer 2 adjacent connectivity are not supported. You must configure the BGP network correctly to ensure that the Nexus Dashboard routes are transmitted correctly.

Upgrade or modification from an existing Layer-2 adjacent Nexus Dashboard cluster to a Layer-3 adjacent cluster is not supported. When using Layer 3 adjacency, NDFC service is supported only when the switch connectivity is through the Nexus Dashboard Data interface. Choose NDFC UI > Settings > Admin tab. From the LAN Device Management Connectivity drop-down list, select Data.

Nexus Dashboard uses eBGP to publish up-to-date reachability of /32 routes for reaching NDFC features using external service IPs obtained from the Persistent IP subnet. If a node or network fails, the external IPs are not reachable until recovery is complete (if the network can recover itself). After the microservices on the failed node are brought up on one of the existing nodes on the cluster, the eBGP peering from that node will automatically advertise the corresponding /32 persistent IP reachability to the rest of the network, by that means, autorepairing the service disruption.

The following table provides information about different scenarios about Layer 3 adjacent cluster nodes connectivity.

Network details Support provided
Modify or upgrade from Layer 2 adjacency to Layer 3 adjacency Not supported; the cluster must be redeployed if necessary.
Modify or upgrade from Layer 3 adjacency to Layer 2 adjacency Not supported; the cluster must be redeployed if necessary.
NDFC to Switch connectivity over the management interface

Supported

(The traffic initiated by the switch to NDFC is routed via the Data Interface)

NDFC to Switch connectivity over Data interface Supported
Nexus Dashboard BGP traffic over the management interface Not supported
Cisco Nexus Dashboard BGP traffic over Data interface Supported
Nexus Dashboard BGP peer L2-Adjacent Supported
Nexus Dashboard BGP peer L3-Adjacent Not supported

See Cisco Nexus Dashboard User Guide for more information.

Appendix

The following images show different NDFC connectivity