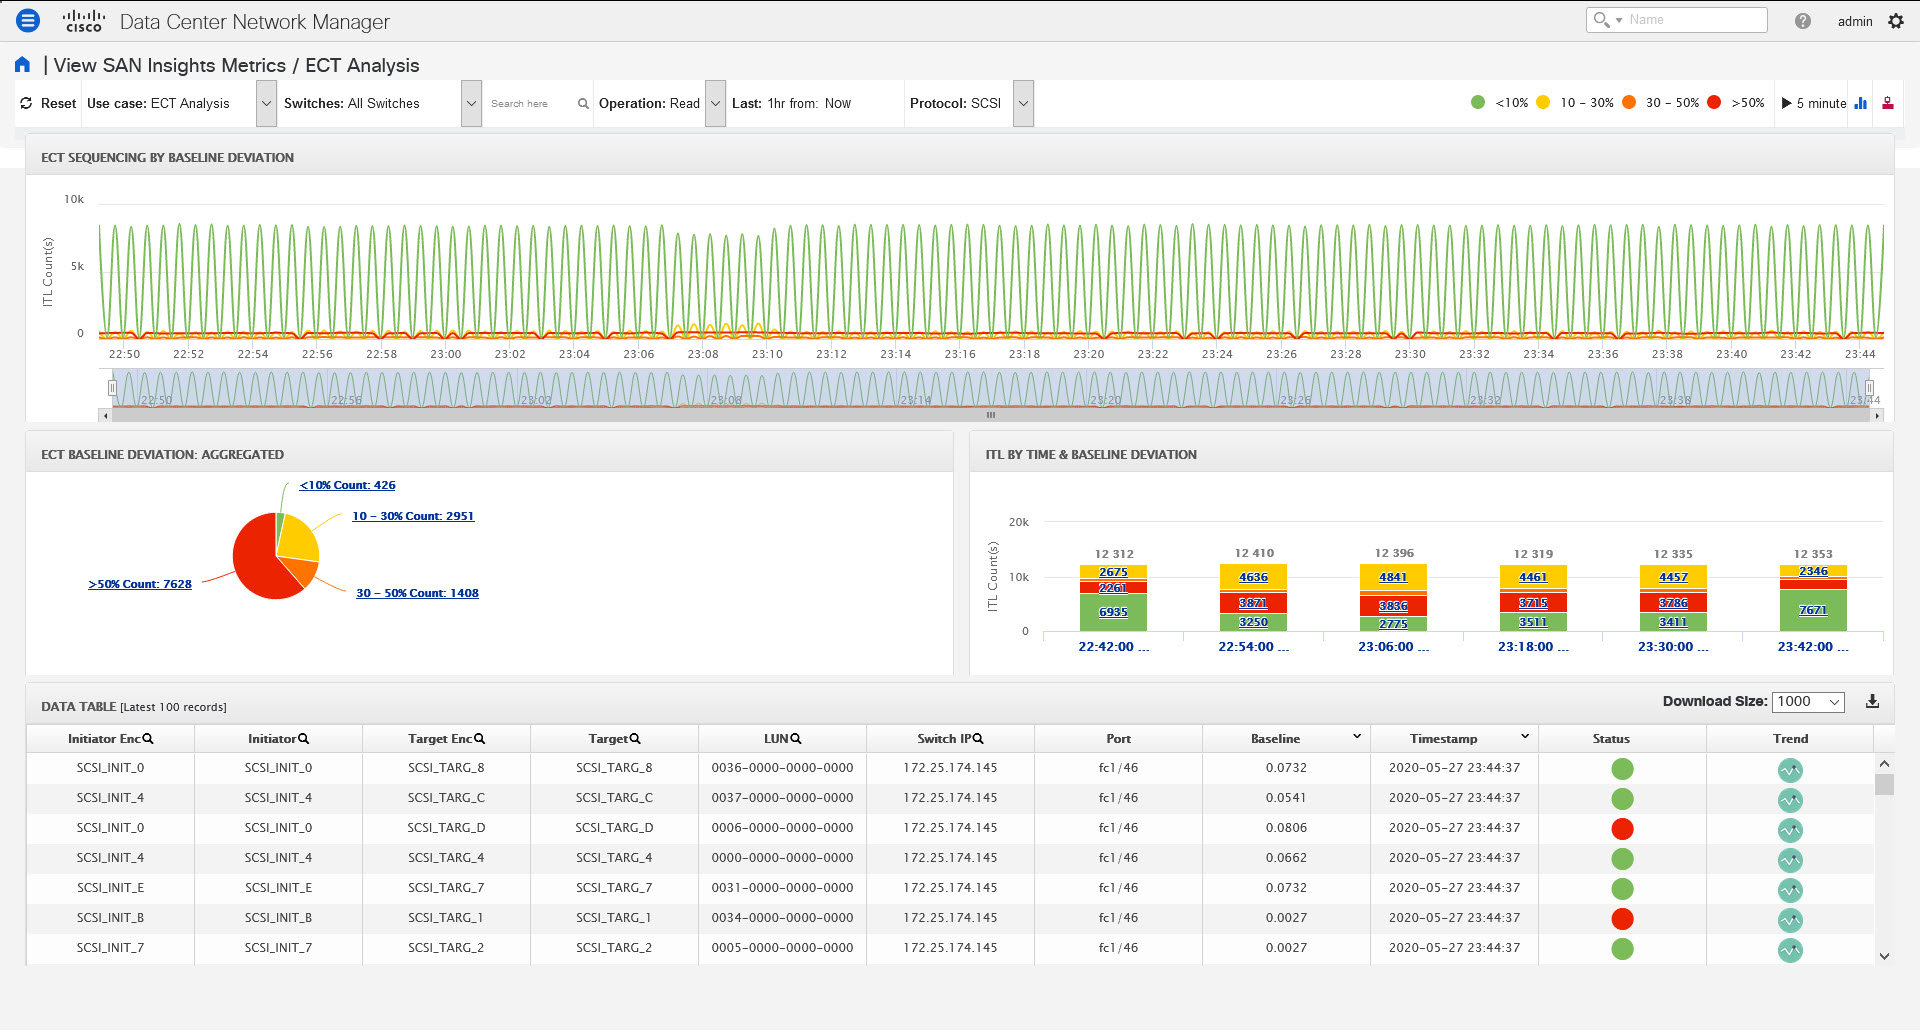
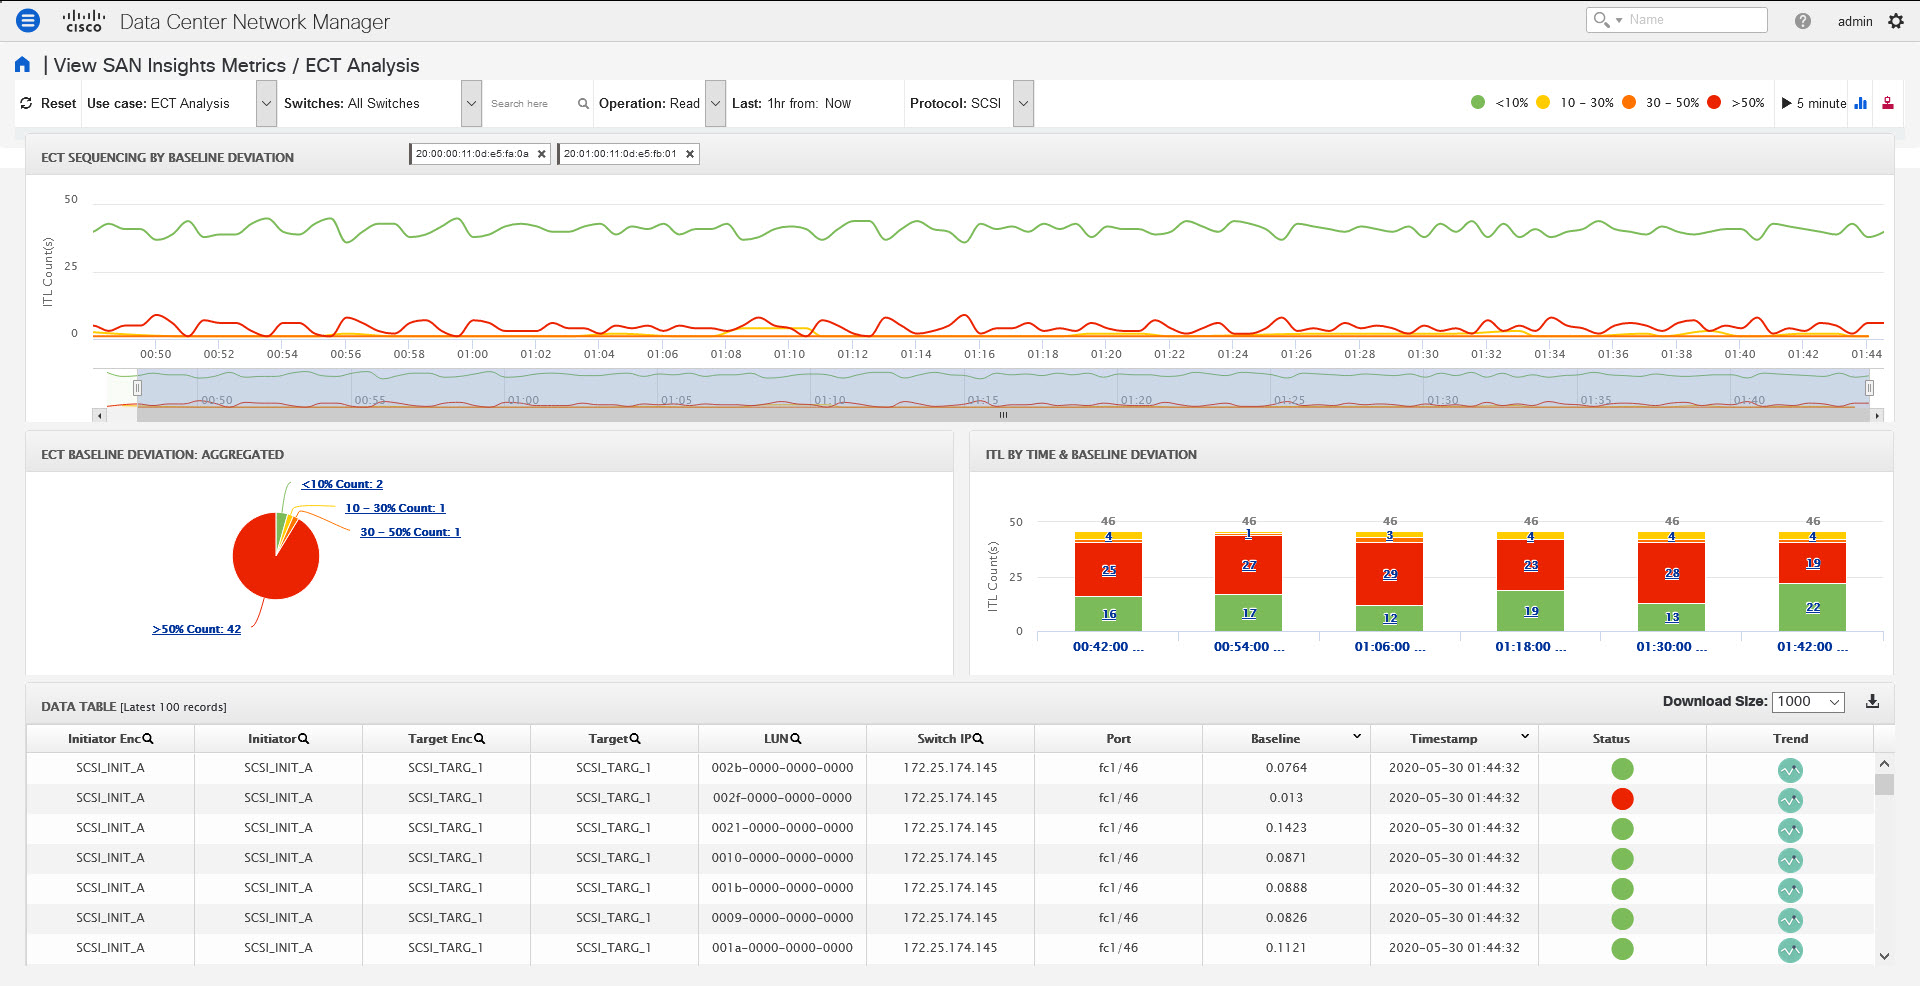
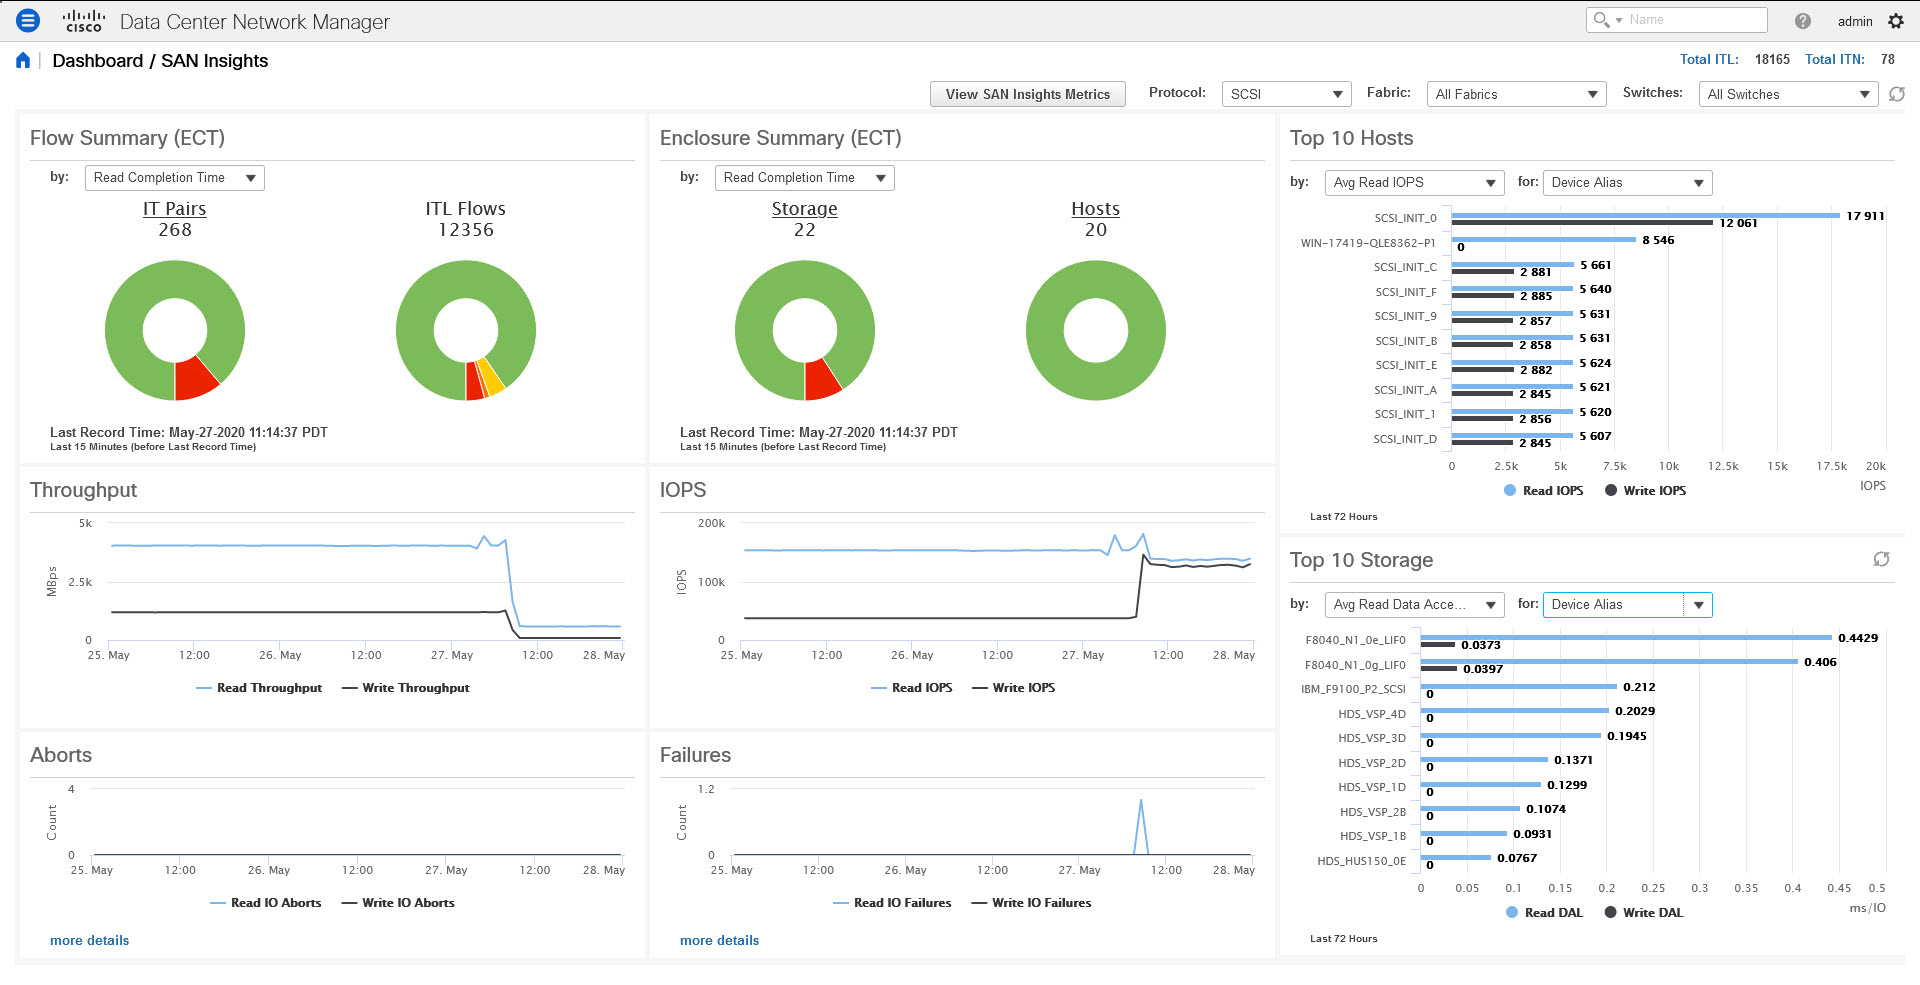
From the Cisco DCNM Web UI > Dashboard > SAN Insights, click on the View SAN Insights Metrics to view the ECT Analysis.
There are four components in ECT Analysis:
-
Data table
-
ECT Sequencing by Baseline Deviation
-
ECT Baseline Deviation Aggregated
-
ITL By Time & Baseline Deviation
From Release 11.3(1), Cisco DCNM allows you to
view SAN Insights metrics based on two protocols, SCSI and NVMe. By default,
the SCSI protocol is selected. However, you can change this
setting from the Administration > DCNM Server > Server
Properties. Ensure that you restart the SAN Insights service to use the
new properties. (Restart the SanInsight service on Linux or Pause/Resume Post Processor
App on SAN-OVA/ISO/SE
deployments)
From Release 11.4(1), Cisco DCNM allows you to view data for a time frame of any 14 days
within the last 90 days. (up to a default maximum of 90 days). You can modify the
san.telemetry.expire.rollup property on the Web UI
> Administration > DCNM Server > Server Properties to modify the maximum
default days. You can choose the date using the date picker and view the historical data
starting from the selected date at hourly granularity.

Note
|
The default duration of the ECT analysis 30 minutes60 minutes. You can click the Reset button to clear all the applied data filters.
|

Note
|
The Last filter displays the period of historical data. The default period of the historical data is 30 minutes60 minutes.
|
When you upgrade from Release 11.1(1) to 11.2(1) or 11.3(1), the old
data takes two weeks to age out. The performance of the SAN Insights metrics improves
after two weeks, after the upgrade.

Note
|
The data in the ECT Analysis view can be filtered by selecting the switch from the
drop-down list or by specifying the WWPN\Enclosure Name\LUN-ID\Switch-IP in the
Search here field. From
Release 11.4(1), you can filter it by Device Alias, also.
|
You can enter the text in the Search here field to search for the value in the ECT Sequencing by Baseline Deviation table.
The Search here field in the filters indicates that you must search for their value.
The ECT Analysis page is representing the aggregated behavior of the ITL Flows by comparing the current normalized Exchange
Completion Time (ECT) to its historical behavior (ECT Baseline) using the below logic. The normalized ECT value is the amount
of time it takes to transfer a KB (kilobyte) of data.
ECT Baseline for each ITL Flow (Reads and Writes) is calculated using weighted average learned continuously over a training
period:
-
The ECT Baseline computation consists of two parts: the training period and the recalibration time.
-
The training period for ECT Baseline is seven days by default (configurable).
-
After the training is completed, the ECT Baseline remains the same until the
recalibration is triggered after 7 days by default
(configurable).
-
By default every 14 days training runs for seven days
(cyclic).
-
The percentage (%) deviation shows the deviation of the current normalized ECT
compared to the ECT Baseline.

Note
|
Starting 11.4 release, the deviation of the ECT less than the baseline is
considered as negative deviation. The Web UI screens are expected to display
negative values for the computed deviation percentage.
|
Beginning from Release 11.4(1), the flows that have ECT lesser
than the baseline is identified as having negative deviation. This impacts the average
ECT deviation, reducing the severity of momentary spikes. However, it reflects a better
true value of ECT performance.
When you upgrade to Release 11.4(1), some pages on the Web UI
does not display correct color for older data. After two weeks, the new data will show
proper color codes.

Note
|
-
To configure the default training period, edit the
san.telemetry.train.timeframe parameter (default 7)
in the Cisco DCNM Administration > Server
Properties. Restart the DCNM Server process. (Restart the
SanInsight service on Linux or Pause/Resume Post Processor App on
SAN-OVA/ISO/SE deployments)
-
To configure the recalibration time, edit the
san.telemetry.train.reset parameter (default 14 days) in the Cisco DCNM
Administration > Server Properties. Restart
the DCNM Server process. Restart the SanInsight service on Linux or
Pause/Resume Post Processor App on SAN-OVA/ISO/SE deployments.
-
For example, to train the baseline for four days and recalibrate the baseline 10 days after the training period set the training
period to four days and the recalibration time to 14 days.
|
Table 1. Baseline Color Legends
|
Relation
|
Value
|
|
If ECT is above 50% from Baseline
|
Red
|
|
If ECT is above and in range 30–50% from
Baseline
|
Orange
|
|
If ECT is above and in range 10–30% from
Baseline
|
Yellow
|
|
If ECT is below 10% from Baseline
|
Green (implies Normal)
|
The range of value for the Baseline Color Legends can be modified on
the Server Properties file. See the san.telemetry.deviation
definitions in the Administration > DCNM Server > Server
Properties. Ensure that you restart the SAN Insights service to use the
new properties. Restart the SanInsight service on Linux or Pause/Resume Post Processor
App on SAN-OVA/ISO/SE deployments.
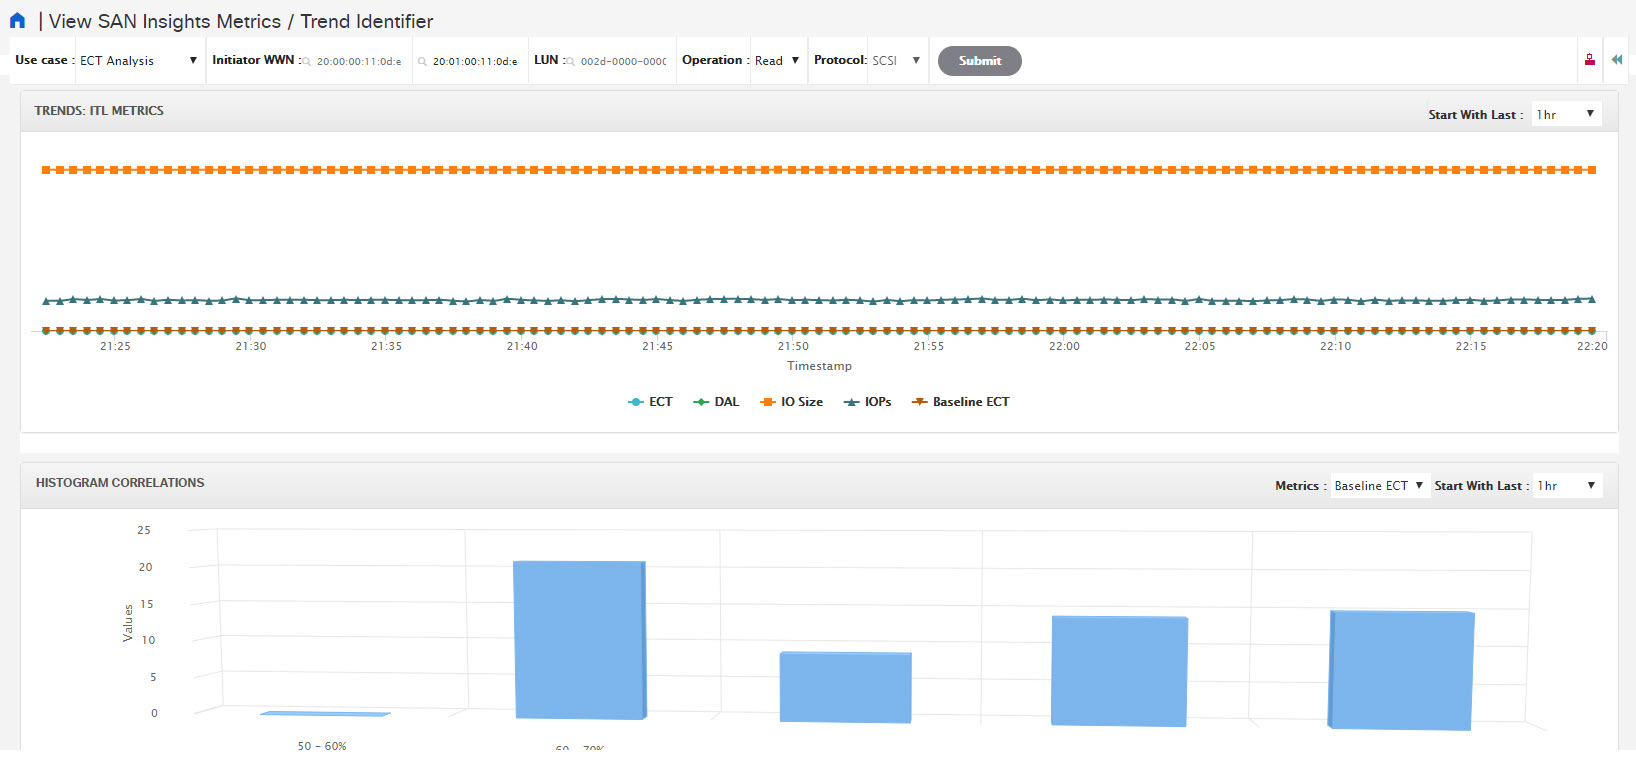
You can click on the Trend Identifier ( ) icon to navigate to Trend Identifier. For more information, see Trend Identifier.
The data in the ECT Analysis UI can be filtered to view data of ITLs corresponding to the above
legend, by clicking the circles to disable and enable. For example, on clicking and
disabling the Yellow and Orange legend circles, the corresponding data will be
displayed.
You can copy and paste the values in the data table into the Search here input field at the top of the UI to filter the data in all components. Values in all the columns marked with Magnifying Glass
( ) icon in the data table are the only fields searchable for this functionality.
The data in the ECT BASELINE DEVIATION AGGREGATED component shows the number of ITLs that are in
each deviation range. Similarly, the data in ITL BY TIME component shows the number of
ITLs grouped by time that are in each deviation range. Clicking on a section of the pie
chart or histogram shows drill down data with Initiator Enclosures, Initiator WWPNs,
Target Enclosures, Target WWPNs, and LUN/Namespaces. Click on the corresponding section
of the chart to download the results in a .csv format.

Note
|
The maximum ECT Baseline Deviation aggregated data is set to 20000.
|
Script Timeout Error in Mozilla browser
In the Mozilla browser, if you see script timeout error with option Stop or Wait, don’t click Stop. Perform the following steps to troubleshoot the script timeout error.
-
Launch the Mozilla Firefox.
-
On the Firefox address bar type about:config and press Return key.
-
In the confirmation message, click I accept the risk!.
-
In the Search field, enter
dom.max_script_run_time.
The Preference names are displayed.
-
Right click on the dom.max_script_run_time Preference name.
Select Modify.
-
Enter an integer value of 0 or 20 for dom.max_script_run_time.
-
Click OK to confirm.
-
Restart the Mozilla Firefox browser.




 Feedback