The documentation set for this product strives to use bias-free language. For the purposes of this documentation set, bias-free is defined as language that does not imply discrimination based on age, disability, gender, racial identity, ethnic identity, sexual orientation, socioeconomic status, and intersectionality. Exceptions may be present in the documentation due to language that is hardcoded in the user interfaces of the product software, language used based on RFP documentation, or language that is used by a referenced third-party product. Learn more about how Cisco is using Inclusive Language.
After defining and securing the network perimeter, the second stage of our security journey is to gain visibility of all assets
within the industrial network boundary. As industrial networks can be quite old, widely dispersed, and involve many contractors,
operators often don’t have an accurate inventory of what is on the network. Organizations may want to understand the normal
state of the OT network as a prerequisite for implementing network security monitoring to help distinguish attacks from transient
conditions or normal operations within the environment. Whether using a risk-based approach, functional model, or other organizing
principles, grouping components into levels, tiers, or zones is a precursor activity before organizations can consider applying
policy to protect and monitor communication between zones. Implementing network monitoring in a passive mode and analyzing
the information to differentiate between known and unknown communication may be a necessary first step in implementing security
policies.
Use Cases
OT visibility is a technology that all personas in OT environments can leverage. OT operators gain benefit of process level
visibility to identify and troubleshoot assets residing on the plant floor. IT operators gain insight into device communication
patterns to help inform policy and improve network efficiency. Security teams gain insight into device vulnerabilities and
deviations from normal device behaviors.
For the purposes of this CVD, nine use cases / personas were identified that required securing. Asset visibility and device
posture aids in securing these use cases by:
Identifying all assets and grouping them into zones. It was stated that the Cell/Area Zone would be able to freely communicate within its own zone. Nevertheless, all assets
must be identified within the zone to ensure that only intended devices reside in the zone, and critical vulnerabilities can
be addressed so exploits cannot occur easily. Visibility also enables IT teams to view when new assets have been onboarded
to the zone, or mobile assets have connected to a new location.
Visualizing data that flows through the conduits between zones. While most traffic is contained within a given zone, interlocking PLCs require communication to cross zone boundaries. Before
policy is implemented, visibility tools enable IT administrators to view existing dataflows and identify which flows should
be removed and which need policy to maintain.
Give a clear view of which source data is coming in through external networks. Network visibility gives a clear view of communication coming from external origins such as the IDMZ or remote access zones,
enabling teams to see when a device is attempting unintended communication to external networks, or an unknown entity has
breached externally accessible zones and is attempting to communicate deep into the OT network.
How to Gain Visibility into the OT Assets
As most of the communication in an IACS traverses the network (wired or wireless), the network infrastructure is in a good
position to act as a sensor to provide visibility of the connected assets. Deep Packet Inspection (DPI) of the IACS communication
is a key means to visibility. DPI decodes all communication flows and extracts message contents and packet headers, providing
the visibility to understand what devices you need to secure, and the policies required to secure them. DPI allows you to
gather device information such as the model, brand, part numbers, serial numbers, firmware and hardware versions, rack slot
configurations, and more. It also allows you to understand what is being communicated over the network. For example, you can
see if someone is attempting to upload new firmware into a device or trying to change the variables used to run the industrial
process.
To achieve complete visibility, all network traffic must be inspected. It is important to note that in an industrial network,
most traffic occurs behind a switch at the cell layer, because that is where the machine controllers are deployed. Very little
traffic goes up to the central network.
When collecting network packets to perform DPI, security solution providers typically configure SPAN ports on network switches
and employ one of three architectures:
Send all traffic to a central server that performs DPI
Deploy dedicated sensor appliances on each network switch
Send traffic to dedicated sensor appliances deployed here and there on the network
While these approaches deliver network visibility, they also create new challenges. Configuring network switches to send traffic
to a central server requires duplicating network flows. A new out-of-band network will generally be needed to transport this
extra traffic, which can be complex and costly. Although this can be acceptable for a very small industrial site, this cannot
be seriously considered in highly automated industries generating a lot of IACS traffic (such as manufacturing), or when devices
are widely spread in locations with no or poor network connectivity (oil and gas pipelines, water or power distribution, etc.).
Connecting sensor appliances to network switches addresses the issues associated with duplicating network traffic. The appliance
collects and analyzes network traffic locally and only sends data to a server for additional analysis. However, installing,
managing, and maintaining dedicated hardware can quickly lead to cost and scalability issues. And because most industrial
traffic is local, gaining full visibility requires deploying appliances on each switch on the network, raising cost and complexity
to intolerable levels. Some technology providers attempt to address this problem by leveraging remote SPAN (RSPAN). RSPAN
allows you to duplicate traffic from a switch that doesn’t have a sensor appliance to a switch that has one.
Figure 1. OT visibility using a SPAN network
While this approach reduces the number of appliances required to provide full visibility, it still increases the amount of
traffic going through the industrial network. Traffic is multiplied because you’re duplicating traffic to SPAN it to a remote
switch. And the more traffic on the network, the slower it becomes, resulting in jitter — often an unacceptable compromise
in industrial networks where processes need to run faster and machines must be timely synchronized.
An Alternative to SPAN
There is a better way to achieve full network visibility: embed DPI capability into existing network hardware. An industrial-grade
switch with native DPI capability eliminates the need to duplicate network flows and deploy additional appliances. Obtaining
visibility and security functionality is simply a matter of activating a feature within the network switch, router, or gateway.
Cost, traffic, and operational overhead are all minimized.
Figure 2. OT Visibility using Sensors embedded in the Switch Infrastructure
A DPI-enabled switch analyzes traffic locally to extract meaningful information. It only sends lightweight metadata to a central
server, which runs the analytics and anomaly detection. That metadata represents about 3-5% of general traffic. The traffic
is so lightweight, it can be transferred over the industrial network without causing congestion or requiring extra bandwidth.
Embedding DPI in network equipment affords both IT and OT unique benefits. IT can leverage the existing network infrastructure
to secure industrial operations without having to source, deploy, and manage additional hardware. Because these network elements
see all industrial traffic, embedded sensors can provide analytical insights into every component of the industrial control
systems. As a result, OT can obtain visibility into operations that it has never had before.
Active Discovery
The completeness of asset discovery is important for IACS networks to get a complete understanding of all the devices on the
network and their associated security risks. For passive discovery to be effective, sensor placement is important and will
be discussed later in the document. However, it is difficult to determine how much of the network has adequately been discovered
as assets will only be seen as they cross the sensor. Gaining a complete picture takes time and can only determine information
that is transmitted by the asset.
Active discovery is an on-demand mechanism for gaining asset visibility. By sending extremely precise and nondisruptive requests
in the semantics of the specific IACS protocols, visibility gaps can be filled. However, there are some misconceptions regarding
active discovery due to the many ways in which it can be implemented.
Active discovery causes unexpected crashes. The argument made by most vendors is that their solutions only use valid protocol commands supported by the industrial assets.
These commands are similar to what the IACS vendor products use for asset management and are hence non-disruptive. In reality,
the reason why old IACS devices are susceptible to crashes during active scanning is because they have limited processing
power for network functions and get overwhelmed when repeated connection attempts are made for communication. So, the reason
for the crashes has less to do with valid or invalid commands being used but rather a factor of how many connection attempts
is being made by the active discovery solution.
From a network hygiene standpoint, it is not uncommon to see industrial networks badly designed with all devices being addressed
from a flat /16 IP subnet. Most IACS detection solution available in the market today are based on a centralized architecture
where traffic mirroring (SPAN) is used to feed an appliance (or a software VM) located at Level-3 of the Purdue model that
does the Passive Discovery.
When the bolt-on Active Discovery capability of these solutions initiate a scan from this central location, they need to cycle
through a range of IP addresses within the scan range. Now, one of the first things that needs to happen to establish communication
for Active Discovery is to resolve ARP. These ARP requests are seen by all devices within the flat network, and the processing
of the barrage of ARP requests can overwhelm the networking stack on legacy IACS devices causing them to crash. While this
is not the only reason for legacy devices crashing, it is quite often the primary cause.
In addition, in most multi-vendor IACS environments, centralized discovery solutions sitting at Level-3 of the Purdue model
are not aware of the specific protocol being used at the Level 0-2 edge. This requires the scanning process to cycle through
a range of IACS protocols (CIP, PROFINET, Modbus, etc.) until the device responds based on the protocol it supports. This
results in unnecessary communication attempts that can also overwhelm the processing power of legacy devices causing disruption.
Centralized active discovery solutions cannot penetrate NAT boundaries. Industrial networks are usually built up of units like cells, zones, bays, etc. that are comprised of machines or control
systems supplied by machine builders and system integrators. It is common practice for these machines especially in discrete
manufacturing to be built in a standardized manner with IACS devices across machines configured in a cookie-cutter approach
with repeating IP addresses. Consequently, industrial networks are rife with network address translation (NAT) being used
to allow the operations and control systems located in the Level-3 to communicate with IACS devices sitting in the lower levels
with duplicate IP addresses.
When it comes to address translation only a small fraction of IACS devices (like PLC, HMI, RTU, etc.) communicate with the
site operations layer, and only those devices’ IP addresses are translated at the NAT device. The implication of this is that
centralized Active Discovery solutions cannot communicate with the vast majority of IACS devices (like IO, drives, safety
controllers, relays, IED) sitting below the NAT boundary whose IP addresses are not translated. In the auto manufacturing
industry as an example, it is typical for less than 17% of devices in level 0-2 to be visible to a centralized Active Discovery
solution. This results in an 83% gap in visibility!
It is recommended that networks use a hybrid approach of active and passive discovery to gain an accurate insight into their
OT network.
Intrusion Detection / Prevention Systems Intrusion sensors are systems that detect activity that can compromise the Confidentiality, Integrity or Availability (CIA)
of information resources, processing, or systems. An Intrusion Detection System (IDS) has the ability to analyze traffic from
the data link layer to the application layer to identify things such as network attacks, the presence of malware, and server
misconfigurations.
An Intrusion Prevention System (IPS) can identify, stop, and block attacks that would normally pass through a traditional
firewall device. When traffic comes in through an interface on an IPS, if that traffic matches an IPS signature/rule, then
that traffic can be dropped by the IPS. The essential difference between an IDS and an IPS is that an IPS can respond immediately
and prevent possible malicious traffic from passing. An IDS produces alerts when suspicious traffic is seen but is not responsible
for mitigating the threat.
The advantage of IDS deployments is that they create no risk of taking down the IACS. This advantage may be due to “false
positives,” where the IDS detects a condition that it believes to be an anomaly or attack, when in fact it is business-critical
traffic. Because IDS systems are typically not inline, they have no effect on network performance statistics such as propagation
delay and jitter (variations in delay). Another risk of IPS solutions is that a catastrophic failure of the IPS system may
cause a complete lack of connectivity. This type of failure is of less concern if solutions are designed with ample redundancy
and without single points of failure.
It is recommended that OT networks adopt a hybrid IDS/IPS deployment, where IDS is deployed in the operational zone of the
network for security alerting and then deploy an IPS north of the critical zone (for example at the Industrial Data Center)
where a false positive would not stop plant operations.
Vulnerability Assessment and Managing Risk
A vulnerability is a weakness in a system or its design that can be exploited by a threat. Vulnerabilities are sometimes found in the protocols
themselves, as in the case of some security weaknesses in TCP/IP. Often the vulnerabilities are located in operating systems
and applications.
A threat is any potential danger to assets. A threat is realized when someone or something identifies a specific vulnerability and
exploits it, creating exposure. If the vulnerability exists theoretically, but has not yet been exploited, the threat is latent
and has not been realized. The entity that takes advantage of a vulnerability is known as the threat agent or threat vector.
A countermeasure is a safeguard that mitigates a potential risk. A countermeasure mitigates risk by either eliminating or reducing a vulnerability,
or by reducing the likelihood that a threat agent can successfully exploit the risk.
Risk is a function of the likelihood of a given threat source exercising a particular potential vulnerability, and the resulting
impact of that adverse event on the organization.
Threat x Vulnerabilities x Impact = Risk
Risk management is the process that balances the operational and economic costs of protective measures and the achieved gains
in mission capability by protecting assets and data that support their organizations’ missions. For example, many people decide
to have home security systems and pay a monthly fee to a service provider to monitor the system for increased protection of
their property. Presumably, the homeowners have weighed the cost of system installation and monitoring against the value of
their household goods and their family’s safety priority. Risk limitation limits a company’s risk exposure by taking some
action. It is a strategy employing a bit of risk acceptance along with a bit of risk avoidance. It is the most commonly used
risk mitigation strategy.
Vulnerability Assessment
The objective of a vulnerability assessment is to ensure that the network and the information systems are tested for security
vulnerabilities in a consistent and repeatable manner. Security vulnerabilities will continue to be discovered in technology
products and services. These vulnerabilities, regardless of whether they are caused by an unintentional software bug or by
design (such as a default administrative password), can be used by malicious persons to compromise the confidentiality, availability,
or integrity of your infrastructure.
Hardware and software vendors typically provide software fixes when they announce the vulnerabilities in their products. When
there is no fix available, vendors typically provide a workaround or mitigation. There is usually a time period between the
announcement of a security vulnerability in a particular technology and the availability of an attack method (an exploit).
Within this time period, system administrators should take action to protect their systems against an attack because at this
point, the public knows that a flaw exists, but attackers are still trying to find a way to take advantage of that vulnerability.
Unfortunately, the vulnerability-to-exploit time period has been steadily decreasing.
With the large quantity of new vulnerabilities from numerous vendors, it can be overwhelming to track all the vulnerabilities.
How can the security team analyze any single vulnerability and determine its relevance to the specific technology architecture?
The solution is to have a good process to determine which ones are relevant to your organization.
CVSS Scores
The Common Vulnerability Scoring System (CVSS) provides a way to capture the principal characteristics of a vulnerability
and provides a better understanding of the risk that is posed by each vulnerability. CVSS is a free and open industry standard
for assessing the severity of computer system security vulnerabilities. CVSS attempts to assign severity scores to vulnerabilities,
allowing responders to prioritize responses and resources according to threat. Scores are calculated based on a formula utilizing
several metrics that approximate ease of exploit and its impact. Scores range from 0 to 10, with 10 being the most severe.
CVSS provides a standard way to assess and score security vulnerabilities. CVSS analyzes the scope of a vulnerability and
identifies the privileges that an attacker needs to exploit it. CVSS allows vendors to better analyze the impact of security
vulnerabilities and more clearly define the level of urgency that is required to respond to the vulnerability. While many
analysts use only the CVSS base score for determining severity, temporal and environmental scores also exist, and factoring
in the likelihood and the criticality to a given network environment.
Cisco Cyber Vision
Cisco Cyber Vision is built on a unique edge architecture consisting of multiple sensor devices that perform deep packet inspection,
protocol analysis, and intrusion detection within your industrial network and an aggregation platform known as Cyber Vision
Center. The Cyber Vision Center stores data coming from the sensors and provides the user interface, analytics, behavioral
analysis, reporting, API, and more. It may be run on a hardware appliance or as a virtual machine.
Components
Cisco Cyber Vision Center can be deployed as a software or hardware appliance depending on your network requirements. Consider the number of sensors,
components, and flows to decide the appropriate installation. At the time of writing this guide, a single Cyber Vision Center
can support 150 sensors, 50,000 components, and 8 million flows. For the most up to date numbers see the Platform Support page.
For deployments that are too large for a single instance of Cyber Vision Center to handle, or for organizations who wish to
aggregate multiple sites into a single dashboard view, a Cyber Vision Global Center instance can aggregate up to 20 local Cyber Vision Centers. Cyber Vision Global Center is used for security monitoring across
multiple sites, providing a consolidated view of components, vulnerabilities, and events. Nevertheless, sensor operation and
management activities can be done only on instances of Cyber Vision Center associated with the sensor.
Cyber Vision sensors passively capture and decode network traffic using DPI of industrial control protocols. Cyber Vision sensors are embedded
in select Cisco networking equipment, so you don’t have to deploy dedicated appliances or build an out-of-band SPAN collection
network. Since Cyber Vision sensors decode industrial network traffic at the edge, they only send lightweight metadata to
the Cyber Vision Center, only adding from 2% to 5% load to your industrial network.
Note: Cyber Vision also supports an out-of-band sensor network for environments that require it.
Cyber Vision sensors also have the capability to do active discovery. These active discovery requests originate from the sensor,
deep into the IACS network, so these messages are not blocked by firewalls or NAT boundaries.
Key Features
Comprehensive Visibility: Cyber Vision leverages a unique combination of passive and active discovery to identify all your assets, their characteristics,
and their communications. The Cisco Cyber Vision unique edge computing architecture embeds security monitoring components
within our industrial network equipment. There is no need to source dedicated appliances and think about how to install them.
There is no need to build an out-of-band network to send industrial network flows to a central security platform. Cyber Vision
enables the industrial network to collect the information required to provide comprehensive visibility, analytics, and threat
detection.
Security Posture: Cisco Cyber Vision combines protocol analysis, intrusion detection, vulnerability detection, and behavioral analysis to
help you understand your security posture. It automatically calculates risk scores for each component, device and any specific
parts of your operations to highlight critical issues so you can prioritize what needs to be fixed. Each score comes with
guidance on how to reduce your exposure so you can be proactive and build an improvement process to address risks.
Operational Insights: Cisco Cyber Vision automatically uncovers the smallest details of the production infrastructure: vendor references, firmware
and hardware versions, serial numbers, rack slot configuration, etc. It identifies asset relationships, communication patterns,
and more. Information is shown in various types of maps, tables, and reports. Cisco Cyber Vision gives OT engineers real-time
insight into the actual status of industrial processes, such as unexpected variable changes or controller modifications, so
they can quickly troubleshoot production issues and maintain uptime. Cyber experts can easily dive into all this data to investigate
security events. Chief information security officers have all the necessary information to document incident reports and drive
regulatory compliance.
Incident Investigation and Response: SecureX Threat Response is a security investigation and incident response application. It simplifies threat hunting and incident response by accelerating
detection, investigation, and remediation of threats. The threat response application provides your security investigations
with context and enrichment by connecting your Cisco security solutions (across endpoint, network, and cloud) and integrating
with third-party tools, all in a single console. Abnormal behavior seen in Cyber Vision can be sent to SecureX for further
analysis and context from the other security tools deployed on the network such as Cisco Secure Endpoint, Secure Firewall,
Umbrella and more. The SecureX ribbon on the Cyber Vision user interface makes it even easier to create a case and launch investigations.
Snort IDS: Cyber Vision integrates the Snort IDS engine in select platforms leveraging Talos subscription rules to detect known and
emerging threats such as malware or malicious traffic.
The architectural recommendation is to deploy Cyber Vision Center in the Industrial Zone. Cisco Cyber Vision connects to the
sensor(s) in the cell/area zone and applications on the industrial zone such as NTP and optionally DNS and ISE. The following
figure depicts the communication flows from Cisco Cyber Vision center used in this design guide.
Figure 3. Cyber Vision Communication Flows
Note: Cisco Cyber Vision Center can operate without any connectivity leaving the industrial zone. The flows in the diagram
that meet this condition are optional and their purpose will be explained in this guide.
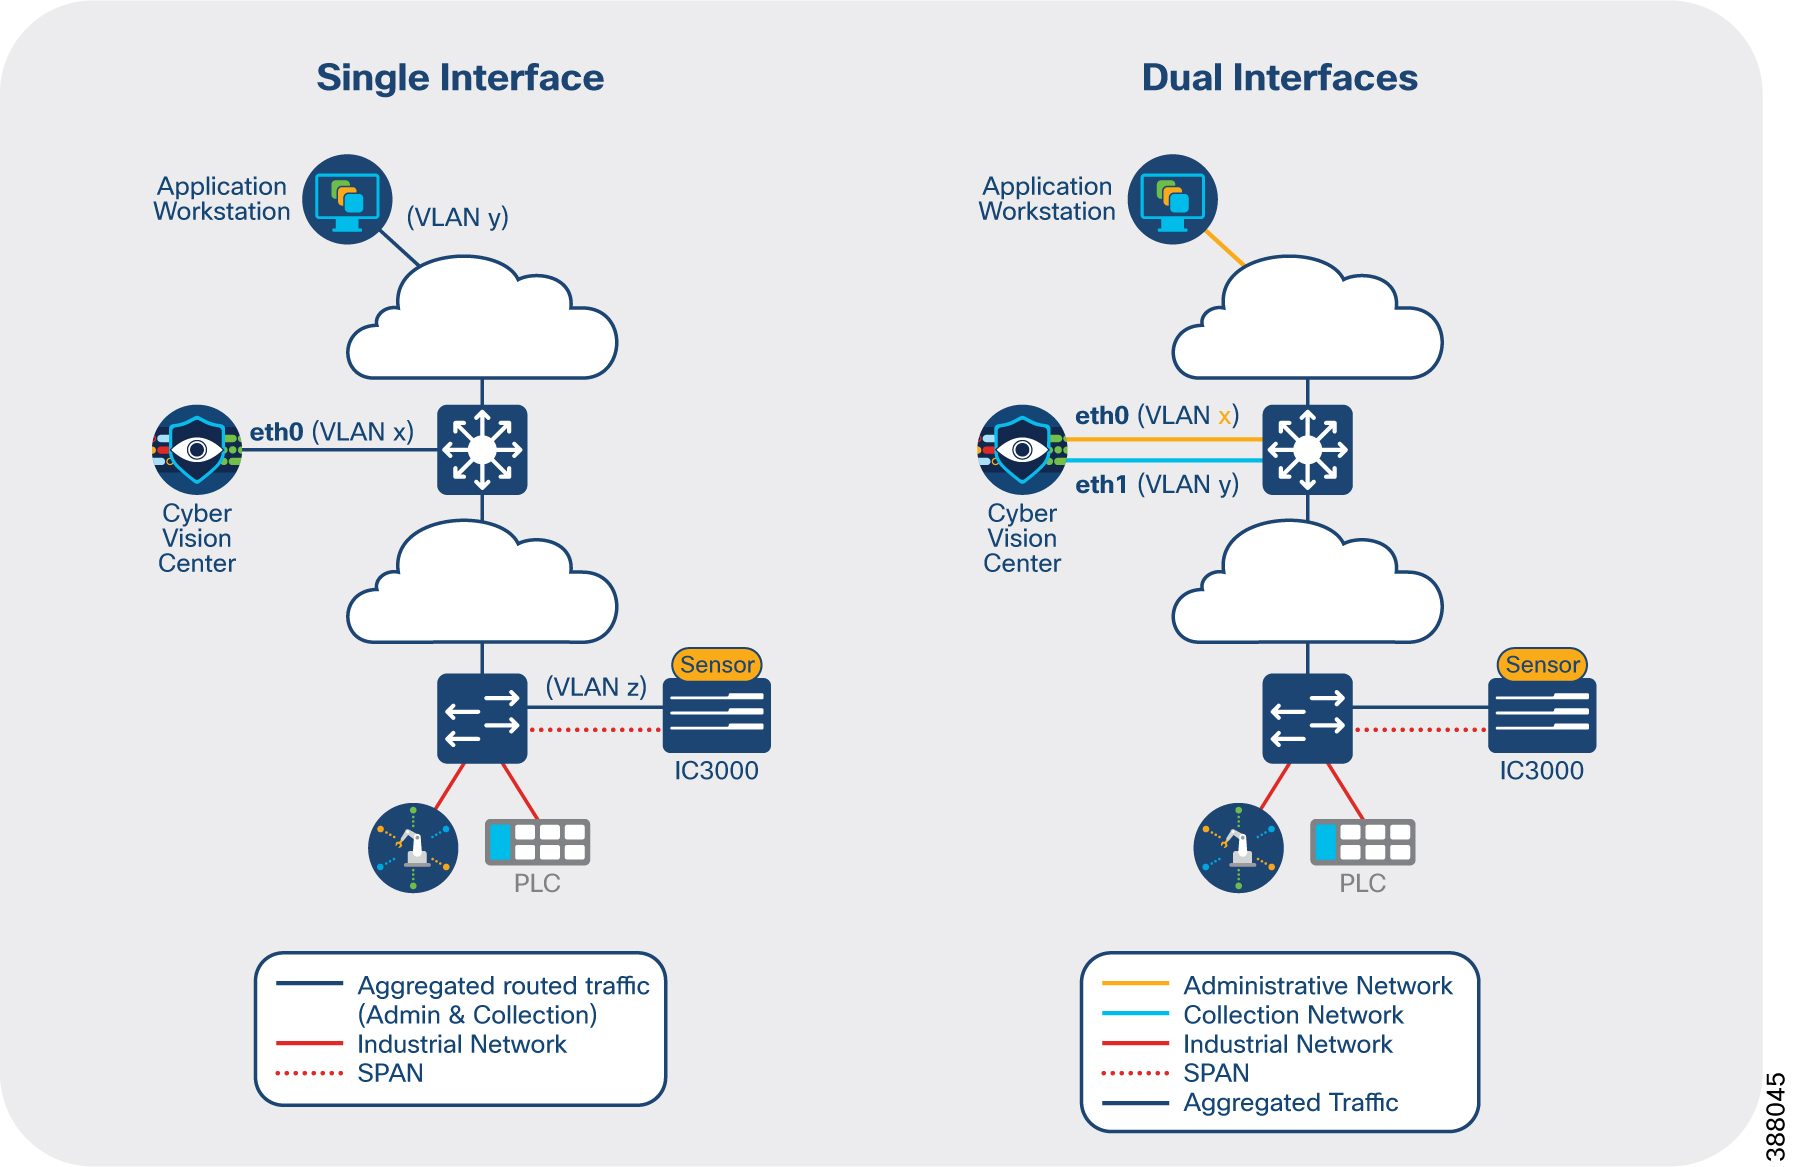
In Cisco Cyber Vision, the administrator network interface gives access to the graphical user interface (GUI) and the collection
network interface connects the Center to the sensors. Ethernet interfaces are allocated in the following way:
Administration network interface (eth0) gives access to the user interface (GUI or API), to the CLI through SSH and is used
for communication with other systems (syslog collector or SIEM, pxGrid, etc.)
Collection network interface (eth1) connects the Center to the sensors
The Center (physical or virtual appliance) has two preconfigured interfaces―eth0 and eth1―that are allocated to the admin
and collection networks respectively by default.
However, if the admin and collection network share the same local area network (LAN), the Center must be configured to use
a single interface. In this case the admin and collection interface should share a single IP address on eth0, and eth1 should
be reserved as a collection interface for DPI on the Center.
Figure 4. Cyber Vision Center Deployment Modes
Cisco Cyber Vision Global Center requires only one interface for management and communication with Cisco Cyber Vision Center
instances. It uses TCP port 5671 for synchronization and updates to the Center. This port should be proxied in the IDMZ or
enabled in the IDMZ firewall to ease communication.
Note: Cisco Cyber Vision Center does not require internet connectivity nor Global Center connectivity to operate. In instances
where Cyber Vision Center is not connected to the Internet, upgrades need to be downloaded from Cisco.com and manually uploaded
in the appliance.
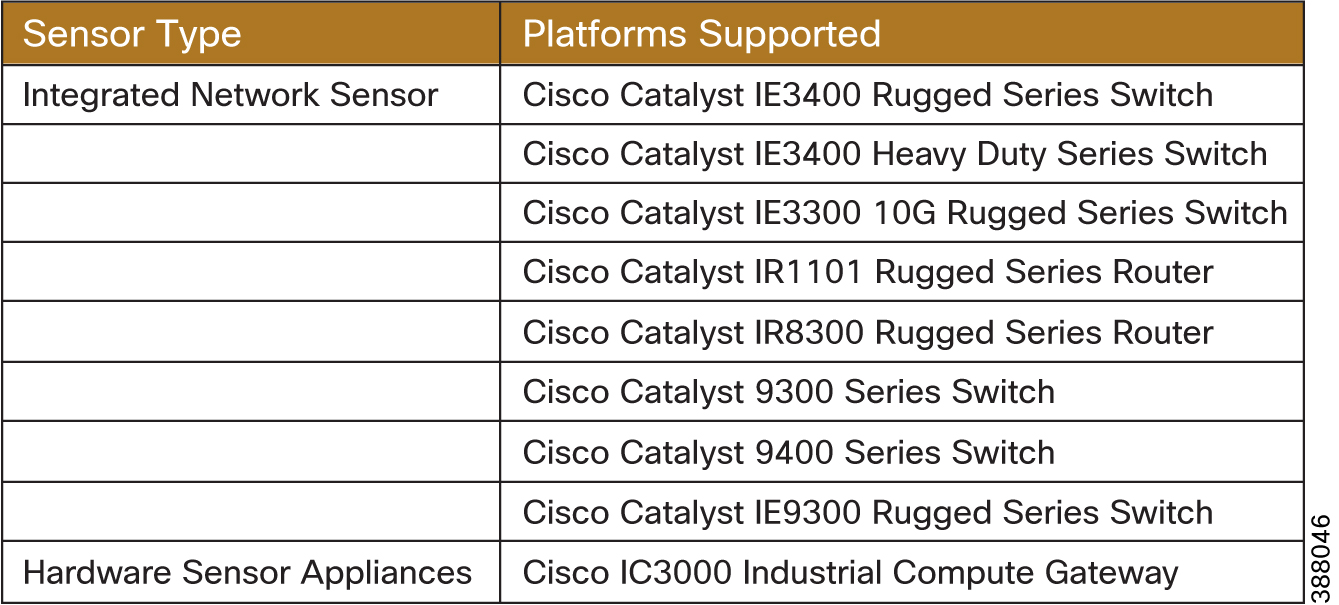
Cyber Vision Sensor Options
The sensors are supported on the platforms listed in the table below.
Figure 5. Supported Cyber Vision Sensor Platforms
In this design guide, the Catalyst IE3400 is deployed within Cell/Area Zones and the Catalyst 9300 is used as the distribution
switch. For the most up to date support information visit the Cisco Cyber Vision Platform Support page.
Effective Sensor Deployment The effectiveness of the Cisco Cyber Vision solution depends on effectively capturing traffic, so deciding the correct location
for the sensor(s) in the network is critical.
A sensor deployed on the distribution switch, such as the Catalyst 9300, will capture flows that leave the Cell/Area Zones.
This deployment option is helpful for building your macro-segmentation policies (to be discussed later in the document) as
you will gain a clear understanding of the zone-to-zone communication patterns. However, significant value of Cyber Vision
is lost when it is deployed only on the distribution infrastructure. None of the intra-zone communication traffic would be
seen, resulting in missing many devices and the most important communication flows in industrial automation networks.
Visibility inside a Cell/Area Zone
To gain visibility on the cell area zone, the recommended option is to deploy the network sensor on the industrial switches.
A sensor is deployed at the edge to capture flows for end devices. Deploying network/hardware sensor at a switch where a controller
is attached is an ideal choice to monitor the traffic because all the I/O devices respond to the poll requests initiated by
the controller. Note that flows that do not traverse the network sensor will not be visible on Cyber Vision Center. To increase
coverage, consider the following options:
Dedicated sensor per switch: to capture all traffic in the Cell/Area Zone, a sensor can be deployed at every switch, resulting in none of the flows being
missed. Embedding sensors in the network is the only way to capture all the data in your network at scale
Dedicated sensor in aggregation switch: to capture intra-zone communication between two small sub segments of a Cell/Area Zone, a sensor can be deployed at the
aggregation point to capture traffic that crosses the sub-segments
Enable SPAN: deploy a single out-of-band sensor and SPAN the traffic either from all or from select switches, corresponding to option
1 or 2 from this list. This model requires additional cabling from every device to the out-of-band sensor and also a free
switch port must be available on those switches from which you want to SPAN traffic.
Note: There are no licensing implications for deploying sensors at every possible location. Cyber Vision licensing is based
on the number of endpoints in which it detects and adds additional value to. A sensor can be deployed on every compatible
switch in the network.
Visibility for flows leaving a Cell/Area Zone
A sensor deployed on the distribution switch, such as the Catalyst 9300, will capture flows that leave the Cell/Area Zones.
This deployment option is helpful to understand zone-to-zone/north-south communication patterns. Keep in mind that this option
is not a replacement for sensors on the cell/area zone since few of the intra-zone communication traffic would be seen, resulting
in missing the most important communication flows in industrial automation networks.
Caution: Be careful when collecting data at higher levels (distribution level), especially if Internet traffic is being monitored.
Monitoring Internet flows in addition to traffic on the industrial network will significantly increase the number of devices
(and components) present in the Center database.
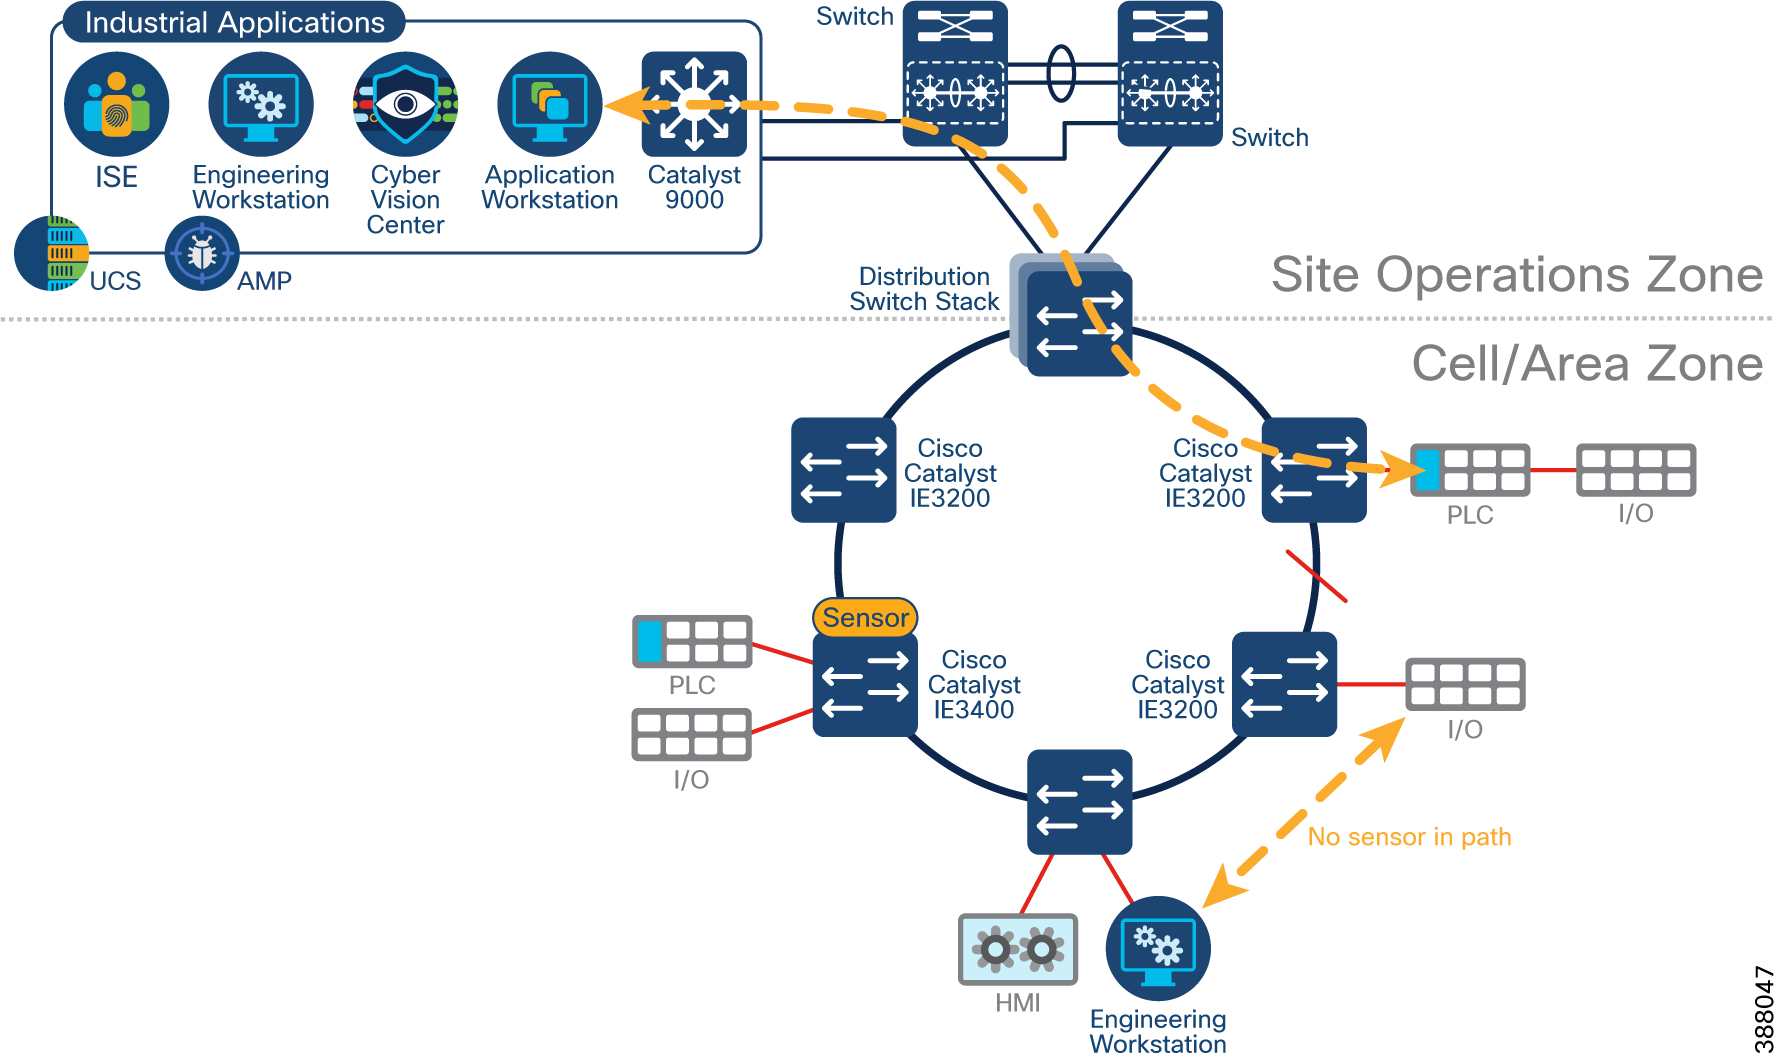
Ring Topology Considerations
Visibility of flows in a ring may change depending on sensor positioning and the active traffic path. The following figure
illustrates a Resilient Ethernet Protocol (REP) ring with two flows that may not be captured by a sensor. The first flow,
between the engineering workstation and IO will never be captured because there are no sensors in the path. The asset will
be identified when communicating to the PLC, but if the intent is to capture all communication on the network, beyond just
asset identification, sensors need to be placed to capture this information. The second flow, between the application workstation
and the PLC may be captured depending on the alternate port configuration. If the traffic navigates the ring travelling anti-clockwise
from the distribution switch, a sensor will be in the path. However, if a link fails, there will be no sensors on the path
as the data travels clockwise from the distribution switch.
Figure 6. Visibility considerations in a ring topology
The recommendation is to always install a sensor at the top of a ring. At a minimum, all traffic leaving and entering the
zone should be captured, with additional sensors placed within the ring depending on desired visibility levels.
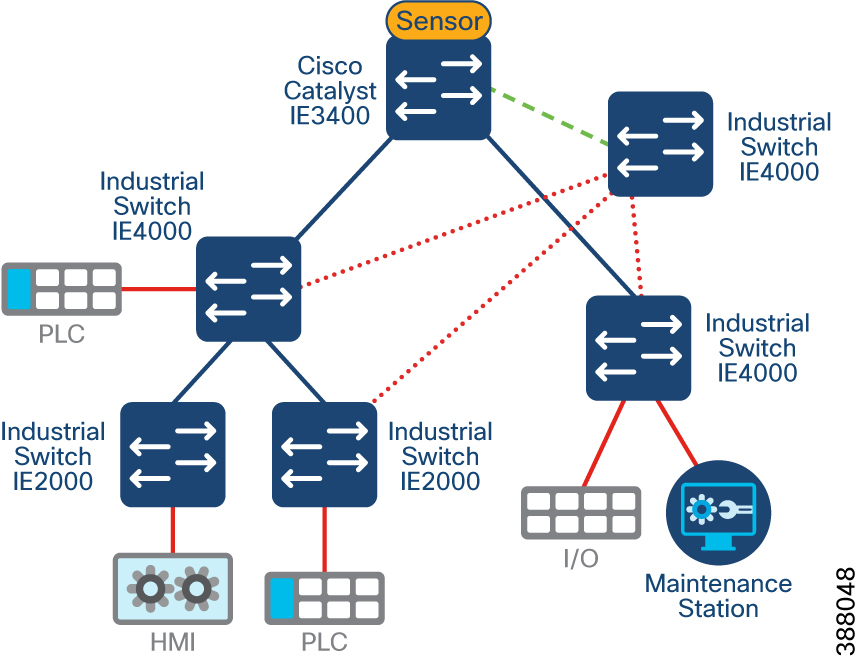
Brownfield Deployment Considerations
If your current industrial network does not have any switches capable of natively running the Cyber Vision sensor, at least
one needs to be introduced. To collect the traffic, enable SPAN on switches to an out-of-band monitoring switch that will
aggregate traffic andsend it to a sensor such as an IE3400, the IC3000, or the Cisco Cyber Vision Center itself. In this model,
additional cabling is required from every switch to the SPAN aggregation point.
Figure 7. Visibility in Brownfield Deployments
Sensor Considerations
When deploying Cisco Cyber Vision Sensors in the network, the following should be taken into consideration:
Cisco Cyber Vision sensors are installed as an IOx application. IOx is included with essentials and advanced license of Cisco
switches.
IOx applications need an SD card (Industrial Ethernet switches) or SSD Disk (Catalyst 9300) to be installed. These parts are
optional on the switch ordering configuration.
Industrial switches (Catalyst IE3400 and Catalyst IE3300 10G) require an SD Card of at least 4GB. SD card should be procured
by Cisco to guarantee functionality.
Catalyst 9300/9400 switches require an SSD of at least 120GB.
Sensors need an IP address to communicate with the Cisco Cyber Vision Center (collection interface). For network sensors deployed
in IOx, this IP address needs to be different from other IP addresses on the switch. Although it can belong to any VLAN on
the switch, it is recommended that the IP address is assigned on the management network. We recommend that the sensor IP address
as well as other IP addresses for network management are not NAT’d.
The sensor also needs a capture interface to reach the monitor session in the switch. This has local significance only, so
VLAN used for RSPAN to the sensor should be private to the switch.
The following ports are needed for communication between Cisco Cyber Vision Center and Cisco Cyber Vision Sensor:
From Cisco Cyber Vision Sensor to Cisco Cyber Vision Center
NTP (UDP port 123)
TLS 1.2 (TCP port 443)
Syslog (UDP port 10514)
AMQPS (TCP port 5671)
From Cisco Cyber Vision Center to Cisco Cyber Vision Sensor
SSH (TCP port 22)
Network sensor installation (TCP port 443)
Hardware sensor installation (TCP port 8443)
It is possible to install a sensor using CLI, local device manager, or Sensor Management Extension on Cisco Cyber Vision Center.
The first two options require getting a provisioning file from the center and copying it to the switch in order to complete
installation. When using the Sensor Management Extension, the center connects to the switch directly and provisions the sensor.
Therefore, it is recommended to use Sensor Management Extension on Cisco Cyber Vision Center to simplify sensor installation.
If multiple Cisco Cyber Vision sensors discover the same device, Cisco Cyber Vision center combines the information into a
single component.
For networks with devices behind a NAT, IP addresses captured by the sensor will depend on the location of the sensor. If
the capture is done before the traffic is translated, Cisco Cyber Vision will show the private IP of the device. If the sensor
is installed on the traffic path after translation is done, Cisco Cyber Vision will show the translated IP address. In case
of multiple capture points, it is possible to see a component for the private IP and a component for the translated IP on
Cisco Cyber Vision Center, in other words, duplicate devices in the inventory.
Cyber Vision Active Discovery
With Cyber Vision, active discovery is initiated by the Cyber Vision Sensor embedded in the Cisco IE switches, that are distributed
at the edge of the industrial network. The solution does much more than just distributing the initiator of the discovery.
The Active Discovery is a closed-loop system between the Passive and the Active Discovery components. It works by the Passive
Discovery first listening to the traffic on the network and then informing the Active Discovery component on which protocols
are present on that section of the network. The Active Discovery component then initiates a broadcast hello request in the
semantics of specific IACS protocol at play, and the Passive Discovery component decodes the response from the IACS devices.
When needed the Active Discovery component may initiate a unicast command to collect further information from the discovered
devices.
Cyber Vision active discovery is non-disruptive. The fact that the Passive and Active components are embedded on the switches at the very point where the IACS devices connect
to the network enables Cyber Vision discovery to be extremely precise and non-disruptive. Cisco Cyber Vision does not scan
the network, instead it sends hello packets to devices for selected industrial protocols. There is no longer a need to enter
IP scan ranges nor is there a need to guess which protocol is being used on a specific machine or process at the edge of the
network. The intelligence built into the closed-loop system automates the Active Discovery. The user simply has to enable
Active Discovery and has full control to activate the capability on a per switch basis if needed and the ability to configure
the frequency which it executes.
Cyber Vision Active Discovery is not handicapped by the presence of NAT. Cisco recognizes the need for NAT in industrial networks and simplifies the process by providing L2 NAT (mapping between
inside and outside IPs bound to MAC address) capability at line rate on the Cisco IE switches. This eliminates the need to
additional L3 NAT devices. But regardless of whether L2 or L3 NAT is used, by virtue of the Passive and Active components
of the Cyber Vision Sensor being embedded in the IE switches, the Active Discovery is distributed and is initiated from below
the NAT layer, and results in 100% visibility of the IACS devices on the industrial network.
Vulnerability Assessment in Cyber Vision
Vulnerabilities are detected in Cisco Cyber Vision thanks to rules stored in a Cyber Vision Knowledge Database (DB). These
rules are sourced from several CERTs (Computer Emergency Response Team), manufacturers, and partner manufacturers. Technically,
vulnerabilities are generated from the correlation of the Knowledge DB rules and normalized device and component properties.
A vulnerability is detected when a device or a component matches a knowledge DB rule.
Figure 8. Cyber Vision Vulnerability Dashboard
Information displayed about vulnerabilities (1) includes the vulnerability type and reference, possible consequences, and solutions or actions to take on the network. Most
of the time though, it is enough to upgrade the device firmware. Some links to the manufacturer website are also available
for more details on the vulnerability.
A score reports the severity of the vulnerability (2). This score is calculated upon criteria from the Common Vulnerability Scoring System or CVSS. Criteria are for example the
ease of attack, its impacts, the importance of the component on the network, and whether actions can be taken remotely or
not. The score can go from 0 to 10, with 10 being the most critical score.
You also have the option to acknowledge a vulnerability (3) if you do not want to be notified anymore about it. This is used for example when a PLC is detected as vulnerable, but a
security policy has been defined to protect against it. The vulnerability is therefore mitigated. An acknowledgment can be
canceled at any time. Vulnerabilities acknowledgment/cancelation is accessible to the Admin, Product and Operator users only.
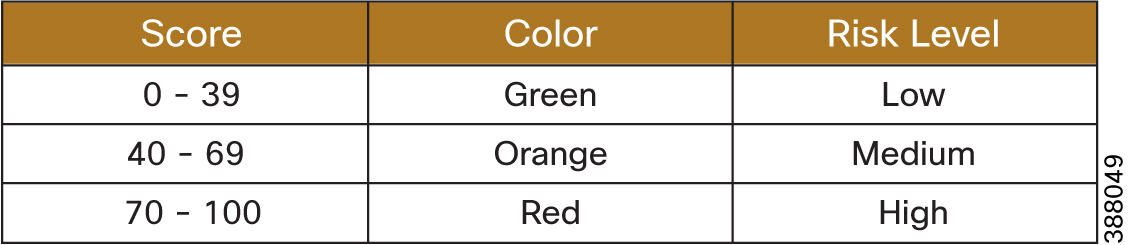
Cyber Vision Risk Score
A risk score is an indicator of the good health and criticality level of a device, on a scale from 0 to 100. It has a color
code associated to the level of risk:
Figure 9. Cyber Vision Risk Score by color
The risk score is meant to help the user easily identify which vulnerable devices are the most critical to mitigate within
the overall network. It provides limited and simple information on the cybersecurity of the monitored system. It is intended
as a first step in security management to take actions by showing the causes of high scores and providing solutions to reduce
them. The goal is to minimize and keep risk scores as low as possible. The solutions proposed can be to:
Patch a device to reduce the surface of attack
Remove vulnerabilities
Update firmware
Remove unsafe protocols whenever possible (FTP, TFTP, Telnet, etc.)
Create an access control policy
Limit communications with external IP addresses
In addition, it is necessary to define the importance of the devices in your system by grouping devices and setting an industrial
impact. Thereby, increasing or decreasing the risk score, which will allow you to focus on most critical devices.
The Cyber Vision risk score is computed as follows:
Risk = Impact x Likelihood
Impact answers the question; What is the device “criticality”, that is, what is its impact on the operation? Does it control a small,
non-significant part of the network, or does it control a large critical part of the network? To do so, the impact depends
on the device tags assigned by Cyber Vision. Is the device a simple IO device that controls a limited portion of the system,
or is it a SCADA that controls the entire factory? These will obviously not have the same impact if they are compromised.
Note: A Cyber Vision user can influence the device impact by moving it into a group and setting the group industrial impact
(from very low to very high). By default, Cyber Vision may decide the impact a device has on your network is small, because
it only communicates with a handful of other devices. However, if you as an administrator decide that these groups of assets
are highly critical, the risk score will change based on this manually entered information.
Likelihood answers the question: What is the likelihood of this device being compromised? It depends on:
Device Activities, or more precisely activity tags. Some protocols are less secure than others. For example, telnet is less
secure than SSH.
The exposure of the device communicating with an external IP subnet.
Device vulnerabilities, considering CVSS scoring.
Visualize Assets and Flows using Cyber Vision Groups
The first thing to do when using Cisco Cyber Vision is to organize components in a meaningful way. OT networks can contain
thousands of components and visibility of these devices can be overwhelming. It is recommended to use Cyber Vision Groups
to organize components according to industrial processes or areas. Furthermore, each group can be assigned an industrial impact
rating which will have a direct impact on the risk score. Benefits of using groups include:
Groups can be used as a filter when building a Preset. This allows you to monitor a specific production process or area of
the plant.
Groups simplify network map visualization by aggregating the devices and activities on the Map view. Aggregated activities
are called Conduits. The following figure shows a network map for a specific process and the communication conduits.
Groups identify inter cell/process flows by showing Conduits leaving the area on the Preset Map.
Groups provide context to ISE for profiling of devices. More information can be found in the segmentation chapter of this
design guide.
Figure 10. Cyber Vision Network Maps with Device Groups
Recommendations when creating device groups in Cyber Vision include:
Create Parent Groups based on manufacturing areas or processes
Create Sub-groups based on process groups that span multiple manufacturing areas. This information helps define segmentation
policies in the next chapter of the guide
Assign an industrial impact variable to the group according to group criticality
If the network is segmented use the subnet filter to identify components to be grouped
If NAT is used, group devices using the inside IP address
Presets and Baselines
In large networks, it is recommended to use presets to divide the industrial network. A preset is a set of criteria which
aims to show a detailed fragment of a network. Cyber Vision data can be filtered to create a preset per device tag, risk score,
device groups, activity tags, sensors, network information (e.g., subnet or VLAN), or keyword. It is recommended to use presets
to define the processes which should be monitored. For example, a preset could be defined to view all assets and traffic within
a given production line, resulting in alerts being generated when a change is detected in production line activity.
Monitor mode in Cisco Cyber Vision is a feature used to detect changes inside industrial networks. The traffic patterns in
the industrial network are generally constant and their behaviors tend to be stable over time. To start monitoring a network,
the normal operating state needs to be defined. For example, a normal state of the network can be a typical weekday operating
mode, in which numerous processes are performed iteratively. Alternate operating states can also be captured, such as a weekend
slow down, or during a holiday period.
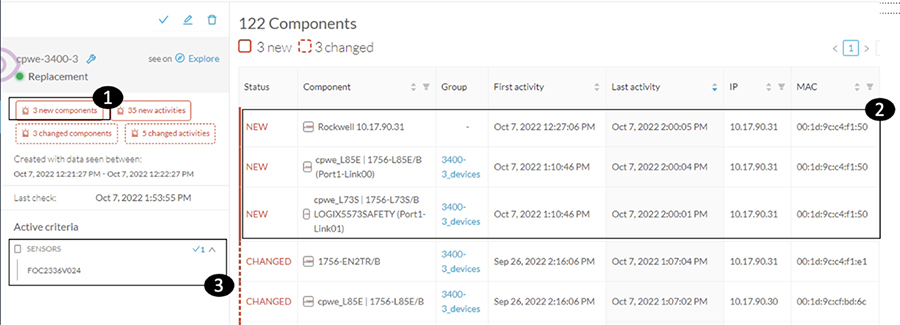
After capturing the data (the recommended collection time is 2 weeks), a baseline can be saved and changes, either normal
or abnormal, are then noted as differences in the baseline. Deviations from the baseline can either be acknowledged, and included
as part of the baseline, or investigated further. The following figure illustrates new components being reported with the
following information:
How many components are new or have changed
List of components
Filter criteria for the preset (in this example, the Cisco Cyber Vision Sensor is used)
Figure 11. Cyber Vision deviations from Baseline
Note: it is not recommended to include the public IP address tag in any baseline creations. This will result in too many alerts
as devices that communicate outside the network are typically too dynamic.
Presets containing critical assets are a good candidate for creating baselines. Typically, critical assets are controllers
which determine the plant operation. Cisco Cyber Vision can monitor programs and firmware version changes that might cause
malfunction or even stop a production line. For this use case a Preset can be created filtering by Group(s) identifying the
processes to be monitored and the Controller tag. Any changes on the Component will be highlighted as well as any new activities to a controller. Cisco Cyber Vision depicts
a changed Component with the following information:
How many changes on devices are seen.
Detail of changes when selecting a component from the list. In this case a controller mode was changed. It is possible to
investigate the change using flows and acknowledge or report differences.
Filter criteria for the Preset; in this example Group and controller tag is used.
OT user could investigate activity with flows. In this example flow properties show details associated with a program download
such as downloaded project, workstation, and user.
Note: It is recommended to include a public IP address preset outside of a baselining activity. Having a preset dedicated
to public IP communications will provide clear insight into what devices are trying to reach outside of the industrial network
and security should be in place to either block or protect this traffic.
Cyber Vision IDS
Snort IDS is provisioned in some Cisco Cyber Vision sensors such as the Catalyst 9300, IC3000 and Catalyst IR8340. The rules
and basic configuration of Snort is packaged in the Cyber Vision knowledge database (KDB) which is updated regularly by Cisco.
Rules can be enabled and disabled based on a category and Cyber Vision provides the ability to upload custom rule files to
generate specific alerts. For more information about Snort in Cyber Vision see the Cyber Vision GUI User Guide.
Note: Snort IDS is deployed as an IOx application in the Catalyst 9300. The bandwidth is limited to approximately 30,000 packets
per second and should be reserved for east / west traffic between cell/area zones only. If a high-performance IDS solution
is required, the recommendation is to deploy a dedicated firewall appliance such as the Cisco Secure Firewall alongside the
Catalyst to transparently capture the traffic. Design guidance for this approach is currently out of scope for this version
of the design guide but will be added during a later release.
Performance
The control system engineer deploying a hardware or network sensor must consider its performance numbers. The critical performance
metrics for Cyber Vision Version is documented in the Cisco Cyber Vision Architecture Guide.
Note: In order to reduce the load on Cyber Vision Sensor, avoid monitoring both access and trunk ports as it doubles the number
of packets fed to the DPI engine and the bandwidth used if the mirrored traffic is sent over RSPAN. When installing sensors
on access switches, monitor the access ports only. If you do not have sensors in the access switches, then SPAN on the aggregation
switch trunk ports will be required.
Licensing
Cisco Cyber Vision Center requires a license. Licenses must be available in a smart account to register product instances.
The following options are available:
Direct cloud access to Cisco Smart Software Manager (SSM): Cyber Vision has a direct connection to the SSM cloud.
Cloud access via https proxy: Cyber Vision uses a web proxy such as the Umbrella Secure Internet Gateway to send information to Cisco SSM.
Cisco Smart Software Manager On-Prem: Usage information is sent to a local appliance. Cisco SSM On-Prem would reside in the IDMZ, and information is periodically
sent to the SSM cloud.
Offline: Licenses are reserved in SSM and applied manually.
The recommended approach, and the option validated in this design is Cisco Smart Software Manager On-Prem.
Note: Cisco Cyber Vision Global Center does not require an additional license.


 Feedback