Network

Table 1. Feature History

Feature Name

Release Information

Description

another Real Time Monitoring Support for Routing, License, Policy, and Other Configuration Options

Cisco IOS XE Catalyst SD-WAN Release 17.6.1a

Cisco SD-WAN Release 20.6.1

Cisco vManage Release 20.6.1

This feature adds support for real-time monitoring of numerous device configuration details, including routing, policy, Cloud Express, Cisco SD-WAN Validator, TCP optimization, SFP, tunnel connection, license, logging, and Cisco Umbrella information. Real-time monitoring in Cisco SD-WAN Manager is similar to using show commands in the CLI of a device.

There are many device configuration details for Cisco SD-WAN Manager. However, only a subset of the device configuration details are added in Cisco IOS XE Catalyst SD-WAN Release 17.6.1a and Cisco vManage Release 20.6.1.

Additional Real Time Monitoring Support for AppQoE and Other Configuration Options

Cisco IOS XE Catalyst SD-WAN Release 17.9.1a

Cisco SD-WAN Release 20.9.1

Cisco vManage Release 20.9.1

This feature adds support for real-time monitoring for AppQoE and other device configuration details. Real-time monitoring in Cisco SD-WAN Manager is similar to using show commands in the CLI of a device.

Download Output of OMP Routes

Cisco IOS XE Catalyst SD-WAN Release 17.11.1a

Cisco vManage Release 20.11.1

From Cisco IOS XE Catalyst SD-WAN Release 17.11.1a, you can download the output of the OMP Received Routes or OMP Advertised Routes real-time data for Cisco IOS XE Catalyst SD-WAN devices.

View AppQoE Information

Minimum release: Cisco vManage Release 20.9.1

To view AppQoE information on a device, perform the following steps:

  1. From the Cisco SD-WAN Manager menu, choose Monitor > Devices.

    Cisco vManage Release 20.6.x and earlier: From the Cisco SD-WAN Manager menu, choose Monitor > Network.

  2. Choose a device from the list of devices that is displayed.

  3. Click Real Time in the left pane.

  4. Click Device Options, and choose one the following commands:

Device Option

Command

Description

AppQoE Active Flow Details

show sdwan appqoe flow flow-id [flow_id]

Displays the details of a single specific flow.

AppQoE Expired Flows Summary

show sdwan appqoe flow closed all

Displays the summary of AppQoE expired flows.

AppQoE Active Flows Summary

show sdwan appqoe flow vpn-id [vpn_id] server-port [server_port]

Displays flows for a specific VPN.

AppQoE Expired Flow Details

show sdwan appqoe flow closed flow-id [flow_id]

Displays the AppQoE Expired Flow details for a single specific flow.

View a Configuration Commit List

Minimum release: Cisco vManage Release 20.9.1

To view a configuration commit list on a device, perform the following steps:

  1. From the Cisco SD-WAN Manager menu, choose Monitor > Devices.

    Cisco vManage Release 20.6.x and earlier: From the Cisco SD-WAN Manager menu, choose Monitor > Network.

  2. Choose a device from the list of devices that is displayed.

  3. Click Real Time in the left pane.

  4. Click Device Options, and choose the following command:

Device Option

Command

Description

Configuration Commit List

show configuration commit list

Displays the configuration commit list.

Determine the Status of Network Sites

A site is a particular physical location within the Cisco Catalyst SD-WAN overlay network, such as a branch office, a data center, or a campus. Each site is identified by a unique integer, called a site ID. Each device at a site is identified by the same site ID.

To determine the status of network sites:

  1. From the Cisco SD-WAN Manager menu, choose Monitor > Overview.

    Cisco vManage Release 20.6.x and earlier: From the Cisco SD-WAN Manager menu, choose Dashboard > Main Dashboard.

  2. Locate the Site BFD Connectivity dashlet, which displays the state of data connections of a site. When a site has multiple edge devices, this dashlet displays the state of the entire site and not for individual devices. The Site BFD Connectivity dashlet displays three states:

    • Full WAN Connectivity: Total number of sites where all BFD sessions on all devices are in the up state.

    • Partial WAN Connectivity: Total number of sites where a TLOC or a tunnel is in the down state. These sites still have limited data plane connectivity.

    • No WAN Connectivity: Total number of sites where all BFD sessions on all devices are in the down state. These sites have no data plane connectivity.

    Click any of these to view more details. The details are displayed in a pop-up window.
  3. For the desired row, click ... and choose Device Dashboard, SSH Terminal, or Real Time. You will be redirected to the appropriate window based on your selection.

View Network Site Topology

Table 2. Feature History

Feature Name

Release Information

Description

Site Topology Visualization in Cisco SD-WAN Manager

Cisco IOS XE Catalyst SD-WAN Release 17.8.1a

Cisco vManage Release 20.8.1

You can now view the topology diagram of a site in Cisco SD-WAN Manager.

Site Topology Visualization in Cisco SD-WAN Manager (Phase II)

Cisco IOS XE Catalyst SD-WAN Release 17.9.1a

Cisco vManage Release 20.9.1

This feature supports enhanced, interactive visualization of site topology, providing information about the health of devices and tunnels in the topology. It provides you with an improved monitoring and troubleshooting experience.

Information About Site Topology

Cisco SD-WAN Manager generates a topology diagram for each site featuring the Cisco IOS XE Catalyst SD-WAN devices that are deployed in a configuration group. For more information on configuration groups, see Configuration Groups and Feature Profiles.

This topology diagram displays the following information:

  • Device information: The topology diagram displays all the devices that are deployed at a selected site. It displays the model and health status of each device. When you place the cursor over a device name, you can view the hostname and the system IP address of that device. Similarly, when you click a device name, you can view detailed information about the device in the right navigation pane. From this pane, you can navigate to the device dashboard to view more details.

    In Cisco vManage Release 20.8.1, the topology diagram displays only the model and the system IP address of a device.

  • Transport information: The topology diagram displays VPN 0 and all the transport interfaces that are connected to a device, including details of the interface and the protocol. When you place the cursor over a transport interface name, you can view the average upstream and downstream speed in the last three hours.

  • Service VPN information: The topology diagram displays the ID and name of the service VPNs. When you click the drop-down arrow adjacent to the name of a service VPN, you can view the protocol, the interfaces, and the average upstream and downstream speed in the last three hours.

    The topology diagram displays a maximum of 12 service VPNs. If there are more than 12 service VPNs, click the More button to see the complete list of service VPNs in the right navigation pane.

  • Circuit health information: The color of the link between the circuit and the transport interface indicates the circuit health.

  • If one site ID changed (for example, 100 to 200), you will see both 100 and 200 on the site topology view. The old site 100 will disappear after around 30mins.

  • The global topology uses sites data from the site table API. The site table shows only the edge information. So if the Cisco SD-WAN Manager site ID is not same with any of the edge devices, then you'll not see the data for all the sites.


Note


  • If a Cisco IOS XE Catalyst SD-WAN device is associated with a configuration group, but the device is not deployed, the topology diagram displays only the hostname and the system IP.

    However, if a device is associated with a configuration group and the device is also deployed, the topology diagram displays complete details of the device, including LAN and WAN details.

  • If a site has devices that are not associated with a configuration group, the topology diagram displays the standalone devices with only the hostname and the system IP.

  • There is no limit on the number of devices shown in the topology diagram for each site. However, if there are multiple devices in a site, the connections between the devices are not shown.

  • Adjust the zoom level of the topology diagram by clicking the zoom-in and zoom-out icons. Similarly, you can view the topology diagram in a full screen by clicking the full-screen icon.

  • Click the refresh icon to regenerate the topology diagram and view the latest data.

  • View the details of the health metrics by clicking the legend () icon.


Supported Devices for Site Topology Visualization

This feature is supported only on Cisco IOS XE Catalyst SD-WAN devices.

Prerequisites for Site Topology Visualization

  • The device must be deployed to a configuration group.

  • You must have role-based access control (RBAC) for the Device Monitoring feature.

View Network Site Topology

You have the following options to view the topology of a site.

Use the Devices Window

  1. From the Cisco SD-WAN Manager menu, choose Monitor > Devices.

  2. Find the corresponding Cisco IOS XE Catalyst SD-WAN device in the table and click the value in the Site ID column adjacent to this device name.

    Alternatively, click the device name in the Hostname column, and then click the Site ID value in the device dashboard.

Cisco SD-WAN Manager displays the topology of the site.

Use the Geography Window

  1. From the Cisco SD-WAN Manager menu, choose Monitor > Geography.

  2. Click the corresponding Cisco IOS XE Catalyst SD-WAN device in the map.

  3. Click the Site ID value.

Cisco SD-WAN Manager displays the topology of the site.

Data Collection and Cisco Catalyst SD-WAN Telemetry

Table 3. Feature History

Feature Name

Release Information

Description

Manage Data Collection for Cisco Catalyst SD-WAN Telemetry

Cisco IOS XE Catalyst SD-WAN Release 17.6.1a

Cisco SD-WAN Release 20.6.1

Cisco vManage Release 20.6.1

This feature allows you to disable data collection for Cisco Catalyst SD-WAN telemetry using Cisco SD-WAN Manager.

Data collection for telemetry is enabled by default.

Information About Data Collection and Cisco Catalyst SD-WAN Telemetry


Note


Starting from Cisco IOS XE Catalyst SD-WAN Release 17.13.1a, the Controllers tab is renamed as the Control Components tab to stay consistent with Cisco Catalyst SD-WAN rebranding.


Network & Statistics Collection

Network and Statistics Collection is a feature in Cisco SD-WAN Manager that allows for the gathering of operational data from network devices, particularly Cisco IOS XE Catalyst SD-WAN devices. This data collection is typically initiated by network events, such as network connectivity issues or network flaps, which can affect connection stability across the network. This feature can be enabled or disabled according to your needs.

Additionally, you can customize the interval for device statistics collection. To do so, enter the desired interval (in minutes) in the Collection Interval field, which determines how frequently statistics are collected.

From Cisco Catalyst SD-WAN Manager Release 20.14.1, the Data Collection tab has been renamed to the Data Collection & Statistics, and relocated to Administration > Settings > Network Statistics Configuration and Collection. For more information, see Enable or Disable Data Collection

SD-WAN Telemetry

SD-WAN Telemetry Data Collection is a feature in Cisco SD-WAN Manager that provides the capability to gather detailed telemetry information from the network's control components and network infrastructure. This feature is enabled by default when cloud services is enabled for Cisco Catalyst SD-WAN. For Cisco-provided cloud-hosted control components, this option is enabled at the time of provisioning the control components. For more information, see Enable or Disable Cisco Catalyst SD-WAN Telemetry.

From Cisco vManage Release 20.6.1, the option to enable or disable data collection for Cisco Catalyst SD-WAN telemetry Cisco SD-WAN Manager can be found under Administration > Settings > Data Collection.

Before Cisco vManage Release 20.6.1, the Data Collection tab only had the option to enable or disable data collection, and not data collection for Cisco Catalyst SD-WAN telemetry.

From Cisco Catalyst SD-WAN Manager Release 20.14.1, the option to enable or disable data collection for Cisco Catalyst SD-WAN telemetry can be found under Administration > Settings > Cloud Services > Terms & Conditions.

Enable or Disable Cisco Catalyst SD-WAN Telemetry

Before You Begin

The Cloud Services feature must be enabled. See the following Cisco Catalyst SD-WAN scenarios:

  • Cisco cloud-hosted scenario: The Cloud Services feature is enabled by default. For information about enabling or disabling, see Enable or Disable Cloud Services.

  • On-premises installation: The Cloud Services feature is disabled by default. For information about enabling or disabling, see Enable or Disable Cloud Services.

Enable or Disable Cisco Catalyst SD-WAN Telemetry

  1. From the Cisco SD-WAN Manager menu, choose Administration > Settings.

  2. Click Cloud Services and click the Terms & Conditions tab.

    (For Cisco Catalyst SD-WAN Manager Release 20.12.x and earlier, locate the Data Collection option and click Edit.)

  3. SD-WAN telemetry involves the gathering of network performance data for monitoring and optimizing the network, with two available data collection options that can be enabled or disabled as needed:
    • SD-WAN Telemetry Basic: By default this option is enabled if cloud services is enabled for Cisco Catalyst SD-WAN. This option enables Cisco SD-WAN Manager to collect telemetry data from the control components and the network.

    • SD-WAN Telemetry Advanced: By default this option is enabled if cloud services is enabled for Cisco Catalyst SD-WAN. This option provides information about activated features and capabilities within the network. Cisco SD-WAN Manager anonymizes the data and does not send any sensitive information about the overlay to Data Collection Service (DCS).

    (Cisco Catalyst SD-WAN Manager Release 20.12.2 only) To enable or disable advanced data telemetry collection, locate the Advance Data Collection option, click Edit, and enable or disable the option.

  4. Click Save.

Enable or Disable Data Collection

To enable or disable the collection of operational data from network devices, do the following:

  1. From the Cisco SD-WAN Manager menu, choose Administration > Settings > Network Statistics Configuration and Collection.

    Before Cisco Catalyst SD-WAN Manager Release 20.14.1, the Data Collection & Statistics tab was referred as Data Collection and found under Administration > Settings > Cloud Services.

    (For Cisco Catalyst SD-WAN Manager Release 20.12.x and earlier, locate the Data Collection option and click Edit.)

  2. In the Collection Interval field, you can set the frequency at which device statistics must be collected, such as interface statistics or application flow data. Enter a time (in minutes), which determines how frequently statistics are collected.

  3. Enable or disable the Additional Event Collection option.

    This option allows for the gathering of operational data from network devices, particularly Cisco IOS XE Catalyst SD-WAN devices, When enabled, it facilitates the collection of operational data triggered by network events like connectivity problems or network flaps. This feature can be enabled or disabled according to your needs.

  4. Click Save.

Enable or Disable Cloud Services

  1. From the Cisco SD-WAN Manager menu, choose Administration > Settings.

  2. Click Cloud Services.

    (For Cisco Catalyst SD-WAN Manager Release 20.12.x and earlier, locate Cloud Services and click Edit.)

  3. Enable or disable the Cloud Services option.

    (For Cisco Catalyst SD-WAN Manager Release 20.12.x and earlier, click Enabled.)

  4. When enabling, do one of the following to authenticate:

    • Cisco Catalyst SD-WAN Manager Release 20.12.1 and later, and Cisco vManage Release 20.9.4 and later releases of 20.9.x:

      Enter your smart account credentials: user ID and password.

    • Cisco vManage Release 20.11.x and earlier:

      1. Enter the OTP value. You can request the token from the Cisco CloudOps team by opening a Cisco TAC Support case.

      2. Leave the Cloud Gateway URL field blank.

      3. Approve permission to begin data collection and to upload the data to the cloud.

  5. Click Save.

Additional Steps to Enable Data Collection on an On-Premises Cisco Catalyst SD-WAN Manager Instance

Configure the local firewall to allow outbound communication from Cisco SD-WAN Manager (interface VPN 0) on port 443 to the destinations in the following table. Choose the appropriate set of destinations based on the geographic location of your Cisco SD-WAN Analytics instance.

Location Destinations
Americas

https://us-west.dcs.viptela.net (Cisco vManage 20.1.1 or earlier)

https://us01.datagateway.analytics.sdwan.cisco.com (Cisco vManage Release 20.3.1 or later)

https://datamanagement-us-01.sdwan.cisco.com (Cisco vManage Release 20.3.1 or later)

Americas (East)

https://us-east.dcs.viptela.net (Cisco vManage 20.1.1 or earlier)

https://us02.datagateway.analytics.sdwan.cisco.com (Cisco vManage Release 20.3.1 or later)

https://datamanagement-us-01.sdwan.cisco.com (Cisco vManage Release 20.3.1 or later)

Europe

https://europe.dcs.viptela.net (Cisco vManage 20.1.1 or earlier)

https://eu01.datagateway.analytics.sdwan.cisco.com (Cisco vManage Release 20.3.1 or later)

https://datamanagement-us-01.sdwan.cisco.com (Cisco vManage Release 20.3.1 or later)

Australia

https://au01.datagateway.analytics.sdwan.cisco.com (Cisco vManage Release 20.3.1 or later)

https://datamanagement-us-01.sdwan.cisco.com (Cisco vManage Release 20.3.1 or later)

You can use the cURL -k command from your Cisco SD-WAN Manager CLI to verify reachability to these destinations.

Rediscover Network

Use the Rediscover Network window to locate new devices in the overlay network and synchronize them with Cisco SD-WAN Manager.

  1. From the Cisco SD-WAN Manager menu, choose Tools > Rediscover Network.

  2. Choose a device or devices by checking the check box next to the device model. To find the device you are looking for scroll through the device table. Alternatively, choose a device group from the Device Groups drop-down list to see devices that belong to a specific device group.

  3. To confirm resynchronization of the device data, click Rediscover.

  4. In the Rediscover Network dialog box, click Rediscover.

View Routing Information

  1. From the Cisco SD-WAN Manager menu, choose Monitor > Devices.

    Cisco vManage Release 20.6.x and earlier: From the Cisco SD-WAN Manager menu, choose Monitor > Network.

  2. Choose a device from the list of devices that appears.

  3. Click Real Time in the left pane.

  4. Click Device Options, and choose one of the following commands as relevant:

Device Options

Command

Description

IP Routes

show ip routes

show ipv6 routes

Displays information about the IP route table entries.

Displays the IPv6 entries in the local route table.

IP FIB

show ip fib

show ipv6 fib

Displays information about forwarding table entries.

Display the IPv6 entries in the local forwarding table.

IP MFIB Summary

show ip mfib summary

Displays information about a summary of active entries in the multicast FIB.

IP MFIB OIL

show ip mfib oil

Displays information about outgoing Interfaces from the multicast FIB.

IP MFIB Statistics

show ip mfib stats

Displays information about statistics for active entries in the multicast FIB.

OMP Peers

show omp peers

Displays OMP peers and their peering sessions.

OMP Summary

show omp ​summary

Displays information about the OMP sessions running between Cisco SD-WAN Controller and the routers.

OMP Received Routes or OMP Advertised Routes

show omp ​routes

show sdwan omp routes

Displays OMP routes.

From Cisco vManage Release 20.11.1, you can download OMP route details in JSON or CSV formats for Cisco IOS XE Catalyst SD-WAN devices.

OMP Received TLOCs or OMP Advertised TLOCs

show omp ​tlocs

Displays OMP TLOCs.

OSPF Interfaces

show ospf interface

Displays information about the Interfaces running OSPF.

OSPF Neighbors

show ospf neighbor

Displays information about the OSPF neighbors.

OSPF Routes

show ospf routes

Displays routes learned from OSPF.

OSPF Database Summary

show ospf database-summary

Displays a summary of the OSPF link-state database entries.

OSPF Database

show ospf database

Displays information about the OSPF link-state database entries.

OSPF External Database

Not applicable

Display OSPF external routes. External routes are OSPF routes that are not within the OSPF AS (domain).

OSPF Processes

show ospf process

Display the OSPF processes.

PIM Interfaces

show pim interface

Displays information about interfaces running PIM.

PIM Neighbors

show pim neighbor

Displays information about PIM neighbors.

PIM Statistics

show pim statistics

Displays information about PIM-related statistics.

Interface Detail

show ipv6 interface

Displays information about IPv6 interfaces on Cisco Cisco IOS XE Catalyst SD-WAN devices.

From Cisco vManage Release 20.6.1, this device option is available on all Cisco IOS XE Catalyst SD-WAN devices and Cisco vEdge devices.

View Multicast Information

  1. From the Cisco SD-WAN Manager menu, choose Monitor > Devices.

    Cisco vManage Release 20.6.x and earlier: From the Cisco SD-WAN Manager menu, choose Monitor > Network.

  2. Choose a device from the list of devices that displays.

  3. Click Real Time in the left pane.

  4. From the Device Options drop-down list, choose one of the following commands as relevant:

Device Option

Command

Description

Multicast Topology

show multicast topology

View topology information about the Multicast Domain

OMP Multicast Advertised Autodiscover or OMP Multicast Received Autodiscover

show omp multicast multicast-auto-discover

View peers that support Multicast

Multicast Tunnels

show multicast tunnel

View information about IPsec tunnels between Multicast peers

Multicast RPF

show multicast rpf

View Multicast reverse-path forwarding information

Multicast Replicator

show multicast replicator

View Multicast replicators

OMP Multicast Advertised Routes or OMP Multicast Received Routes

show omp multicast-routes

View Multicast routes that OMP has learned from PIM join messages

View Data Policies

A centralized data policy is configured and applied on Cisco SD-WAN Controllers, and is then carried in OMP updates to the edge devices in the site-list that the policy is applied to. Centralized data policy examines fields in the headers of data packets, looking at the source and destination addresses and ports, and the protocol and DSCP values, and for matching packets, it modifies the next hop in a variety of ways or applies a policer to the packets. The policy match operation and any resultant actions are performed on the router as it transmits or receives data traffic.

Localized data policy, also called access lists (ACLs), is configured directly on a local router and affects data traffic being transmitted between the routers on the Cisco Catalyst SD-WAN overlay network.

To view ACL information on a router, do the following:

  1. From the Cisco SD-WAN Manager menu, choose Monitor > Devices.

    Cisco vManage Release 20.6.x and earlier: From the Cisco SD-WAN Manager menu, choose Monitor > Network.

  2. Choose a device from the list of devices that appears.

  3. Click Real Time in the left pane.

  4. Click Device Options, and choose one of the following commands:

Command

Description

show policy access-list-names

View names of configured ACLs

show policy access-list-associations

View Interfaces to which ACLs are applied

show policy access-list-associations

View count of packets affected by ACLs

View Cisco Catalyst SD-WAN Controller Policy

To view policy information from Cisco Catalyst SD-WAN Controller on a device, perform the following steps:

  1. From the Cisco SD-WAN Manager menu, choose Monitor > Devices.

    Cisco vManage Release 20.6.x and earlier: From the Cisco SD-WAN Manager menu, choose Monitor > Network.

  2. Choose a device from the list of devices that appears.

  3. Click Real Time in the left pane.

  4. Click Device Options, and choose one of the following commands:

Device Option

Command

Description

Policy from vSmart

show policy from-vsmart

show sdwan policy from-vsmart

Displays a centralized data policy, an application-aware policy, or a cflowd policy that a Cisco Catalyst SD-WAN Controller has pushed to the Edge devices.

View Policy Zone-Based Firewall

To view policy information about zone-based firewalls on a device, perform the following steps:

  1. From the Cisco SD-WAN Manager menu, choose Monitor > Devices.

    Cisco vManage Release 20.6.x and earlier: From the Cisco SD-WAN Manager menu, choose Monitor > Network.

  2. Choose a device from the list of devices that appears.

  3. Click Real Time in the left pane.

  4. Click Device Options, and choose one of the following commands as relevant:

Device Option

CLI Command

Description

Policy Zone Based Firewall Statistics

show policy zbfw filter-statistics

Displays a count of the packets that match a zone-based firewall's match criteria and the number of bytes that match the criteria.

Policy Zone Pair Sessions

show policy zbfw sessions

Displays the session flow information for all zone pairs that are configured with a zone- based firewall policy.

BFD Protocol

The Role of BFD in Cisco Catalyst SD-WAN Solution

The BFD protocol detects links failures between routers. It measures data loss and latency on the data tunnel to determine the status of the devices at either end of the connection.

For data plane resiliency, the Cisco Catalyst SD-WAN software implements the BFD protocol, which runs automatically on the secure IPsec and GRE connections between routers. These connections are used for the data plane, and for data traffic, and are independent of the DTLS tunnels used by the control plane.

BFD is enabled by default on all connections between Cisco vEdge devices. You cannot disable BFD. However, you can adjust the Hello packet and dead time intervals. If the timers on the two ends of a BFD link are different, BFD negotiates to use the lower value. See Configure BFD using Cisco SD-WAN Manager for information on configuring BFD for application-aware routing and configuring BFD on transport tunnels.

How BFD Works

After a Cisco vEdge device comes up and control connections are established, the Cisco Catalyst SD-WAN Controller advertises peer TLOC information to the Cisco vEdge device. Based on this TLOC information and other configuration, Cisco vEdge devices establish BFD sessions with all or some of the peer TLOCs.

BFD sends Hello packets periodically (by default, every 1 second) to determine whether the session is still operational. If a certain number of the Hello packets are not received, BFD considers that the link has failed and brings the BFD session down (the default multiplier time is 7 seconds). When BFD sessions goes down, any route that points to a next hop over that IPsec tunnel is removed from the forwarding table (FIB), but it is still present in the route table (RIB).

Interpret BFD States to Troubleshoot Connection Loss Between TLOCs

If a BFD session is down, it implies that no traffic can flow between those tlocs. If you identify any traffic disruption between a pair of TLOCs or notice that the session flap count has increased, use the show bfd sessions or the show bfd history commands to check the status of your BFD sessions. These commands help you understand whether all the BFD sessions that should have been established, have indeed been established.

BFD sessions have three valid states: Down, Init, and Up.

  • Down: Non-operational connections with other Cisco vEdge devices in the network.

  • Init: Connections that are reachable but not up yet.

  • Up: Operational connections with other Cisco vEdge devices in the network.

Each device sends an echo-request to its peer and also an echo-response for the request it receives. In the echo response, the device sends its current BFD state. Based on this, the peer changes its BFD state if required.

For information on BFD alarms generated by Cisco SD-WAN Manager, see the Permanent Alarms and Alarm Fields.

Changes in Session States Based on Echo Response from Peers

The following table shows how the BFD session states on a device change based on the session states that the peer responds with.

BFD Session State on Device BFD State sent by Peer in Echo Response BFD Status Change on Device
Up Up or Init Up (no change)
Up Down Down
Init Up or Init Up
Init Down Init (no change)
Down Down Init
Down Init Up
Down Up Down (no change)

View BFD Session Information

Bidirectional Forwarding Detection (BFD) sessions between routers start automatically when the devices come up in the network. BFD which runs on secure IPsec connections between the routers, is used to detect connection failures between the routers.

To view BFD information for a router:

  1. From the Cisco SD-WAN Manager menu, choose Monitor > Devices.

    Cisco vManage Release 20.6.x and earlier: From the Cisco SD-WAN Manager menu, choose Monitor > Network.

  2. Choose a device from the list of devices that displays.

  3. Click Real Time in the left pane.

  4. From the Device Options drop-down list, choose one of the following commands as relevant:

    • BFD Sessions (to view real-time BFD sessions)

    • BFD History (to view BFD session history)

View BGP Information

You can configure the Border Gateway Protocol (BGP) on routers to enable routing on the service side (site-local side) of the device, thus providing reachability to networks at the devices' local sites.

To view BGP information on a router:

  1. From the Cisco SD-WAN Manager menu, choose Monitor > Devices.

    Cisco vManage Release 20.6.x and earlier: From the Cisco SD-WAN Manager menu, choose Monitor > Network.

  2. Choose a device from the list of devices that displays.

  3. Click Real Time in the left pane.

  4. From the Device Options drop-down list, choose one of the following commands as relevant:

    Option

    Description

    BGP Summary (show bgp summary

    View BGP connection status.

    BGP Neigbors (show bgp neighbor )

    View BGP neighbors.

    BGP Routes (show bgp routes )

    View routes learned by BGP.

View Cflowd Information

Cflowd monitors traffic flowing through routers in the overlay network and exports flow information to a collector, where it can be processed by an IPFIX analyzer. For a traffic flow, Cflowd periodically sends template reports to a flow collector. These reports contain information about the flow and data extracted from the IP headers of the packets in the flow.

To configure Cflowd in a router, use centralized data policy to define a Cflowd template that specifies the location of a Cflowd collector and timers that control the flow collection.

To view Cflowd flow information for a router:

  1. From the Cisco SD-WAN Manager menu, choose Monitor > Devices.

    Cisco vManage Release 20.6.x and earlier: From the Cisco SD-WAN Manager menu, choose Monitor > Network.

  2. Choose a device from the list of devices displayed.

  3. Click Real Time in the left pane.

  4. From the Device Options drop-down list, choose one of the following commands or options, as relevant:

    Option

    Description

    Cflowd Template (show app cflowd template )

    View the Cflowd template.

    Device option is displayed on Cisco vEdge devices.

    Cflowd Collector (show app cflowd collector )

    View Cflowd Collector information.

    Device option is displayed on Cisco vEdge devices.

    Cflowd Flows (show app cflowd flows , show app cflowd flow-count )

    View Cflowd flows.

    Device option is displayed on Cisco vEdge devices.

    Cflowd Statistics (show app cflowd statistics )

    View Cflowd statistics.

    Device option is displayed on Cisco vEdge devices.

    cFlowd Flows/DPI (show cflowd flows )

    View Cflowd traffic flow information and SAIE flow information.

    From Cisco IOS XE Catalyst SD-WAN Release 17.10.1a and Cisco vManage Release 20.10.1, the cFlowd Flows/DPI field is added for applying filters for monitoring specific SAIE applications or application families running within a VPN on the selected Cisco IOS XE Catalyst SD-WAN device.

    Device option is displayed on Cisco IOS XE Catalyst SD-WAN devices.

    cFlowd ipv6 Flows/DPI (show cflowd flows )

    View Cflowd IPv6 traffic flow information and SAIE flows.

    From Cisco IOS XE Catalyst SD-WAN Release 17.10.1a and Cisco vManage Release 20.10.1, the cFlowd ipv6 Flows/DPI field is added for applying filters for monitoring specific SAIE applications or application families running within a VPN on the selected Cisco IOS XE Catalyst SD-WAN device.

    Device option is displayed on Cisco IOS XE Catalyst SD-WAN devices.

View Cloud Express Information

To view Cloud Express information on a device, perform the following steps:

  1. From the Cisco SD-WAN Manager menu, choose Monitor > Devices.

    Cisco vManage Release 20.6.x and earlier: From the Cisco SD-WAN Manager menu, choose Monitor > Network.

  2. Choose a device from the list of devices that is displayed.

  3. Click Real Time in the left pane.

  4. From the Device Options drop-down list, choose one of the following commands:

Device Option

Command

Description

Cloud Express Applications

show sdwan cloudexpress applications

Displays the best path that Cloud onRamp for SaaS has selected for each configured SaaS application on Cisco IOS XE Catalyst SD-WAN devices.

Cloud Express Gateway Exits

show sdwan cloudexpress gateway-exits

Displays the Quality of Experience (QoE) measurements received from gateway sites, for Cloud onRamp for SaaS on Cisco IOS XE Catalyst SD-WAN devices.

Cloud Express Local Exits

show sdwan cloudexpress local-exits

Displays the list of applications enabled for Cloud onRamp for SaaS probing on Cisco IOS XE Catalyst SD-WAN devices, and the interfaces on which the probing occurs.

View ARP Table Entries

The Address Resolution Protocol (ARP) is used to resolve network layer addresses, such as IPv4 addresses) into link layer addresses (such as Ethernet, or MAC, addresses). The mappings between network and physical addresses are stored in an ARP table.

To view the entries in the ARP table:

  1. From the Cisco SD-WAN Manager menu, choose Monitor > Devices.

    Cisco vManage Release 20.6.x and earlier: From the Cisco SD-WAN Manager menu, choose Monitor > Network.

  2. Choose a device from the list of devices that displays.

  3. Click Real Time in the left pane.

  4. From the Device Options drop-down list in the right pane, choose ARP.

CLI equivalent: show arp

Run Site-to-Site Speed Test

Before You Begin

Ensure that Data Stream is enabled under Administration > Settings in Cisco SD-WAN Manager.

  1. From the Cisco SD-WAN Manager menu, choose Monitor > Devices.

    Cisco vManage Release 20.6.1 and earlier: From the Cisco SD-WAN Manager menu, choose Monitor > Network.

  2. To choose a device, click the device name in the Hostname column.

  3. Click Troubleshooting in the left pane.

  4. In the Connectivity area, click Speed Test.

  5. Specify the following:

    • Source Circuit: From the drop-down list, choose the color of the tunnel interface on the local device.

    • Destination Device: From the drop-down list, choose the remote device by its device name and system IP address.

    • Destination Circuit: From the drop-down list, choose the color of the tunnel interface on the remote device.

  6. Click Start Test.

    The speed test sends a single packet from the source to the destination and receives the acknowledgment from the destination.

The right pane shows the results of the speed test—circuit speed, download speed, and upload speed between the source and destination. The download speed shows the speed from the destination to the source, and the upload speed shows the speed from the source to the destination in Mbps. The configured downstream and upstream bandwidths for the circuit are also displayed.

When a speed test completes, the test results are added to the table in the lower part of the right pane.

From Cisco vManage Release 20.10.1, the Speed Test option is also accessible as follows:

  • On the Monitor > Devices page, click … adjacent to the device name and choose Speed Test.

  • On the Monitor > Applications page, click … adjacent to the application name and choose Speed Test.

  • On the Site Topology page, click a device name, and then click Speed Test in the right navigation pane.

View NMS Server Status

  1. From the Cisco SD-WAN Manager menu, choose Monitor > Devices.

    Cisco vManage Release 20.6.x and earlier: From the Cisco SD-WAN Manager menu, choose Monitor > Network.

  2. Choose a Cisco SD-WAN Manager device from the list of devices that is displayed.

  3. Click Real Time in the left pane.

  4. From the Device Options drop-down list, choose NMS Server Running.

Device Option

Command

Description

NMS Server Running

show nms-server running

Displays whether a Cisco SD-WAN Manager NMS server is operational.

This device option is available from Cisco vManage Release 20.6.1.

View Cisco Catalyst SD-WAN Validator Information

  1. From the Cisco SD-WAN Manager menu, choose Monitor > Devices.

    Cisco vManage Release 20.6.x and earlier: From the Cisco SD-WAN Manager menu, choose Monitor > Network.

  2. Choose a device from the list of devices that is displayed.

  3. Click Real Time in the left pane.

  4. From the Device Options drop-down list, choose one of the following commands:

Device Option

CLI Command

Description

Orchestrator Reverse Proxy Mapping

show orchestrator reverse-proxy-mapping

Displays the proxy IP addresses and port numbers that are configured for use by reverse proxy.

Orchestrator Statistics

show orchestrator statistics

Displays statistics about the packets that a Cisco Catalyst SD-WAN Validator has transmitted and received in the process of establishing and maintaining secure DTLS connections to a Cisco IOS XE Catalyst SD-WAN devices in the overlay network.

Orchestrator Valid vManage ID

show orchestrator valid-vmanage-id

Lists the chassis numbers of the valid Cisco SD-WAN Manager instance in the overlay network.

Run a Traceroute

  1. From the Cisco SD-WAN Manager menu, choose Monitor > Devices.

    Cisco vManage Release 20.6.1 and earlier: From the Cisco SD-WAN Manager menu, choose Monitor > Network.

  2. To choose a device, click the device name in the Hostname column.

  3. Click Troubleshooting in the left pane.

  4. In the Connectivity area, click Trace Route.

  5. In the Destination IP field, enter the IP address of the corresponding device in the network.

    For releases before Cisco Catalyst SD-WAN Manager Release 20.13.1, enter an IPv4 address. From Cisco Catalyst SD-WAN Manager Release 20.13.1, enter an IPv4 or IPv6 address.

  6. From the VPN drop-down list, choose a VPN to use to reach the device.

  7. From the Source/Interface for VPN drop-down list, choose the interface to use to send the traceroute probe packets.

  8. Click Advanced Options.

  9. In the Size field, enter the size of the traceroute probe packets, in bytes.

  10. Click Start to trigger a traceroute to the requested destination.

The lower part of the right pane displays the following information:

  • Raw output of the path the traceroute probe packets take to reach the destination.

  • Graphical depiction of the path the traceroute probe packets take to reach the destination.

If the traceroute is for the service-side traffic, a Cisco vEdge device generates traceroute responses from any of the interfaces on the service VPN.

From Cisco vManage Release 20.10.1, the Trace Route option can be accessed using one of these methods:

  • Choose Monitor > Devices, click … adjacent to the device name, and choose Trace Route.

  • In the Site Topology page, click a device or tunnel name, and then click Trace Route in the right navigation pane.

View Tunnel Loss Statistics

View Data Plane Tunnel Loss Statistics

  1. From the Cisco SD-WAN Manager menu, choose Monitor > Devices.

    Cisco vManage Release 20.6.x and earlier: From the Cisco SD-WAN Manager menu, choose Monitor > Network.

  2. Choose a device from the list of devices that displays.

  3. Click Real Time in the left pane.

  4. From the Device Options drop-down list, choose Tunnel Statistics.

View Traffic Loss for Application-Aware Routing

  1. From the Cisco SD-WAN Manager menu, choose Monitor > Overview.

    Cisco vManage Release 20.6.x and earlier: From the Cisco SD-WAN Manager menu, choose Dashboard > Main Dashboard.

  2. Scroll down to the Application-Aware Routing pane.

You can also use the show app-route statistics command to view traffic loss for application-aware routing.

View SAIE Flows

  1. From the Cisco SD-WAN Manager menu, choose Monitor > Devices.

    Cisco vManage Release 20.6.1 and earlier: From the Cisco SD-WAN Manager menu, choose Monitor > Network.

    Starting from Cisco vManage Release 20.6.1, to view the detailed SD-WAN Application Intelligence Engine (SAIE) flow information such as source IP address, destination IP address, and port details, you need to add the devices to the on-demand troubleshooting list. Add the device to the on-demand troubleshooting list from Tools > On Demand Troubleshooting.


    Note


    • In Cisco vManage Release 20.6.1 and earlier releases, On Demand Troubleshooting is part of the Monitor menu.

    • In Cisco vManage Release 20.7.1 and earlier releases, the SAIE flow is called the deep packet inspection (DPI) flow.

    • Ensure that no Cisco or third-party APIs that instruct on-demand troubleshooting to stop are called. These APIs prevent on-demand troubleshooting from compiling information.


    To enhance the application visibility, the data collection process on the device generates aggregated application statistics usage data, which in turn reduces the size of the statistics data files that are processed by default on the management plane. This enhancement allows Cisco SD-WAN Manager to collect SAIE data efficiently and reduce the processing time of the management plane.

  2. Under Applications in the left pane, click SAIE Applications. The right pane displays SAIE flow information for the device.


    Note


    • When displaying the SAIE flow usage, peak usage is shown to be higher from one time interval than for another for the same time period. This situation occurs because the data is not yet available from the statistics database to display in Cisco SD-WAN Manager. Cisco SD-WAN Manager displays only available data and then plots that data in the appropriate axis.

    • In Cisco vManage Release 20.7.1 and earlier releases, SAIE Applications is called DPI Applications.


The upper part of the right pane contains:

  • Filter option: Click the Filter option to view a drop-down menu to choose the desired VPN and Local TLOC.

    Starting from Cisco Catalyst SD-WAN Manager Release 20.14.1, in Traffic Source, you can choose LAN traffic, remote access traffic, or both the options to view the traffic data.

    Click Search. Click a predefined or custom time period for which to view the data.


    Note


    Filtering Local TLOC : Dia is supported only for Cisco vEdge devices.


  • SAIE flow information in graphical format.

  • SAIE flow graph legend—Select an application family to display information for just that flow. Click the Total Network Traffic check box to display flow information as a proportion of total network traffic.

The lower part of the right pane contains:

  • Filter criteria.

  • SAIE flow information table that lists all application families sorted by usage. By default, the top six application families are selected. The graphical display in the upper part of the right pane plots the flow and usage of the selected application families.

    • Click the check box on the left to select or deselect application families. You can choose to view information for a maximum of six application families at one time.

    • Click an application family to view applications within the family.

    • Click an application to view the source IP addresses of the devices accessing the application. The Traffic per TLOC pie chart next to the graph displays traffic distribution per TLOC (color).

    • To re-arrange the columns, drag the column title to the desired position.

View VNF Status

Reviewing VNF status can help you to determine which VNF to use when you are designing a network service.

  1. From the Cisco SD-WAN Manager menu, choose Monitor > Devices.

    Cisco vManage Release 20.6.x and earlier: From the Cisco SD-WAN Manager menu, choose Monitor > Network.

  2. Choose a CSP device from the table.

  3. From the left pane, click VNF Status.

  4. In the table, click the VNF name. The right pane displays information about the specific VNF. You can click the network utilization, CPU utilization, memory utilization, disk utilization to monitor the resources utilization of a VNF.

    The primary part of the right pane contains:

    • Chart Options bar that includes the following options:

      • Chart Options drop-down—Click Chart Options to select the type of data to display.

      • Time periods—Click either a predefined time period, or a custom time period for which to display data.

    • VNF information in graphical format.

    • VNF graph legend—Select a VNF to display information for just that VNF.

The detailed part of the right pane contains:

  • Filter criteria

  • VNF table that lists information about all VNFs. By default, the first six VNFs are selected. The graphical display in the upper part of the right pane plots information for the selected VNFs.

    • Check or uncheck the check box at the left to select and deselect VNFs. You can select and display information for a maximum of six VNFs at one time.

    • To change the sort order of a column, click the column title.

View TCP Optimization Information

View WAN Throughput

If TCP optimization is enabled on a router, you can view information about how the optimization affects the processing and throughput of TCP data traffic on the router:

  1. From the Cisco SD-WAN Manager menu, choose Monitor > Devices.

    Cisco vManage Release 20.6.x and earlier: From the Cisco SD-WAN Manager menu, choose Monitor > Network.

  2. Choose a device from the list of devices that displays.

  3. In the left pane, click WAN Throughput. The right pane displays the WAN throughput, in megabits per second.

The upper part of the right pane contains the following elements:

  • Chart Options bar—Located directly under the device name, this bar includes the Filter Options drop-down and time periods. Click Filter to limit the data to display based on VPN, local TLOC color, destination IP address, remote TLOC color, and remote system IP address. Click a predefined or custom time period for which to display data.

  • Average optimized throughput information in graphical format.

  • WAN graph legend—Identifies non-optimized and TCP optimized packet throughput.

The lower part of the right pane shows the hourly average throughput and the total optimized throughput, both in megabits per second.

Click TCP Optimization–Connections in the left pane to view status information about all the tunnels over which the most TCP-optimized traffic is flowing. The upper part of the right pane contains the following elements:

  • TCP Optimization Connections in graphical format.

  • Connection State boxes—Select the connection state or states to view TCP optimization information.

The lower part of the right pane contains the following elements:

  • Filter criteria.

  • Flow table that lists information about each of the tunnels, including the tunnel's connection state.

View TCP-Optimized Flows for Cisco vEdge Devices

To view information about TCP-optimized flows on a Cisco vEdge device:

  1. From the Cisco SD-WAN Manager menu, choose Monitor > Devices.

    Cisco vManage Release 20.6.x and earlier: From the Cisco SD-WAN Manager menu, choose Monitor > Network.

  2. Choose a device from the list of devices that is displayed.

  3. Click Real Time in the left pane.

  4. Click Device Options, and choose one of the following commands:


Note


The following options are available when you choose a Cisco vEdge device.


Device Option

Command

Description

TCP Optimization Active Flows

show app tcp-opt

Displays information about active TCP-optimized flows.

TCP Optimization Expired Flows

show app tcp-opt

Displays information about expired TCP-optimized flows.

TCP Optimization Summary

show app tcp-opt

Displays a summary of the TCP-optimized flows.

View SFP Information

To view SFP information on a router, perform the following steps:

  1. From the Cisco SD-WAN Manager menu, choose Monitor > Devices.

    Cisco vManage Release 20.6.x and earlier: From the Cisco SD-WAN Manager menu, choose Monitor > Network.

  2. Choose a device from the list of devices that is displayed.

  3. Click Real Time in the left pane.

  4. Click Device Options, and choose one of the following commands:

Device Option

Command

Description

SFP Detail

show interface sfp detail

Displays detailed SFP status and digital diagnostic information.

SFP Diagnostic

show interface sfp detail

Displays SFP digital diagnostic information.

SFP Measurement Value

show interface sfp detail

Displays SFP measurement data.

SFP Measurement Alarm

show interface sfp detail

Displays SFP alarm information for the measurements.

Monitor NAT DIA Tracker Configuration on IPv4 Interfaces

Minimum supported release: Cisco IOS XE Catalyst SD-WAN Release 17.7.1a and Cisco vManage Release 20.7.1

View Interface DIA Tracker

To view information about DIA tracker on a transport interface:

  1. From the Cisco SD-WAN Manager menu, choose Monitor > Devices.

    Cisco vManage Release 20.6.x and earlier: From the Cisco SD-WAN Manager menu, choose Monitor > Network.

  2. Choose a device from the list of devices.

  3. Click Real Time.

  4. For single endpoint tracker, from the Device Options drop-down list, choose Endpoint Tracker Info.

  5. For dual endpoint tracker, from the Device Options drop-down list, choose Endpoint Tracker Group Info.

View TLOC Loss, Latency, and Jitter Information

  1. From the Cisco SD-WAN Manager menu, choose Monitor > Devices.

    Cisco vManage Release 20.6.x and earlier: From the Cisco SD-WAN Manager menu, choose Monitor > Network.

  2. Choose a device from the list of devices that is displayed.

  3. In the left pane, click TLOC under the WAN area. The right pane displays the aggregated average loss or latency/jitter information for all TLOC colors.

The upper part of the right pane contains the following elements:

  • Chart Options— Includes the Chart Options drop-down and time periods. Click Chart Options to select the type of data to view. Click a predefined or custom time period for which to view data.

  • TLOC information in graphical format. The time interval in the graph is determined by the value of the BFD application-aware routing poll interval .

  • TLOC graph legend—Choose a TLOC color to display information for just that TLOC.

The lower part of the right pane contains the following elements:

  • Search box—Includes the Search Options filter.

  • TLOC color table that lists average jitter, loss, and latency data about all TLOCs. By default, the first six colors are selected. The graphical display in the upper part of the right pane plots information for the selected interfaces.

    • Check the check box to the left to select and deselect TLOC colors. You can select and view information for a maximum of 30 TLOCs at one time.

    • Click Application Usage to the right to view the SD-WAN Application Intelligence Engine (SAIE) flow information for that TLOC.


      Note


      • Beginning with Cisco vManage Release 20.8.1, the Application Usage column and the Application Usage links are removed from the Monitor > Devices > WAN – Tunnel window. After you have configured on-demand troubleshooting for a device, you can view SAIE usage data based on the selected filters or based on application families sorted by usage.

      • In Cisco vManage Release 20.7.x and earlier releases, the SD-WAN Application Intelligence Engine (SAIE) flow is called the deep packet inspection (DPI) flow.

      For more information on configuring on-demand troubleshooting, see On-Demand Troubleshooting. For more information on viewing SAIE flows, see View SAIE Flows.


View Tunnel Connections

To view details about the top 100 data plane tunnels between Cisco Catalyst SD-WAN devices with the lowest average latency, do the following:

  1. From the Cisco SD-WAN Manager menu, choose Monitor > Tunnels.

    The Tunnels table lists the following information about all tunnel end points:

    • Health

    • State

    • Quality of Experience (QoE) score. The QoE score rates the quality of experience of an application that a network can deliver for a period of time.

    • Local IP and remote IP

    • Average latency, loss, and jitter data

    The health of a tunnel is defined based on the following criteria:

    • Good: If the QOE score is between 8 and 10, and the tunnel status is 1/1.

    • Fair: If the QOE score is between 5 and 7, and the tunnel status is 1/1.

    • Poor: If the QOE score is between 1 and 4, or the tunnel status is 0/1.


Note


The tunnel information is available in Cisco SD-WAN Manager as a separate menu starting from Cisco vManage Release 20.7.1.

To view tunnel connections of a specific device, do the following:

  1. From the Cisco SD-WAN Manager menu, choose Monitor > Devices.

    Cisco vManage Release 20.6.x and earlier: From the Cisco SD-WAN Manager menu, choose Monitor > Network.

  2. Choose a device from the list of devices that is displayed.

  3. In the left pane, click TLOC under the WAN area. The right pane displays information about all tunnel connections.

  4. (Optional) Click the Chart Options drop-down list to choose the type of data to view.

    You can also choose a predefined time period or a custom time period to sort the data.
  5. (Optional) In the lower part of the right pane, use the filter option in the search bar to customize the table fields you want to view.

    The tunnel table lists average latency, loss, and jitter data about all tunnel end points. By default, the first six tunnels are selected. The graphical display in the upper part of the right pane plots information for the selected tunnels.

  6. (Optional) Click the check box to the left to select and deselect tunnels. You can select and view information for a maximum of 30 tunnels at one time.

  7. (Optional) Click Application Usage to the right to view the SD-WAN Application Intelligence Engine (SAIE) flow information for that TLOC.


    Note


    • Beginning with Cisco vManage Release 20.8.1, the Application Usage column and the Application Usage links are removed from the Monitor > Devices > WAN – Tunnel window. After you have configured on-demand troubleshooting for a device, you can view SAIE usage data based on the selected filters or based on application families sorted by usage.

    • In Cisco vManage Release 20.7.x and earlier releases, the SAIE flow is called the deep packet inspection (DPI) flow.

    For more information on configuring on-demand troubleshooting, see On-Demand Troubleshooting. For more information on viewing SAIE flows, see View SAIE Flows.


View IPSec Tunnel Information

To view IPSec tunnel information on a device, perform the following steps:

  1. From the Cisco SD-WAN Manager menu, choose Monitor > Devices.

    Cisco vManage Release 20.6.x and earlier: From the Cisco SD-WAN Manager menu, choose Monitor > Network.

  2. Choose a device from the list of devices that is displayed.

  3. Click Real Time in the left pane.

  4. Click Device Options, and choose one of the following commands:

Device Option

CLI Command

Description

IPsec Inbound Connections

show tunnel inbound-connections

Displays information about the IPsec tunnel connections that originate on the local router, showing the TLOC addresses for both ends of the tunnel.

IPsec Local SAs

show tunnel local-sa

Displays the IPsec tunnel security associations for the local TLOCs.

View Tunnel Health in Table View

Minimum supported release: Cisco vManage Release 20.10.1

In the Monitor Tunnels window the table shows information about the health of tunnels created in the last hour, displaying a maximum of 10,000 tunnels.

The tunnel information includes the following:

  • Tunnel health

  • State

  • Quality of Experience (QoE)

  • Average latency

  • Average loss

  • Average jitter

  • Local IP address

  • Remote IP address

You can also view the tunnel health on a single site by clicking All Sites and selecting the site ID to enter the single site view.

Tunnel Health Metrics

The average health metric of tunnels is calculated as follows:

Health

QoE

Status

Evaluation Logic

Good

QoE >= 8

UP

All attributes met

Fair

5 <= QoE < 8

UP

All attributes met

Poor

0 < QoE< 5

DOWN

Any attributes met

View Tunnel Health in Heatmap View

Minimum supported release: Cisco vManage Release 20.10.1

In the heatmap view, a grid of colored squares displays the tunnel health as Good, Fair, or Poor. You can hover over a square or click to display additional details of a tunnel at a specific time. Click the time interval drop-down list to change the time selection and filter the data for a specific interval.

You can view the tunnel health on a single site by clicking All Sites and selecting the site ID to enter the single site view.

View License Information

To view license information on a device, perform the following steps:

  1. From the Cisco SD-WAN Manager menu, choose Monitor > Devices.

    Cisco vManage Release 20.6.x and earlier: From the Cisco SD-WAN Manager menu, choose Monitor > Network.

  2. Choose a device from the list of devices that is displayed.

  3. Click Real Time in the left pane.

  4. Click Device Options, and choose one of the following commands:

Device Option

Command

Description

Smart License <info>

show licenses

Display the licenses for the software packages used by Cisco Catalyst SD-WAN.

View Logging Information

To view logging information on a device, perform the following steps:

  1. From the Cisco SD-WAN Manager menu, choose Monitor > Devices.

    Cisco vManage Release 20.6.x and earlier: From the Cisco SD-WAN Manager menu, choose Monitor > Network.

  2. Choose a device from the list of devices that is displayed.

  3. Click Real Time in the left pane.

  4. Click Device Options and choose the following command:

Device Option

Command

Description

Logging

show logging

Displays the settings for logging syslog messages.

View Loss Percentage, Latency, Jitter, and Octet Information for Tunnels

View the loss percentage, latency, jitter, and octets for tunnels in a single chart option in Cisco SD-WAN Manager.

Table 4. Feature History

Feature Name

Release Information

Description

View Loss Percentage, Latency, Jitter, and Octet Information for Tunnels

Cisco IOS XE Catalyst SD-WAN Release 17.5.1a

Cisco SD-WAN Release 20.5.1

Cisco vManage Release 20.5.1

This feature provides a single chart option in Cisco SD-WAN Manager for viewing tunnel information, such as packet loss, latency, jitter, and octets.

View Loss Percentage, Latency, Jitter, Octets, and Packet Duplication for Tunnels

You can choose the Real Time option or other time frames to view tunnel information in the graph.

To view loss percentage, latency, jitter, and octets in Cisco SD-WAN Manager:

  1. From the Cisco SD-WAN Manager menu, choose Monitor > Devices.

    Cisco vManage Release 20.6.x and earlier: From the Cisco SD-WAN Manager menu, choose Monitor > Network.

  2. Choose a device.

  3. In the left pane, click Tunnel under the WAN area. The right pane displays information about all tunnel connections.

  4. In the right pane, click Chart Options to choose the format in which you want to view the information.

    Click Loss Percentage/Latency/Jitter/Octets for troubleshooting tunnel information.

The upper part of the right pane contains the following elements:

  • Data for each tunnel is graphed based on time.

  • Legend for the graph—Choose a tunnel to view information for just that tunnel. Lines and data points for each tunnel are uniquely colored.

The lower part of the right pane contains the following elements:

  • Search bar—Includes the Search Options filter to filter the table based on a Contains or a Match criteria.

  • Tunnel Table—Lists the jitter, latency, loss percentage, and other data about all the tunnel end points. By default, the first six tunnels are selected. The graphical display in the upper part of the right pane plots information for the selected tunnels.

    • Click the column drop-down lists to enable or disable all of the descriptions.

    • Check the check box to the left to select and deselect tunnels. You can choose and view information for a maximum of six tunnels at one time.

View WiFi Configuration

To view WiFi configuration for Cisco Catalyst SD-WAN routers that support wireless LANs (WLANs), such as the Cisco vEdge device:

  1. From the Cisco SD-WAN Manager menu, choose Monitor > Devices.

    Cisco vManage Release 20.6.x and earlier: From the Cisco SD-WAN Manager menu, choose Monitor > Network.

  2. Choose a device.

  3. Click WiFi in the left pane. The right pane displays information about WiFi configuration on the router.

The upper part of the right pane contains the following elements:

  • AP Information bar—Located directly under the device name, it displays access point information and the Clients Details button. Click the Clients Details button to view information about clients connected to the WiFi access point during the selected time period.

  • Radio frequency parameters for access points.

  • SSID parameters for virtual access points (VAPs).

The lower part of the right pane contains the following elements:

  • VAP receive and transmit statistics bar—Includes the time periods. Click a predefined or custom time period for which to display data.

  • VAP receive and transmit statistics information in graphical format.

  • VAP statistics graph legend—Select a VAP interface to display information for just that interface. Click the VAP interface again to return to the previous display.

View Control Connections in Real Time

To display a real-time view the control plane connections on a Cisco vEdge device:

  1. From the Cisco SD-WAN Manager menu, choose Monitor > Devices.

    Cisco vManage Release 20.6.x and earlier: From the Cisco SD-WAN Manager menu, choose Monitor > Network.

  2. Choose a device.

  3. Click Troubleshooting in the left pane.

  4. Under the Connectivity area, click Control Connections (Live View).

The control plane connection screen is updated automatically, every 15 seconds.

The upper part of the right pane shows figures illustrates the operational control plane tunnels between the edge device, Cisco Catalyst SD-WAN, and Cisco SD-WAN Controller.

The lower part of the lower pane contains a table that shows details for each of the control plane tunnels, including the IP address of the remote device and the status of the tunnel end points, including the reason for the failure of an end point.

View Cisco Umbrella Information

To view Cisco Umbrella information on a device, perform the following steps:

  1. From the Cisco SD-WAN Manager menu, choose Monitor > Devices.

  2. Choose a device from the list of devices that is displayed.

  3. Click Real Time in the left pane.

  4. Click Device Options, and choose the following.

Device Option

Command

Description

Umbrella Device Registration

show umbrella deviceid

Displays Cisco Umbrella registration status for Cisco IOS XE Catalyst SD-WAN devices.

View VRRP Information

  1. From the Cisco SD-WAN Manager menu, choose Monitor > Devices.

    Cisco vManage Release 20.6.x and earlier: From the Cisco SD-WAN Manager menu, choose Monitor > Network.

  2. Choose a device.

  3. Click Real Time from the left pane.

  4. Click Device Options, and choose VRRP Information.

View PKI Trustpoint Information

Minimum Supported Release: Cisco IOS XE Catalyst SD-WAN Release 17.13.1a and Cisco Catalyst SD-WAN Control Components 20.13.1.

Use the View PKI Trustpoint tab to view PKI Trustpoint related information including the validity.

  1. From the Cisco SD-WAN Manager Menu, choose Monitor > Devices.

  2. Choose a device from the list of devices that appear.

  3. Click Real Time in the left pane.

  4. Click Device Options, and choose PKI Trustpoint.

    Option

    Description

    PKI Trustpoint

    View PKI Trustpoint related information.

View QoS Information

View QoS statistics to know which traffic classes experienced the greatest number of drops on which devices in your network.

Table 5. Feature History
Feature Name

Release Information

Description

QoS Monitoring in Cisco SD-WAN Manager

Cisco IOS XE Catalyst SD-WAN Release 17.2.1r

This release extends the capability of viewing interface-wise QoS information through Cisco SD-WAN Manager to support Cisco IOS XE Catalyst SD-WAN devices. Before this release, QoS information for Cisco IOS XE Catalyst SD-WAN devices could only be monitored through device CLI.

Note that this feature was already available for Cisco vEdge devices.

Limitations for QoS Monitoring

  • This feature is not supported for sub-interfaces.

  • This feature is not supported if per-tunnel QoS is enabled.

View QoS Information Chart

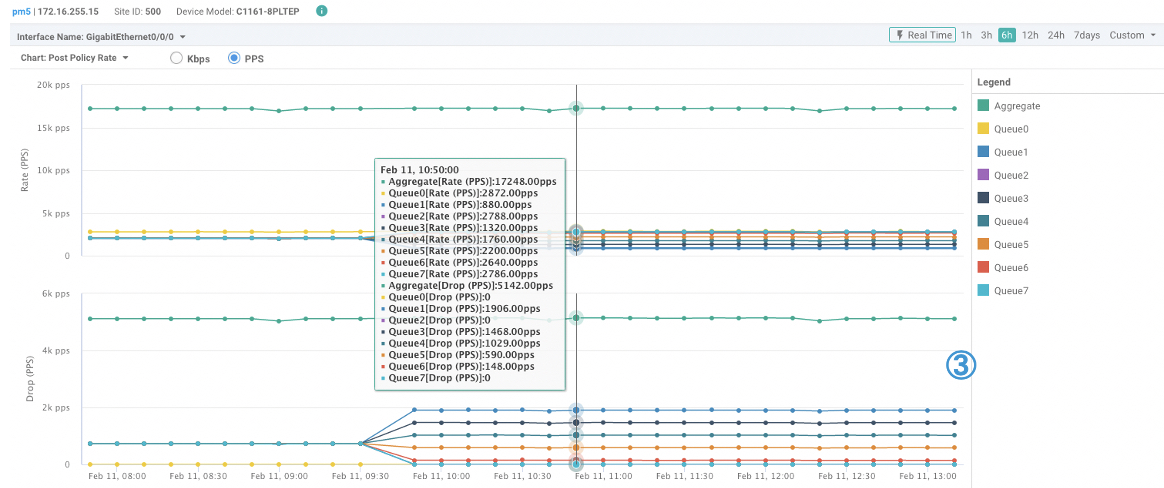
A QoS chart shows the packet speed and the number of packets dropped for each queue for the selected interface.

  1. From the Cisco SD-WAN Manager menu, choose Monitor > Devices.

    Cisco vManage Release 20.6.1 and earlier: From the Cisco SD-WAN Manager menu, choose Monitor > Network.

  2. Choose a device from the list of devices that appears.

  3. In the left pane, click QoS under the Applications area.

  4. The upper part of the right pane has the following options to choose from.

    • Interface Name: From the drop-down menu, choose the interface for which you want to view QoS data.

    • Time Range: : Choose to view the information for a specified time range—Real time, predefined time ranges (1h, 3h, 6h, and so on), or click Custom to define a time range.

      Real time QoS information can also be viewed in a tabular format. See the section View Real Time QoS Information Table.

  5. From the Chart drop-down list, choose one of the following.

    • Post Policy Rate: This option displays the speed at which data travels per second in either kbps (default) or in packets per second (PPS). This value is calculated to get the per second speed by using the formula: Post Policy Counter/10.

    OR

    • Post Policy Counter: This option displays the number of packets (or the number of packets in bytes) that have gone through the queue in the last 10 seconds.

    The QoS chart displays. The following example shows QoS data for a specified, historical time range for the selected interface. In this chart, each data point represents 10 minutes. For longer time ranges, Cisco SD-WAN Manager aggregates data points.

    Figure 1. QoS Chart

    Cisco SD-WAN Manager also displays a table below the chart. However, the table always displays historical data even if you choose the Real Time option to generate a chart. Such historical tables generated below real time charts have no connection with the real time values in the chart.

    The following example shows a table showing historical data that was generated below the real time QoS chart.

    Figure 2. Historical QoS Table

View Real Time QoS Information Table

To view real time QoS information in a tabular format, follow these steps:

  1. From the Cisco SD-WAN Manager menu, choose Monitor > Devices.

    Cisco vManage Release 20.6.1 and earlier: From the Cisco SD-WAN Manager menu, choose Monitor > Network.

  2. Choose a device from the list of devices that appears.

  3. In the left pane, click Real Time under the Security Monitoring area.

  4. From the Device Options drop-down list, choose Interface QoS Statistics.

    A table of QoS statistics appears. You can filter the table by interface name by choosing an interface from the Filter drop-down list.

View WLAN Output

Minimum Supported Release: Cisco IOS XE Catalyst SD-WAN Release 17.14.1a and Cisco Catalyst SD-WAN Manager Release 20.14.1

Use the Wireless SSID tab to view the WLAN output along with the VLAN ID assoicated.

  1. From the Cisco SD-WAN Manager menu, choose Monitor > Devices.

  2. Choose a Cisco IR1800 device from the list of devices.

  3. Click Real Time in the left pane.

  4. In the Device Options drop-down box, type Wireless SSID.

    Option

    Description

    Wireless SSID

    View the WLAN output.

View Client Details

Minimum Supported Release: Cisco IOS XE Catalyst SD-WAN Release 17.14.1a and Cisco Catalyst SD-WAN Manager Release 20.14.1

Use the Wireless Clients tab to view the client details along with their MAC addresses.

  1. From the Cisco SD-WAN Manager menu, choose Monitor > Devices.

  2. Choose a Cisco IR1800 device from the device list.

  3. Click Real Time in the left pane.

  4. In the Device Options drop-down list, choose Wireless Clients.

    Option

    Description

    Wireless Clients

    View the client details along with their MAC addresses.

Check Traffic Health

View Tunnel Health

To view the health of a tunnel from both directions:

  1. From the Cisco SD-WAN Manager menu, choose Monitor > Devices.

    Cisco vManage Release 20.6.x and earlier: From the Cisco SD-WAN Manager menu, choose Monitor > Network.

  2. To choose a device, click the device name under the Hostname column.

  3. Click Troubleshooting in the left pane.

  4. In the Traffic area, click Tunnel Health.

  5. From the Local Circuit drop-down list, choose a source TLOC.

  6. From the Remote Device drop-down list, choose a remote device.

  7. From the Remote Circuit drop-down list, choose a destination TLOC.

  8. Click Go. The lower part of the screen displays:

  9. From the Chart Options drop-down list, choose one of these: Loss Percentage, Latency/Jitter, Octets.

  10. (Optional) Choose a predefined or a custom time period on the left to view data for the specified time period.

The window displays:
  • App-route data (either loss, latency, or jitter) in graphical format for all tunnels between the two devices in each direction.

  • App-route graph legend—Identifies selected tunnels from both directions.

From Cisco vManage Release 20.10.1, the Tunnel Health option is also accessible as follows:

  • On the Monitor > Tunnels page, click … adjacent to the tunnel name and choose Tunnel Health.

  • On the Monitor > Applications page, click … adjacent to the application name and choose Tunnel Health.

  • On the Site Topology page, click a tunnel name, and then click Tunnel Health in the right navigation pane.

Check Application-Aware Routing Traffic

To check application-aware routing traffic from the source device to the destination device:

  1. From the Cisco SD-WAN Manager menu, choose Monitor > Devices.

    Cisco vManage Release 20.6.x and earlier: From the Cisco SD-WAN Manager menu, choose Monitor > Network.

  2. Choose a device from the list of devices that appears.

  3. Click Troubleshooting in the left pane.

  4. In the right pane, click App Route Visualization under Traffic.

  5. From the Remote Device drop-down list, choose a destination device.

  6. (Optional) Click Traffic Filter. Choose No Filter or SAIE. No Filter is chosen by default.


    Note


    In Cisco vManage Release 20.7.x and earlier releases, the SD-WAN Application Intelligence Engine (SAIE) flow is called the deep packet inspection (DPI) flow.


  7. Click Go. The lower part of the screen displays:

  8. From the Chart Options drop-down list, choose one of these: Loss Percentage, Latency/Jitter, Octets.

  9. (Optional) Choose a predefined or a custom time period on the left to view data for the specified time period.

From Cisco vManage Release 20.10.1, the App Route Visualization option is also accessible from the Monitor > Applications page. Click … adjacent to the application name and choose App Route Visualization.

Capture Packets

Table 6. Feature History

Feature Name

Release Information

Description

Embedded Packet Capture

Cisco IOS XE Catalyst SD-WAN Release 17.3.1a

Cisco vManage Release 20.3.1

This feature is an onboard packet capture facility that allows network administrators to capture packets flowing to, through, and from the device. The administrator can analyze these packets locally or save and export them for offline analysis using Cisco SD-WAN Manager. This feature gathers information about the packet format and helps in application analysis, security, and troubleshooting.

Embedded Packet Capture for Cisco vEdge Devices Using CLI Commands

Cisco SD-WAN Release 20.6.1

This feature provides an alternative method to capture traffic data to troubleshoot connectivity issues between Cisco vEdge devices and Cisco SD-WAN Manager using CLI commands. As part of this feature, the following commands are introduced to capture traffic details:

request stream capture

show packet-capture

Bidirectional Packet Capture for Cisco IOS XE Catalyst SD-WAN Devices

Cisco IOS XE Catalyst SD-WAN Release 17.7.1a

Cisco vManage Release 20.7.1

This feature enhances the embedded packet capture functionality to support bidirectional packet capture through Cisco SD-WAN Manager.

IPv6 Support for Bidirectional Packet Capture

Cisco IOS XE Catalyst SD-WAN Release 17.9.1a

This feature adds support for bidirectional capture of IPv6 traffic data to troubleshoot connectivity issues using a CLI template.

Information About Bidirectional Packet Capture

You can capture the traffic flowing through an interface, or, for the control plane, in a single direction or in both directions (bidirectional). You can analyze the packets locally or export the captured traffic for offline analysis. From Cisco IOS XE Catalyst SD-WAN Release 17.9.1a, packet capture supports IPv6 traffic.

Configure Packet Capture Using Cisco SD-WAN Manager

Perform the following steps to capture control plane and data plane packets in real time, and to save these packets to a file available on edge devices.


Note


Packet capture is not supported for a loopback interface.


  1. From the Cisco SD-WAN Manager menu, choose Monitor > Devices.

    Cisco vManage Release 20.6.1 and earlier: From the Cisco SD-WAN Manager menu, choose Monitor > Network.

  2. To choose a device, click the device name in the Hostname column.

  3. Click Troubleshooting in the left pane.

  4. In the Traffic area, click Packet Capture.

  5. From the VPN drop-down list, choose a VPN.

  6. From the Interface drop-down list, choose an interface.


    Note


    From Cisco vManage Release 20.8.1, you can capture IPv6 packets for tracing and troubleshooting traffic. To do this, choose an IPv6 interface from the Interface drop-down list. (Prior to Cisco vManage Release 20.8.1, only IPv4 interface capture was supported.)


  7. (Optional) Click Traffic Filter to filter the packets to capture based on values in their IP headers. Enter values for the following fields:

    1. In the Source IP field, enter the source IP address of the packet.

      For releases before Cisco Catalyst SD-WAN Manager Release 20.13.1, enter an IPv4 address. From Cisco Catalyst SD-WAN Manager Release 20.13.1, enter an IPv4 or IPv6 address.

    2. In the Source Port field, enter the source port number of the packet.

    3. In the Protocol field, enter the protocol ID of the packet.

    4. In the Destination IP field, enter the destination IP address of the packet.

      For releases before Cisco Catalyst SD-WAN Manager Release 20.13.1, enter an IPv4 address. From Cisco Catalyst SD-WAN Manager Release 20.13.1, enter an IPv4 or IPv6 address.

    5. In the Destination Port field, enter the destination port number of the packet.

  8. For a Cisco IOS XE Catalyst SD-WAN device, to enable bidirectional packet capture, set the Bidirectional toggle button to On.


    Note


    The bidirectional packet capture functionality is available from Cisco vManage Release 20.7.1.


  9. Click Start.

    The packet capture begins, and progress is displayed:

    1. Packet Capture in Progress: Packet capture stops after the file of collected packets reaches 5 MB, or when you click Stop.

    2. Preparing file to download: Cisco SD-WAN Manager creates a file in libpcap format (a .pcap file).

    3. File ready, click to download the file: Click the download icon to download the generated file.


Note


In the Cisco SD-WAN Manager cluster environments, you can run speed test and capture the packets in all the devices in the cluster irrespective of the Cisco SD-WAN Manager node that the devices are connected to. You can configure the data stream with one of the following:

  • Management IP address and VPN 512 (Cisco CSR 1000v Series platform does not support Management IP address)

  • Transport IP address and VPN 0

We do not recommend data stream configuration with the system IP address of a Cisco SD-WAN Manager node and VPN 0 in cluster environments because it limits speed test and packet capture to only the devices that are connected to the Cisco SD-WAN Manager node that is configured in the data stream.


Configure Packet Capture Using a CLI Template

Before You Begin

For more information about using CLI templates, see CLI Templates.


Note


By default, CLI templates execute commands in global config mode.


Perform these steps and ensure that Data Stream in Administration settings is in Enabled state for the monitor packet capture CLI configurations to take effect:

  1. From Cisco SD-WAN Manager menu, choose Administration > Settings.

  2. In Data Stream, choose Enabled.

    From Cisco Catalyst SD-WAN Manager Release 20.13.1, click the toggle button to enable cloud services.

  3. Choose the IP Address Type. By default, System is selected. (Transport and Management types require additional Hostname and VPN settings.)

  4. Click Save.

Configure Packet Capture for IPv4 Traffic

Define a core filter for monitoring IPv4 packet capture:

monitor capture capture-name match ipv4 source-prefix/length destination-prefix/length [bidirectional] 

Here is an example configuration to filter and capture IPv4 traffic:

monitor capture mycap match ipv4 198.51.100.0/24 host 198.51.100.1

Configure Packet Capture for IPv6 Traffic

Configure the filter for monitoring IPv6 packet capture for inbound traffic or outbound traffic or both inbound and outbound traffic (bidirectional), which passes through the interface or a control plane. Do one of the following:

  • Configure packet capture for an interface:

    monitor capture capture_name  [interface interface-name interface-num {both | in | out}] match ipv6 {{ipv6-source-prefix/length| host ipv6-src-addr| any} {ipv6-destination-prefix/length| host ipv6-dest-addr| any}}
    |protocol {<0-255>|tcp|udp} 
    {ipv6-source-prefix/length| host ipv6-src-addr| any} [{eq | lt| gt| neq |range port_number} port_number] 
    {ipv6-destination-prefix/length| host ipv6-dest-addr| any} [{eq | lt| gt| neq |range port_number} port_number]} [bidirectional]
     
  • Configure packet capture for the control plane:

    monitor capture capture_name [control-plane {both | in | out}] match ipv6 {{ipv6-source-prefix/length| host ipv6-src-addr| any} {ipv6-destination-prefix/length| host ipv6-dest-addr| any}}
    |protocol {<0-255>|tcp|udp} 
    {ipv6-source-prefix/length| host ipv6-src-addr| any} [{eq | lt| gt| neq |range port_number} port_number] 
    {ipv6-destination-prefix/length| host ipv6-dest-addr| any} [{eq | lt| gt| neq |range port_number} port_number]} [bidirectional]
     

The following examples show how to configure to filter and capture IPv6 traffic:

monitor capture test interface GigabitEthernet 5 both match ipv6 protocol tcp host 2001:3c0:1::71 host 2001:380:1::71 bidirectional 
monitor capture cap interface gig 2 in match ipv6 50::1/128 50::2/128 bidirectional
monitor capture cap interface gig 2 out match ipv6 50::1/128 50::2/128 bidirectional
monitor capture cap interface gig 2 both match ipv6 50::1/128 50::2/128 bidirectional
monitor capture cap control-plane in match ipv6 50::1/128 50::2/128 bidirectional
monitor capture cap control-plane out match ipv6 50::1/128 50::2/128 bidirectional
monitor capture cap control-plane both match ipv6 50::1/128 50::2/128 bidirectional

Simulate Flows

Table 7. Feature History

Feature Name

Release Information

Description

Forwarding Serviceability

Cisco IOS XE Catalyst SD-WAN Release 17.2.1r

This feature enables service path and tunnel path under Simulate Flows function in the Cisco SD-WAN Manager template and displays the next-hop information for an IP packet. This feature enables Speed Test and Simulate Flow functions on the Cisco IOS XE Catalyst SD-WAN devices.

To view the next-hop information for an IP packet available on routers:

  1. From the Cisco SD-WAN Manager menu, choose Monitor > Devices.

    Cisco vManage Release 20.6.x and earlier: From the Cisco SD-WAN Manager menu, choose Monitor > Network.

  2. Choose a device from the list of devices that appears.

  3. Click Troubleshooting in the left pane.

  4. Under Traffic, click Simulate Flows.

  5. To specify the data traffic path, choose values or enter data in the required fields:

    • VPN: VPN in which the data tunnel is located.

    • Source/Interface: Interface from which the cflowd flow originates.

    • Source IP: IP address from which the cflowd flow originates.

      For releases before Cisco Catalyst SD-WAN Manager Release 20.13.1, enter an IPv4 address. From Cisco Catalyst SD-WAN Manager Release 20.13.1, enter an IPv4 or IPv6 address.

    • Destination IP: Destination IP address of the cflowd flow.

      For releases before Cisco Catalyst SD-WAN Manager Release 20.13.1, enter an IPv4 address. From Cisco Catalyst SD-WAN Manager Release 20.13.1, enter an IPv4 or IPv6 address.

    • Application: Application running on the router.

    • Custom Application (created in CLI)

  6. Click Advanced Options.

    1. In the Path field, choose Tunnel or Service to indicate whether the data traffic path information comes from the service side of the router or from the tunnel side.

    2. In the Protocol field, enter the protocol number.

    3. In the Source Port field, enter the port from which the cflowd flow originates.

    4. In the Destination Port field, enter the destination port of the cflowd flow.

    5. In the DSCP field, enter the DSCP value in the cflowd packets.

    6. (Optional) Check the All Paths check box to view all possible paths for a packet.

  7. Click Simulate to determine the next hop that a packet with the specified headers would take.

For service path and tunnel path commands, see show sdwan policy service-path and show sdwan policy tunnel-path.

Security Monitoring

Table 8. Feature History

Feature Name

Release Information

Description

Enhanced Security Monitoring on Cisco Catalyst SD-WAN

Cisco IOS XE Catalyst SD-WAN Release 17.5.1a

Cisco SD-WAN Release 20.5.1

Cisco vManage Release 20.5.1

This feature allows you to view the CPU, memory, and traffic usage on your device. You can also view the health of individual UTD features.

View Traffic, CPU, and Memory Usage

  1. From the Cisco SD-WAN Manager Monitor > Devices page, select the device.

    Cisco vManage Release 20.6.x and earlier: From the Cisco SD-WAN Manager Monitor > Network page, select the device.

  2. Under Security Monitoring in the left pane, select one of the UTD features Intrusion Prevention, URL Filtering, and so on.

  3. By default, the traffic counter graph is displayed.

    You can also customize the time range to see traffic usage for specific time ranges such as Real Time, 1h, 3h or even specify a Custom time range. By default, a time range of 24h is displayed. The time range cannot be more than 365 days.

  4. To view CPU or memory usage, do the following:

    • To view CPU usage, click UTD Stats: CPU Usage.

    • To view memory usage, click UTD Stats: Memory Usage.

View the Health and Reachability of UTD

  1. From the Cisco SD-WAN Manager Monitor > Devices page, select the device.

    Cisco vManage Release 20.6.x and earlier: From the Cisco SD-WAN Manager Monitor > Network page, select the device.

  2. Under Security Monitoring in the left pane, select one of the UTD features such as Intrusion Prevention, URL Filtering, and so on.

  3. For all features, the health of UTD is displayed as one of the following:

    • Down: For example: UTD is not configured.

    • Green: UTD is healthy.

    • Yellow: For example: High memory usage.

    • Red: For example: One or more Snort instances are down.

    If you configured UTD on the device and the status is not green, contact Cisco TAC for assistance.

  4. Depending on the UTD feature that you choose, the following additional information is displayed:

    UTD Feature

    Status

    Intrusion Prevention

    Package Version

    IPS Last Updated

    Reason for last update status

    URL Filtering

    Cloud Reachability

    Advanced Malware Protection

    AMP Cloud Reachability Status

    TG Cloud Reachability Status

    Umbrella DNS Redirect

    Umbrella Registered VPNs

    DNSCrypt

View the System Clock

Minimum release: Cisco vManage Release 20.9.1

To view the system clock on a device, perform the following steps:

  1. From the Cisco SD-WAN Manager menu, choose Monitor > Devices.

    Cisco vManage Release 20.6.x and earlier: From the Cisco SD-WAN Manager menu, choose Monitor > Network.

  2. Choose a device from the list of devices that is displayed.

  3. Click Real Time in the left pane.

  4. Click Device Options, and choose the following command:

Device Option

Command

Description

System Clock

show clock

Displays the system clock date and time.