Use Cisco Optical Network Controller

Before you begin

Log into Cisco Optical Network Controller

Once you login, the Topology screen is displayed by default. The menu options are displayed on the left panel. You can click on the options and navigate to any specific screen. The options available are given below.

  1. Topology

  2. Nodes

  3. Alien Import

  4. Inventory

  5. Service Manager

  6. Alarms

  7. Workspaces

  8. Service Assurance

  9. Monitoring


Note


The following options can be used commonly across multiple application screens.

  • The timestamp appears on the top right corner of the screen in all the screens. It follows the UTC time zone. The current date is displayed along with the time.

  • Click Refresh button to refresh the status of the table content in each of the application screens anytime.

  • Click Show or hide columns icon to select any columns to be displayed or hidden from the table view anytime.

  • Click Export to export the details of any table from any application screen to a spreadsheet file.

  • Use the Sort option to sort the table values and use the Filter option to filter the table content as per requirement in each application screen.


Topology

Topology displays the network along with the nodes and the associated network links on a map. You can toggle between the Light and Dark modes to view this screen. You can zoom in zoom out the entire screen to view the network and its components. You can select the OTS or OMS layers as options in the display. The OTS option is used to display the ILA nodes belonging to the network and the OMS option is used to display only the ROADMs and the links between the ROADMs in the given network.

The Topology screen is an interactive screen which allows you to click on each node to fetch its information. The links between the nodes are the fiber links connecting each node. You can click on each fiber link to fetch its information when the OTS view is enabled. There can be multiple links connecting each node at any given point in time.

On the top of this screen, there is a panel for displaying the different alarm types and the count of each type of alarm that are part of the network. The alarm types are color coded based on the types of severity as seen in the table below.

Table 1. Alarm Severity

Alarm Type

Description

RED

Critical alarms are displayed in red color.

ORANGE

Major alarms are displayed in orange color.

YELLOW

Minor alarms are displayed in yellow color.


Note


Alarm severity type for any warning will appear as Warning and for cleared alarms they severity is displayed as Cleared.


Note


  • In the Topology screen, the alarms reported at the top left are related to only those nodes that have the geo location defined. Due to this there can be a discrepancy between the alarms reported in the Topology and the Alarms screen related to these nodes.

  • In the Topology screen only the critical, major and minor count alarms are reported, unlike the Alarms screen which reports the warnings or cleared alarms.


You can get the node name along with the COSM site name it belongs to and its current state by hovering over each node in the Topology map anytime. Right click on any node in the map to select Resync, View in Node UI and View Alarms options.

Table 2. Topology Node Options

Options

Description

Resync

Resync starts the resync of the selected node.

View in Node UI

This option takes you to the COSM site from where you can view the node details.

View Alarms

This option opens the Alarms application in a new tab, from where you can view all the alarms details.

You can also view the information related to the different nodes, links, and the states of each node in the network at any point in time by clicking the Legends option. To select any node in the network, use the drop-down box to select the node.

The EDIT icon allows you to dynamically move any node to any geo location on the screen. You can click on the RESET or SAVE button to reset or save the network status that is being displayed in the Topology screen anytime. Use the CENTER icon to position the map in the center.

The disconnected nodes are displayed with a cross mark. To cross launch to other related pages use the options appearing when you right click from anywhere on the map. You can click on the REFRESH button to refresh the Topology screen with the current status anytime.

Use the Search nodes by name option to search for nodes in the topology network. This will fetch and locate the exact node in the map.
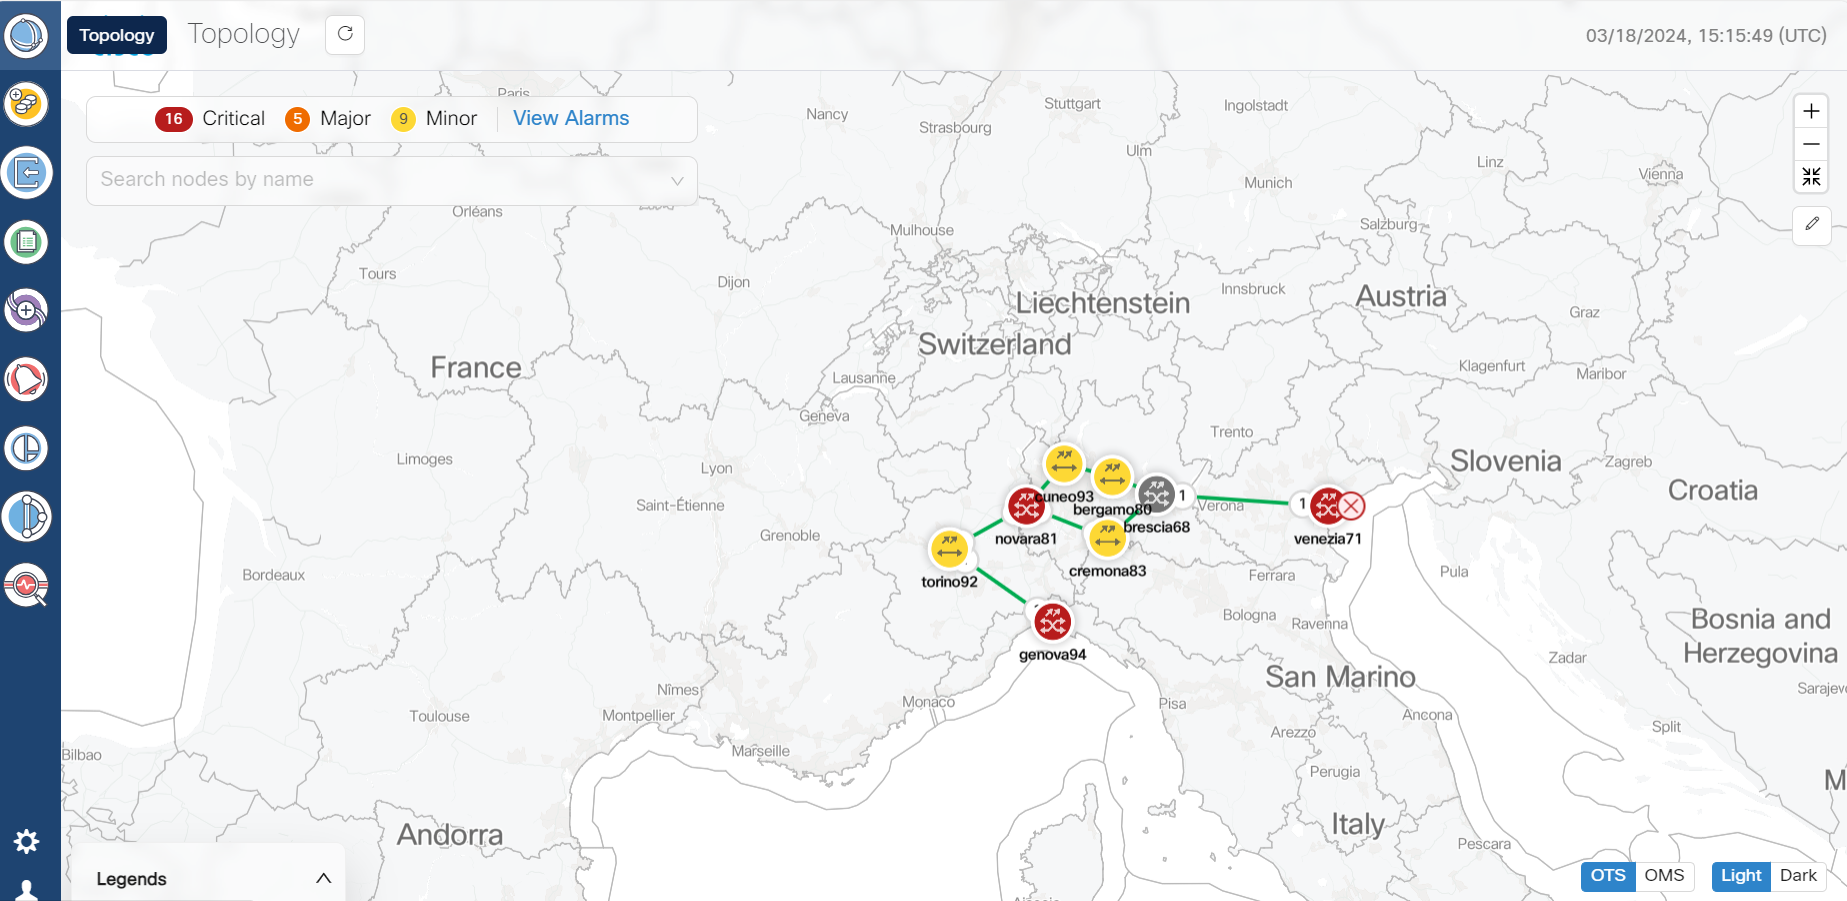
Figure 1. Topology Application
Screenshot of Topology application

Note


  • The links between each node in the network in the Topology map displays the degree numbers which can be right clicked to navigate to the particular Node UI. The 'R' in the link refers to Raman Amplified. This is not visible when you select the OMS layer option to view the map.

    Click Legends in the bottom of the Topology screen to view the various representations used in the map as shown below.

    • Nodes: The different nodes that are part of the network at any given time.

    • Links: The different links between nodes along with the amplifier and degree labels.

    • States: The different states like operational, critical alarms, link down and minor alarms.

  • In the Topology map if two nodes have the same geo location then they appear as a single node due to overlapping with each other which is a constraint.

  • If any node in the Topology screen does not have a geo location specified, the button in the upper right corner which is used to enter the geo location value displays an orange highlight or dot. This orange dot is used to represent that there is atleast one node which does not have any geo location specified. When you click this orange dot a pop-up menu appears displaying all such nodes that are lacking geo locations. Click the Edit icon and then select any node to move it to any desired location om the map. This will add the geo locations to the node. You can move the node and the Topology maps the geo location automatically for these node based on the location.

  • Once the geo location is selected, Cisco ONC displays a message to indicate that the Topology has been updated and to view the updated changes you must refresh the page by clicking the Refresh or Reload button.


Troubleshooting in Topology

The most common problems encountered while using the Topology application is given below.

  • A pop-up message: Asking to reload the page appears in the following scenarios.

    • New node onboarded or deleted

    • Geo locations changed

  • In case the node, link or icons of the nodes are missing and not displayed in the Topology screen then refresh the page.
Nodes

A node refers to a device in the network. You can add a single node or a set of nodes in the form of a batch at any given point in time.

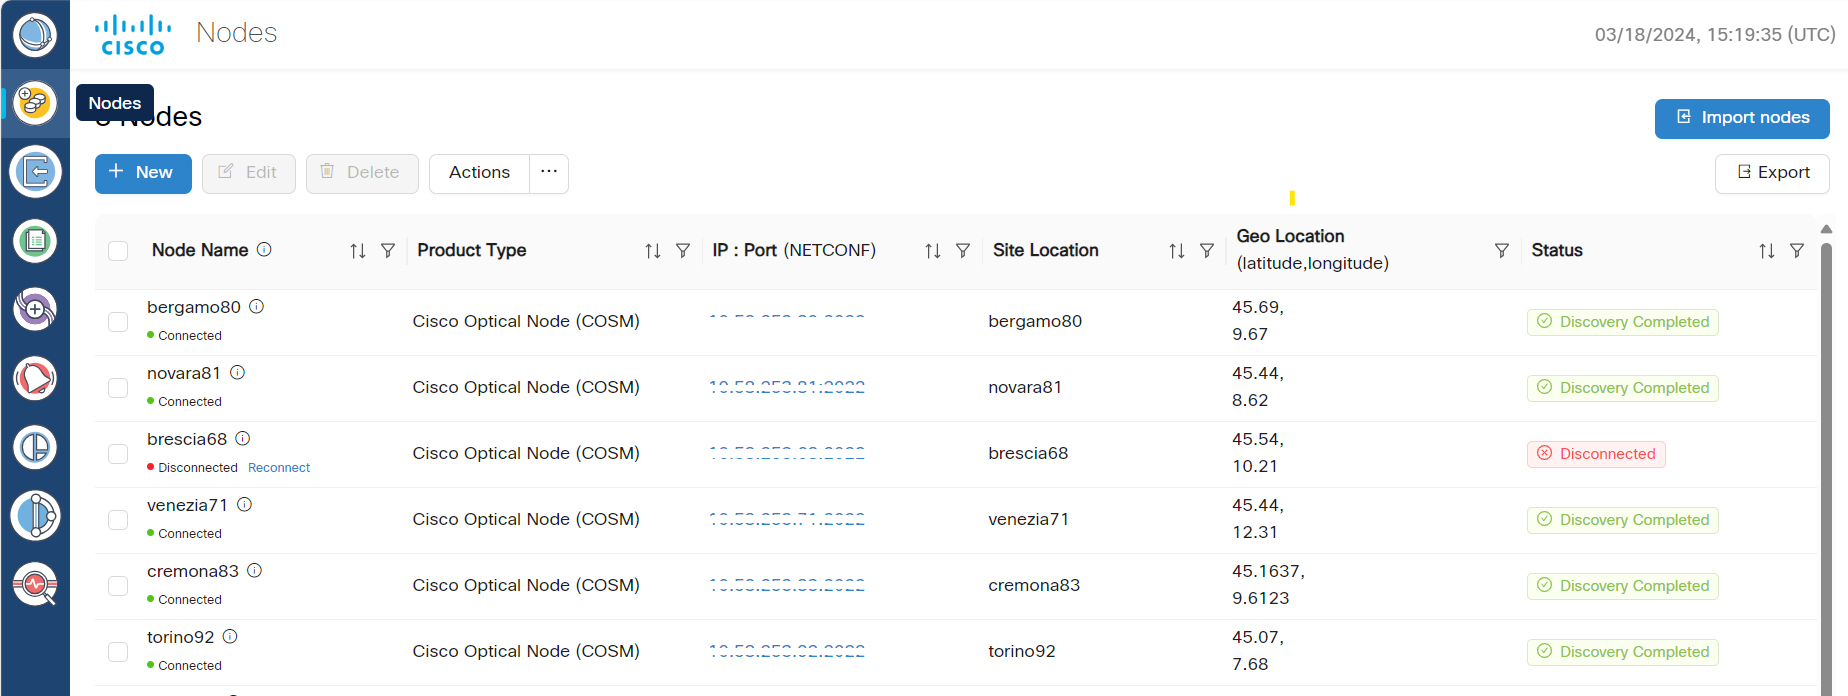
Use the Nodes screen to view the details of each node that is part of a service at any given point in time. The Nodes table displays the following details for each node:

  • Node Name: The name of the node. The node name provided by you must match the original node name used in the network. In case of any mismatch or discrepancy issues, the original node name in the network is used for outgoing payloads.

  • Product Type: The type of product the node belongs to. For example: Cisco Optical Site Manager.

  • IP: Port (NETCONF): The IP address of each node along with the part number.

  • Site Location: The location of the site that each node belongs to. For example: COSMp2p83_Site1

  • Geo Location: The geo location of each node in terms of the latitude and longitude values based on where exactly the node is situated in the world at any given time.


    Note


    If the geo location values that are coming from Cisco Optical Site Manager in a pre-filled format has more than four digits, then the length of the go localtion value is truncated to only four digits.


  • Status: The status of each node within the network to know whether it is discovered or disconnected.

Use the information icon that appears along with each node in this table for viewing the additional details pertaining to each node.

Figure 2. Nodes
Screenshot of Nodes

Use the sort or filter options to sort and filter values in the table. You can also cross launch to other supported pages using the links provided in this table.

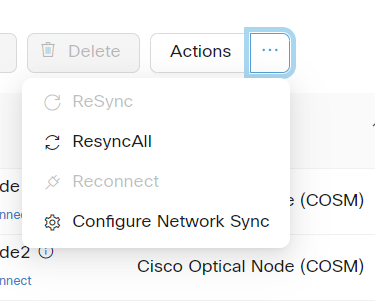
Use the Actions button for synchronizing and configuring the network sync along with reconnecting the various nodes present in the network. There are four options available for this purpose.

  • ReSync: Used for resyncing any selected node in the network.

  • ReSync All: Used for resyncing all the nodes in the network.

  • Reconnect: Used to reconnect any or all the nodes.

  • Configure Network Sync: Used for Periodic Network Full Sync.

Figure 3. Actions
Screenshot of Actions

Note


  • Latitude and longitude values can be set in both Cisco Optical Site Manager and Cisco Optical Network Controller. The following scenarios are possible:

    • Geo location is set in both Cisco Optical Site Manager and Cisco Optical Network Controller: Cisco Optical Network Controller geo location is used.

    • Geo location is set only in Cisco Optical Site Manager: Cisco Optical Site Manager geo location is used .

    • Geo location is set only in Cisco Optical Network Controller: Cisco Optical Network Controller geo location is used.

    • Geo location is not set in either Cisco Optical Network Controller or Cisco Optical Site Manager: You will be prompted to add the node in Topology with the edit button.

      For all the cases mentioned above, Cisco Optical Network Controller latitude and longitude value has a higher priority over the Cisco Optical Site Manager latitude and longitude values during the onboarding process. In case the Cisco Optical Network Controller latitude and longitude values are not provided, only then the Cisco Optical Site Manager latitude and longitude values are used.

  • Even if the user updates the geo location in Cisco Optical Network Controller, it does not get updated in the Cisco Optical Site Manager device.

  • If the geo location values coming from Cisco Optical Site Manager have more than four digits, they are shortened to up to four digits only and displayed.


Troubleshooting in Nodes

The most common problems encountered while adding new nodes are given below.

  • Bulk import failure

    In this case you will get a text file describing the specific issues in the template.


    Note


    Cisco ONC does not allow deletion of a node which involved in the collection or resync process, or while it is a part of any circuit path


  • Nodes possible status

    Node Status Description User Action
    In Progress Cisco ONC is collecting information about the onboarded device. No action is needed, wait for the status to change.
    Resync Pending Cisco ONC has gone out of sync with device and is scheduled for a resync. Either wait for scheduled resync or start the resync manually.
    Resync In-progress Cisco ONC is re-collecting information about the onboarded devices. No action is needed, wait for the status to change.
    Disconnected Cisco ONC was unable to establish a session with COSM. Attempt re-connect or resync. If the problem still persists contact Cisco TAC.
    Discovery Completed All information has been collected from the device and it is ready for operations.

    Note


    It is recommended to wait for 60 secs once the device is turned to Discovery Completed state which ensures the device is ready for accepting requests.

  • Nodes connection status

    Connection State Description User Action
    Connected Cisco ONC has successfully established the session with the COSM device provided user/password information. No action is needed.
    Disconnected Cisco ONC was unable to establish session with COSM. Attempt re-connect or resync. If the problem still persists contact Cisco TAC.
    Waiting for connection Cisco ONC is attempting to establish connection with COSM. No action is needed.
    Resync_needed Cisco ONC has gone out of sync with device and is scheduled for a resync. Either wait for scheduled resync or start the resync manually.
  • De-boarding of a node fails

    • Ensure no circuit is created involving this node.

    • Retry deleting the node after sometime.

    • In case the deletion fails even after you have retried it multiple times, contact Cisco TAC for further assistance.

Add Nodes on Cisco Optical Network Controller

You can add a single node or a set of nodes in the form of a batch use the procedure given below.

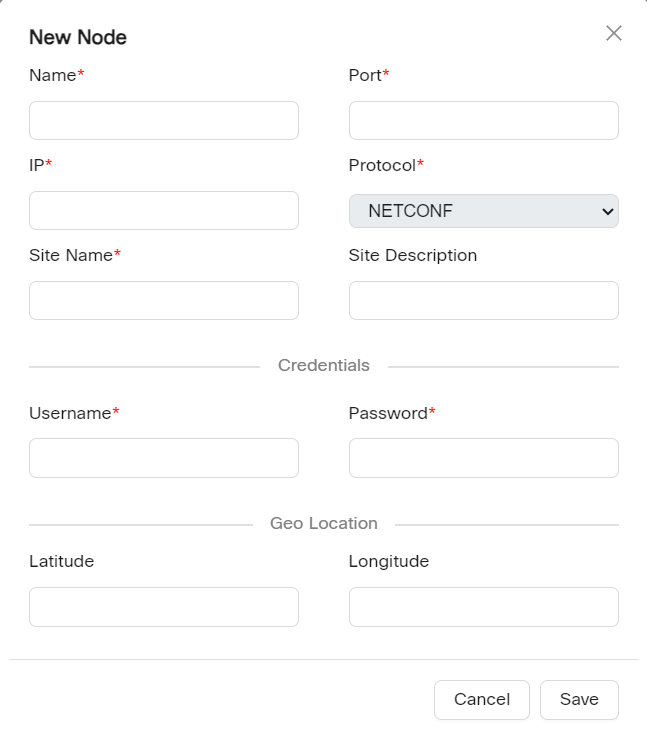
Figure 4. Add New Node
Screenshot of New Node

Before you begin

To add NCS 1010 nodes to Cisco Optical Network Controller:

  • The NCS 1010 nodes must run IOS XR Release 7.11.2.

  • Cisco Optical Site Manager must be installed on the node.

  • All NCS 1010 nodes must be added to Cisco Optical Network Controller with port number 2022.

Procedure


Step 1

Click Nodes in the left panel.

Step 2

Click New.

Step 3

Enter the device details necessary connect to the device as given in the table below.

Table 3. Add new node

Name

Description

Mandatory

Name Name of the new node you are adding

Yes

IP

IP address of the new node which you are adding.

Yes

Port

The port number of the new node which you are adding.

Yes

Protocol

The protocol used for the new node which you are adding.

Yes

Site Name

The name of the site to which the new node belongs.

Yes

Username

The username you want to set for accessing the new node.

Yes

Password

The password you want to set for accessing the new node.

Yes

Site Description

The description of the site to which the new node belongs.

No

Latitude

The Latitude co-ordinate value you which you want to assign for the new node to set its location.

No

Longitude

The Longitude co-ordinate value you which you want to assign for the new node to set its location.

No

Note

  • Ensure that you enter valid a username and password of the device to enable Cisco Optical Network Controller to connect to the device.

Step 4

Click Save.The new node or device is onboarded successfully and added to the Nodes table. Cisco Optical Network Controller validates the connection with the onboarded device.


Import Nodes on Cisco Optical Network Controller

Before you begin

For importing the node details from any spreadsheet into the table, use the procedure given below.

Procedure


Step 1

Click Nodes in the left panel.

Step 2

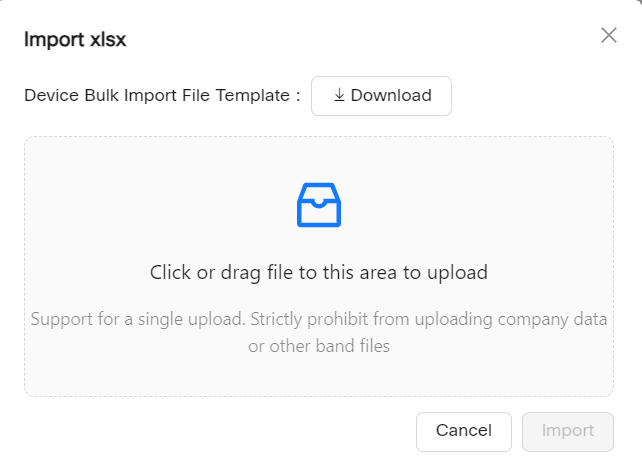
Click Import to import the table details from external files.

Step 3

Select the spreadsheet which has all the node details and click Open. The new nodes are onboarded and added to the Nodes table.

To add the details of the nodes in a bulk format use the Import nodes option.

Note


Click Download option to get the sample template of the bulk import file.

Figure 5. Import Nodes
Screenshot of Import nodes
Figure 6. Sample Template of Bulk Import File
Screenshot of Bulk Import File

The sample bulk import template has the following fields which need to be filled before importing node details.

Table 4. Bulk Import File Template

Name

Description

Host Name

Name of the host node.

Node IP

The IP address of the node you are adding.

User Name

The username you want to set for accessing the new node.

Password

The password you want to set for accessing the new node.

Connectivity Type

The type of the protocol used for connecting the node.

Connectivity Port

The port number of the node.

Site Name

The name of the site to which the new node belongs.

Site Description

The description of the site to which the new node belongs.

Type

Type of the node.

Latitude

The Latitude co-ordinate value you which you want to assign for the new node to set its location.

Longitude

The Longitude co-ordinate value you which you want to assign for the new node to set its location.


Export Nodes on Cisco Optical Network Controller

Before you begin

For exporting the node details from the table use the procedure given below.

Procedure


Step 1

Click Nodes in the left panel.

Step 2

Click Export to export the details to a spreadsheet file.


Edit Nodes on Cisco Optical Network Controller

Before you begin

Use the Edit option for editing the node details, use the procedure given below.

Procedure


Step 1

Click Nodes in the left panel.

Step 2

Click EDIT after selecting the node from the table.

In the edit mode the Cisco Optical Site Manager (COSM) geo location latitude and longitude values appear as separate values which can also be modified as required. Once the onboarding of the node or device is complete you can edit any selected node and modify its credentials using the EDIT option.


Delete Nodes on Cisco Optical Network Controller

Before you begin

Use the Delete option to delete one or more nodes at any given time. Follow the procedure given below.

Procedure


Step 1

Click Nodes in the left panel.

Step 2

Select the node or nodes to be deleted.

Step 3

Click DELETE.

This will delete the selected node from the table.

Note


If the circuits are active and flowing over the nodes or if the resync is in progress, then deletion of the node fails. In this case you will receive an error message for the Circuit Deletion Failure when the circuit is spanning through the node.

For example: <Device A> cannot be deleted because circuit spanning across the device.


Alien Import

Before you begin

To import and export the alien device data use the procedure given below.


Note


For more details on how to model an alien wavelength or transceiver, etc through Cisco Optical Network Planner (CONP) see CONP Manage Alien.


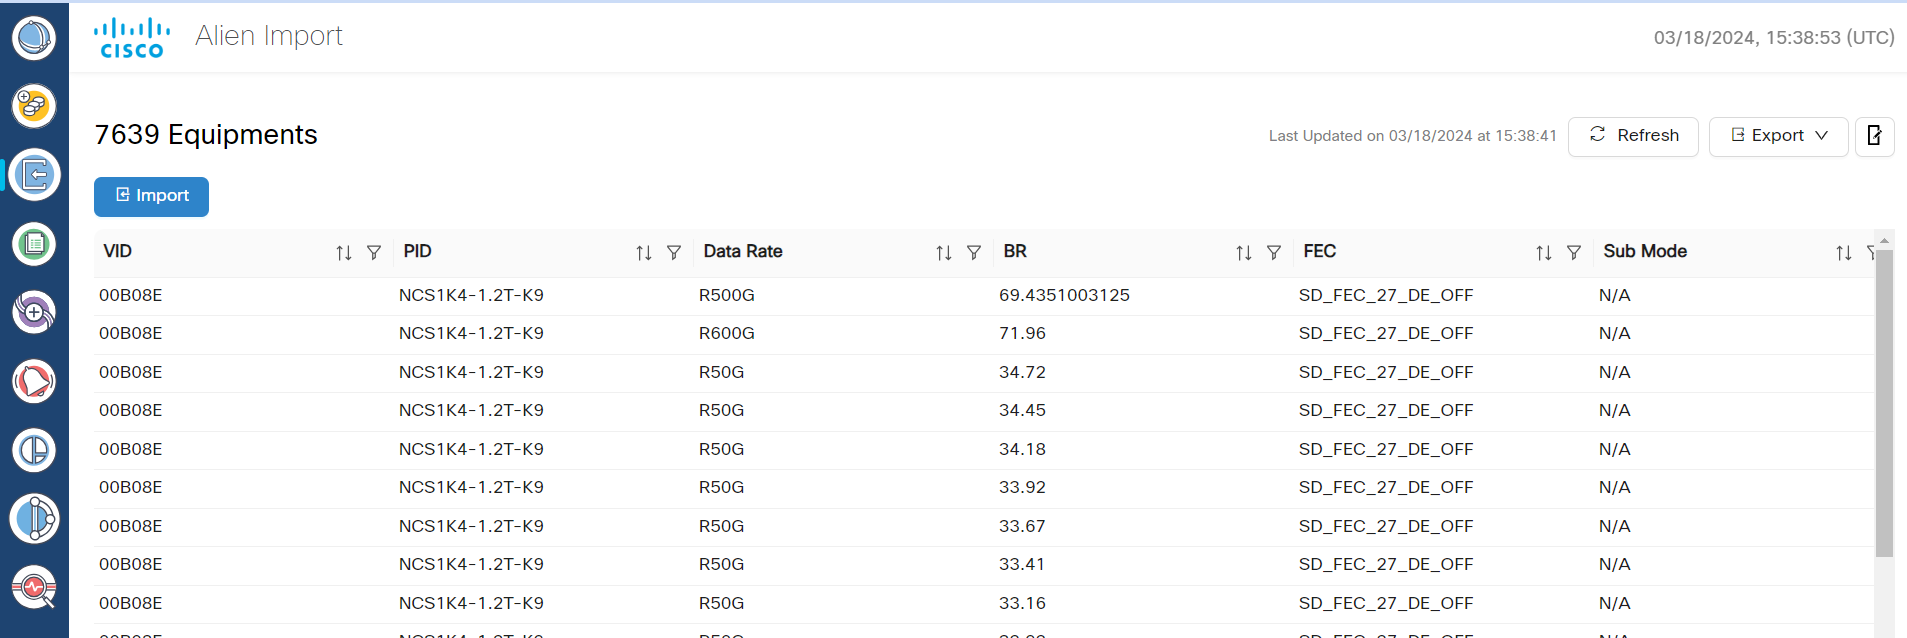
Figure 7. Alien Import
Screenshot of Alien Import

Procedure


Step 1

Click the Import icon on the top of the table.

Cisco Optical Network Controller imports and displays the information of all the alien devices from the XML file. After successful import, the alien device information is available for applications that use the Cisco Optical Network Controller TAPI and REST API.

Step 2

To export the alien device information in JSON or XML formats, click Export and choose the target format from the drop-down list.

Note


The XML file which is imported in Cisco ONC is generated by CONP and can have some third-party restrictions on it.

Step 3

Click the Refresh button to refresh the equipment status.

Step 4

Click on the Show or hide columns icon to select any columns to be displayed or hidden from the table view anytime.

Step 5

Use the page numbers and select the number of rows per page as required for the table display.

Step 6

Use the sort or filter options to sort and filter values in the table.


Network Inventory

Before you begin

This task describes how to view inventory details on Cisco Optical Network Controller. To view or export the inventory details, follow the procedure given below.

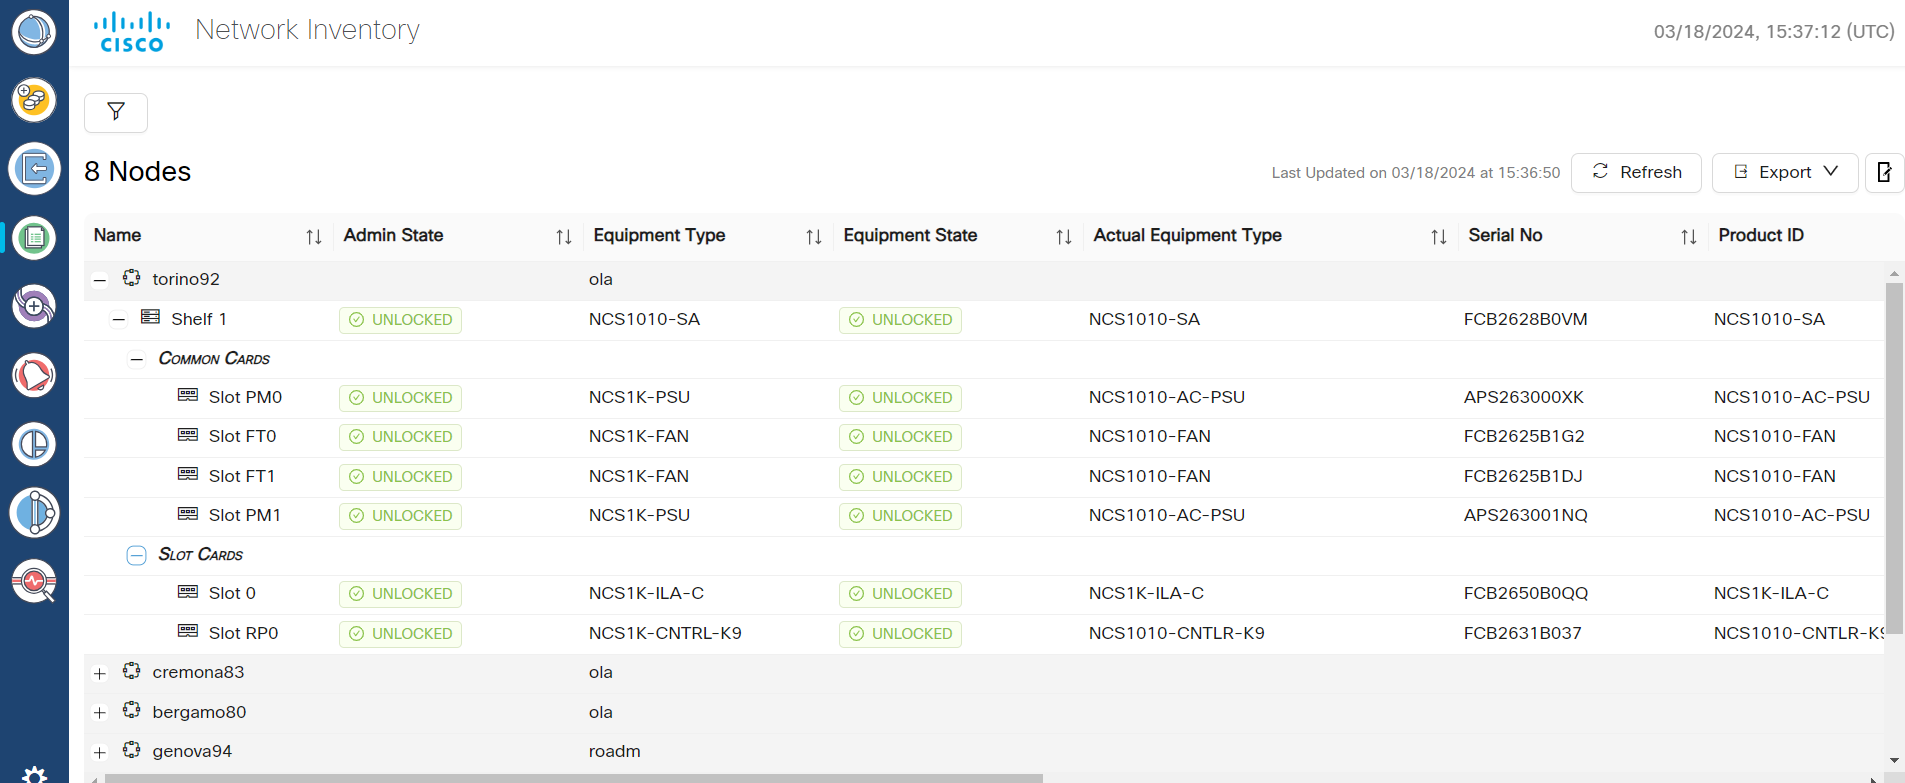
Figure 8. Network Inventory
Screenshot of Network Inventory

Procedure


Step 1

Click Network Inventory in the left panel.

Cisco Optical Network Controller displays the Inventory tab. This tab displays all the inventory at the selected site.

Step 2

Click the node that you want to view the details of.

There is an option for selecting cascading windows for each node to view the Common Cards and the Slot Cards.

Step 3

(Optional) To export inventory data into an excel file, click Export.

Step 4

Click the Refresh button to refresh the inventory status.

Step 5

Use the filter to search using Custom Search or Quick Search options.

Note


Custom Search: Use this option to filter the search based on any particular field from the table. By selecting from the drop down list, the rows that are specific to the selected field appear in the search result. You can custom search using any of these options: Admin State, Equipment Type, Software Revision, Equipment State, Actual Equipment Type, Serial No or Site Name.

Quick Search: Use this option to search based on any value or field by typing it in the search box to fetch the related rows from the table.


Service Manager

Before you begin

Circuits are referred to as services. The Service Manager screen helps in viewing and creating services. Service List page displays the list of services which can be viewed and exported anytime. The Provision Service option allows to create a new service.


Note


  • The recommended number of circuits that you can create or delete at once are up to a maximum of five circuits, even though it is possible to create or delete more than five circuits at any given point in time. In such cases, you can stop provisioning these additional circuits as required. Also, it is recommended that you wait until reaching the final status before you can work with other circuits.

There are circuits called brownfield circuits which can be already present on the devices before the onboarding proceeds. The configuration of these brownfield circuits happens outside Cisco ONC.

Brownfield circuits are circuits that are already existing on devices. The configuration of these circuits is done either outside of Cisco ONC like in COSM or through NCS 1010 CLI. It can be configured through a different instance of Cisco ONC as well which is managing the same network. The brownfield circuit's service names have the following format: onc_<SourceNode Name>_<DestinationNode Name>_xx.


To create a new service, follow the procedure given below.

Procedure


Step 1

Click Provision Service in the left panel

Figure 9. Service Manager
Screenshot of Service Manager

Step 2

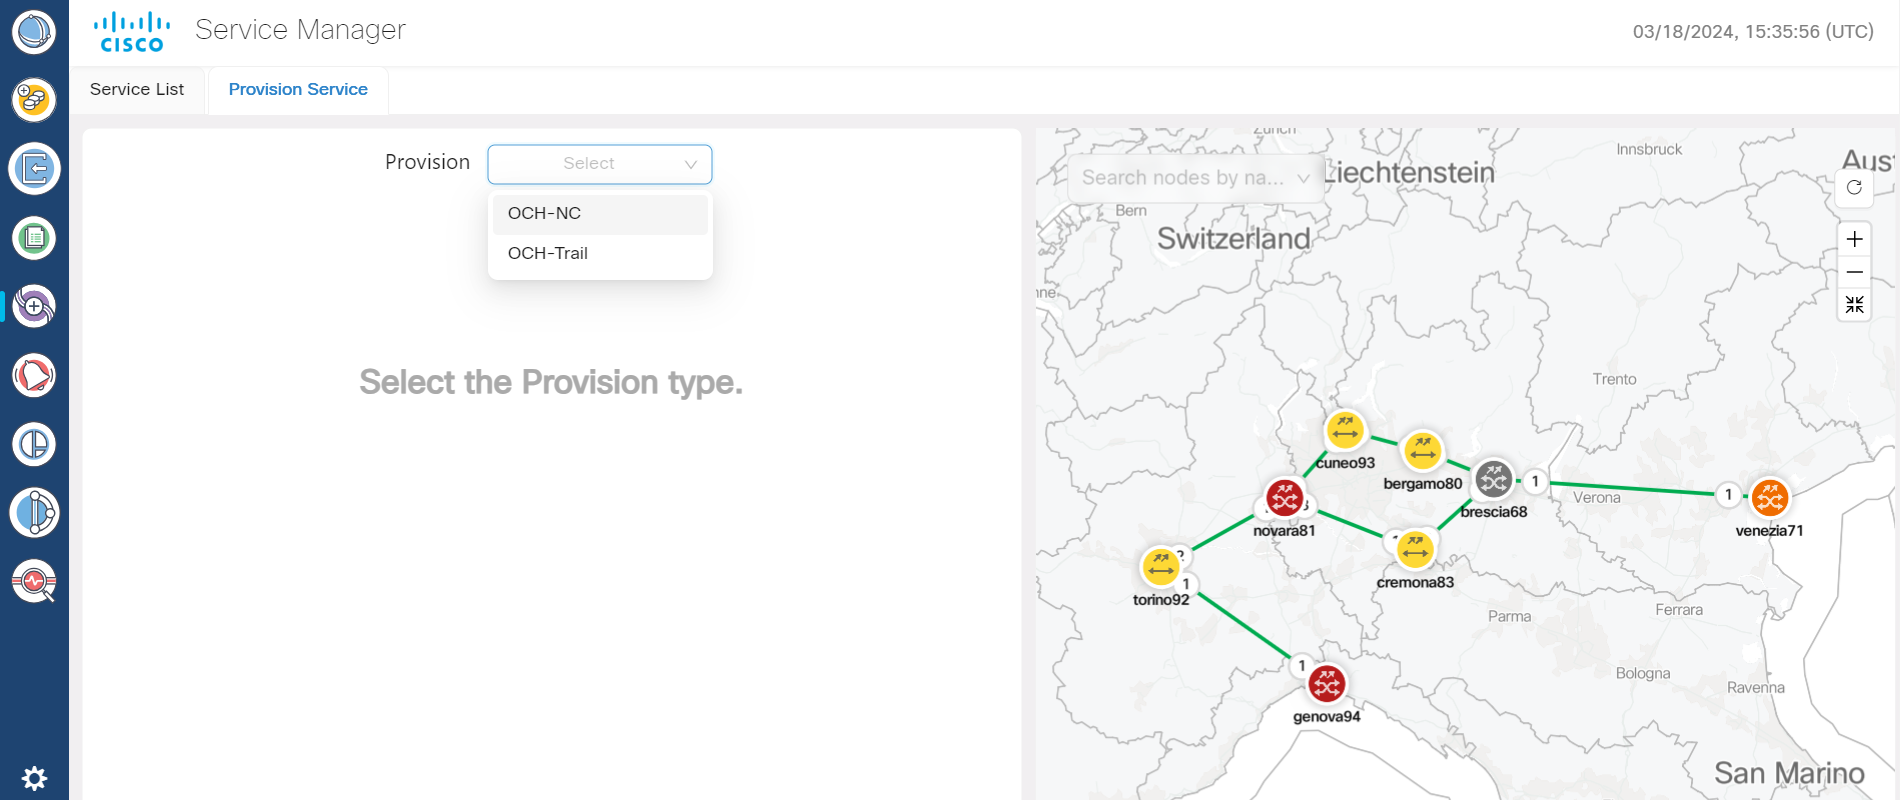
Click Provision and select OCH-NC or OCH-Trail.

Note

 
  • OCH-NC: The circuit is created between Add/Drop ports on the terminal OLTs or ROADMs.

  • OCH-Trail: The circuit is created between trunk ports of transponders or muxponders.

Figure 10. Provision Service
Screenshot of Provision Service

Step 3

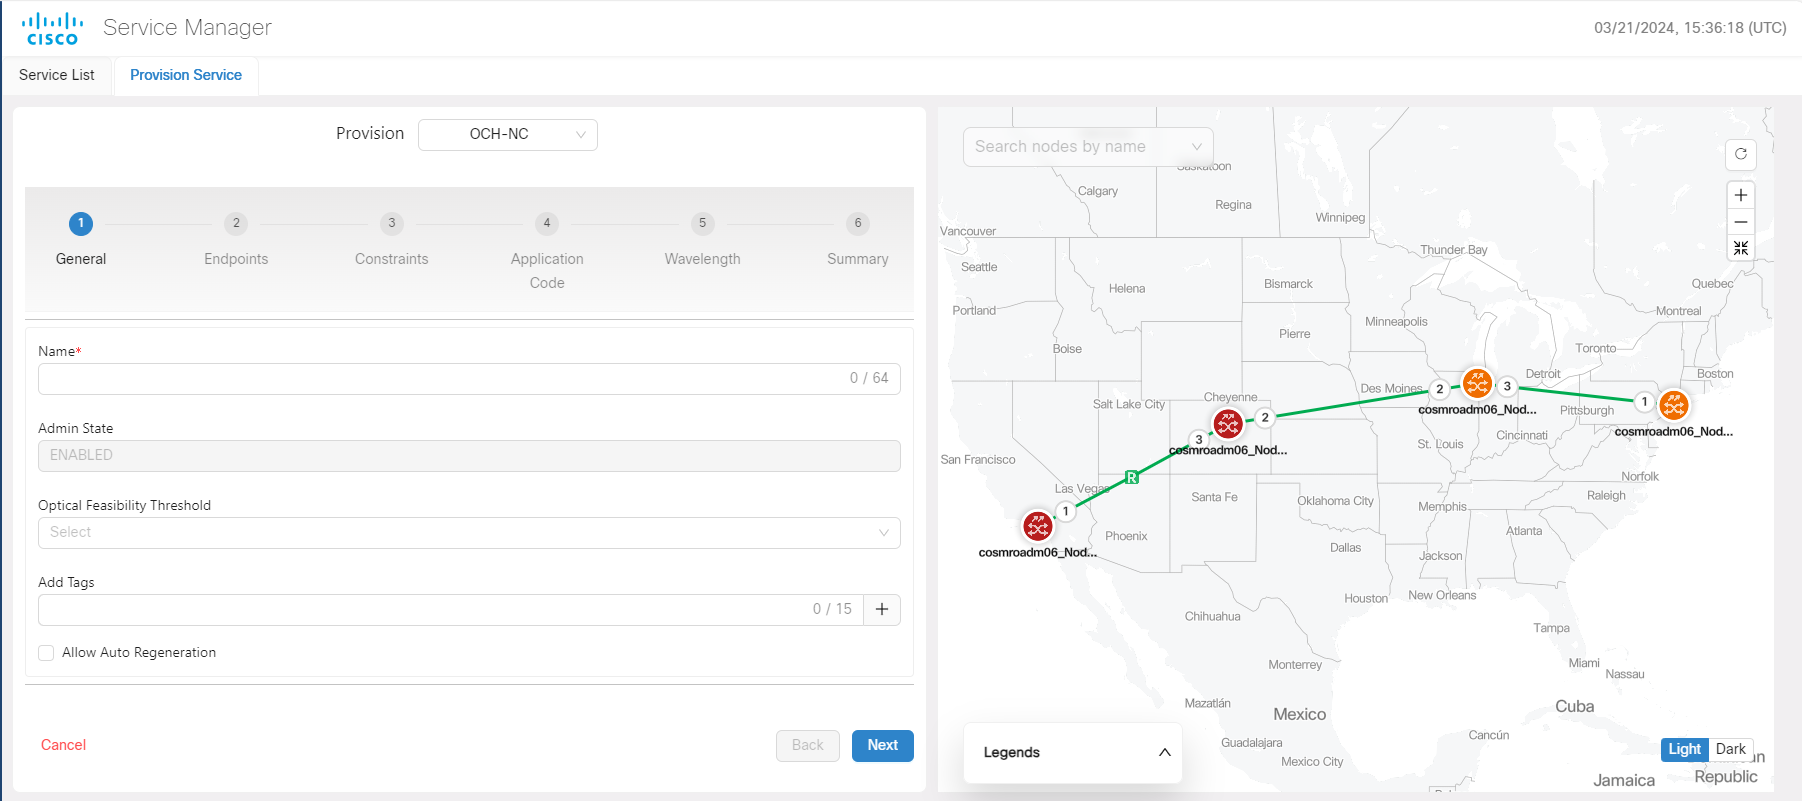
Enter the details as per the sequential steps listed for the type of circuit and channel selected along with the other required preferences by clicking Next after each page. Fill each tab as per the details given below.

Figure 11. Provision Service Tabs
Screenshot of Provision Service Tabs
Table 5. Provision Service Tabs

Provision Service Tabs

Description

GENERAL

Name: The unique user defined name of the OCH-NC link.

(Allowed characters are a-z, A-Z, 0-9 and _. <Space not allowed>).

Admin State: only ENABLED is supported in 3.1.

Optical Feasibility Threshold: Select RED, GREEN, YELLOW or ORANGE.

GREEN = mean value

YELLOW = +1 sigma

ORANGE = +2 sigma

RED = +3 sigma

Add Tags:

If user wants to add any tags to the service.

Allow Auto Regeneration: Whether to allow auto regeneration (*not supported in 3.1).

ENDPOINTS

Single Channel/Multiple Channel

In case of multi channel between the same Endpoints, the user can add multiple carriers, using the Add button, in a single OCH-NC service provisioning using different channel ports.

Endpoint A/Endpoint B:

Source and Destination Nodes.

This can be selected either from the drop down menu or by clicking on the map icon and then selecting the node.

Select port:

Source port or Destination port from where you need to provision the service.

CONSTRAINTS

Optimization goal (optional):

The optimization goal (Length or Hops or OSNR).

Disjoint from service (optional): The new OCH-NC line is not allowed to use the specified path.

Include nodes or links (optional): Used to add Constraints for the new service by selecting from the drop down or by using the map.

Exclude nodes or links (optional): Same as the above option but the Constraints here are used for excluding nodes or links.

Click the re-cycle icon to remove any of the included or excluded items.

Application Code

â—¦ Customer Name: The Customer name.

â—¦ Product ID: The product ID.

â—¦ FEC: The FEC depending on the product, for example, CFEC or OFEC depending on the previous selection.

â—¦ Data Rate: The data rate supported by the selected product.

â—¦ Baud Rate: The baud rate supported by the selected product.

â—¦ Sub Mode: This may appear depending on the other settings.

Reload application code: Use this for a allenWL recently imported with Alien Import feature to reload the list of the Application code available for OCHNC provisioning.

Reset can be used for resetting all the fields.

Wavelength

Central Frequency (THz): This can be filled in two ways.

  • By filling the frequency value in the field.

  • By spectrum occupancy

Summary:

Summary of all the previous five steps given above.

Step 4

Click Preview to the preview the circuit before it is created.

Step 5

Click Finish to create the circuit.

Step 6

Click OK once the circuit is provisioned successfully.

The newly provisioned circuit appears in the Service List table once the provisioning is complete. The Lifecycle State for the new circuit appears as PLANNED initially and later changes to INSTALLED.

Step 7

Click Edit option to edit any selected service from the table.

Step 8

Click Delete option to delete a selected service from the table.

Step 9

Click + icon after selecting any node to expand the service and view its carriers.

Carriers can be of either single or multiple service types. Multiple carriers can have the same Endpoints over different channels.

Step 10

While provisioning a service you can also click and select any object from the map and that object's details gets added in the Endpoints tab automatically.


Troubleshooting in Service Manager

The most common problems encountered while using the Service Manager application is given below.

Some PCE error codes which you might encounter while provisioning the service are given below.

  • [PCE-PR00003] - Failed for waves selector: [PCE-EXC00002] - Carrier 1 source wave (XXXXXXXX-XXXXX (XXXX.XX)) and Destination one (XXXXXXXX-XXXXX (XXXX.XX)) differs

  • [PCE-WAL00048] - Requested central frequency XXX,XXX is out of supported range

  • [PCE-WAL00026] - No free spectrum available to allocate MCH with central frequency XXX.XXX.

  • [PCE-PR00001] - No routes available

  • [PCE-WAL00026] - No free spectrum available to allocate MCH with central frequency XXX.XXX.x

  • [PCE-PR00026] - Include constraint [Site uuid] not matched

  • [PCE-PR00018] - Optical validation failed: ZONE_RED worse than ZONE_GREEN

  • [PCE-PR00004] - Failed to evaluate optical path: [PCE-OV00016] - [Fiberspan UUID]: Invalid fiberType: [null value]

The probable scenarios in which the services can go to the Pending Removal State due to configuration failures and recovery steps are given below:

Failure Scenario Cisco ONC Error Recovery Step
COSM Node gets disconnected as soon as a service is provisioned in CONC Config Failure

Delete the circuit and reprovision from the CONC.

COSM nodes are in sync state during CONC provisioning.

Config Failure

Check the COSM node and wait for synchronisation to complete.

NCS 1010 Devices under COSM Nodes are locked

Config Failure
  • Check COSM and unlock the NCS 1010 device.

  • Verify COSM synchronisation status to be completed.

COSM node Restart during provisioning Config Failure

Wait for CONC to re-establish the connection successfully after restart and its status moved to Discovery Completed in CONC.

Reload of the NCS 1010 device during provisioning from CONC

Config Failure
  • Wait for the reload to complete on NCS 1010 device.

  • Verify the synchronisation is complete on COSM Node.

  • Wait for CONC to reestablish the connection successfully with COSM Node and its status moved to Discovery Completed.

Stale entries present in NCS 1010 while no cross connects present on COSM Nodes Config Failure
  • Clear the NCS1010 stale entries.

  • Wait for COSM node to complete the synchronisation.

Xcons Present in COSM Node along with NCS 1010 Config Failure
  • Clear the XCONS on COSM and NCS 1010.

  • Wait for COSM node to complete the synchronisation and Discovery completed status.

Alarms

Before you begin

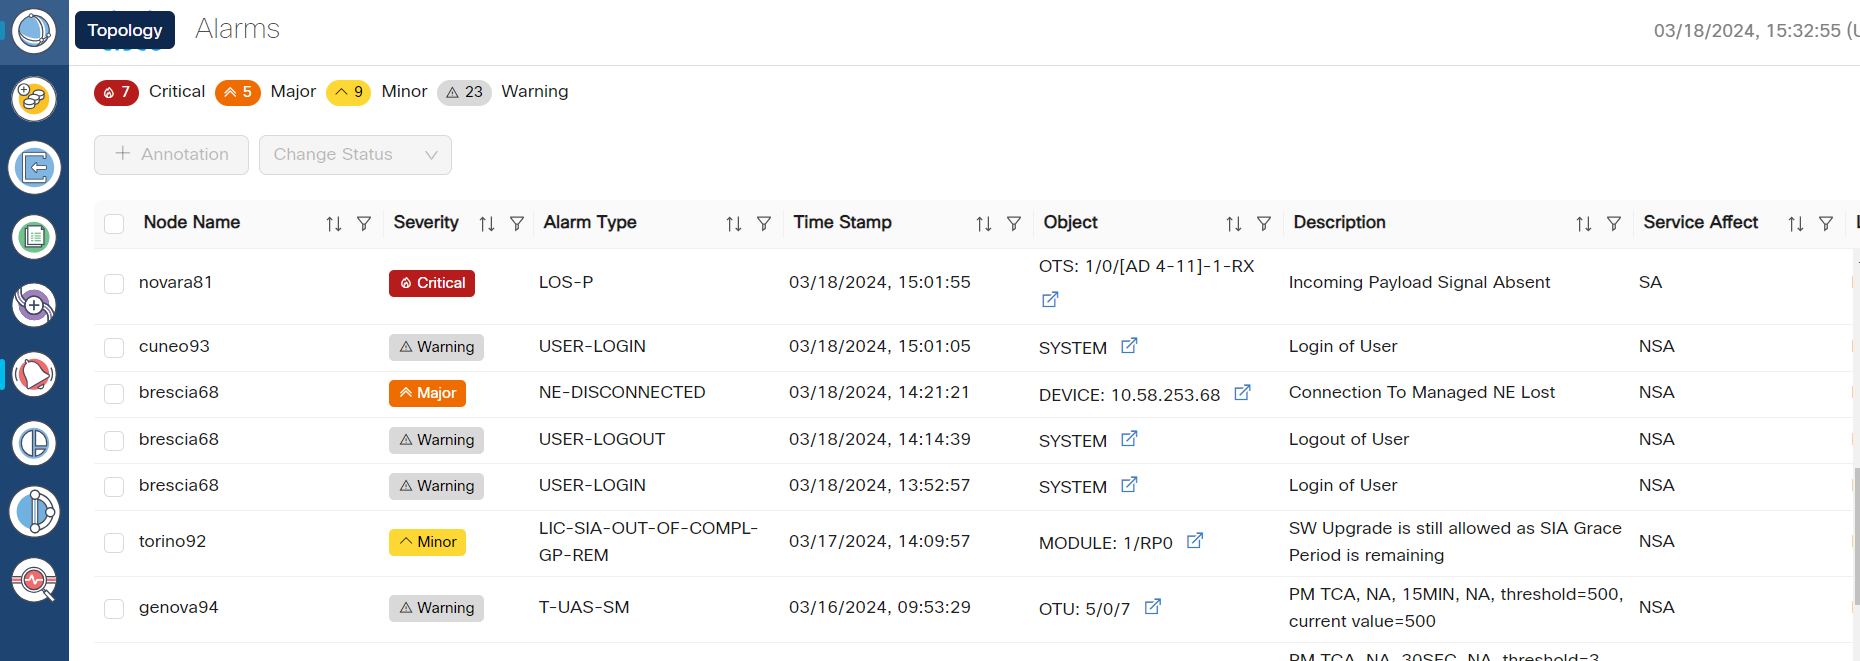
The Alarms screen displays all the alarm details for each node based on the severity level. You can view both the active alarms and the previously active alarms in this screen.

Figure 12. Alarms
Screenshot of Alarms

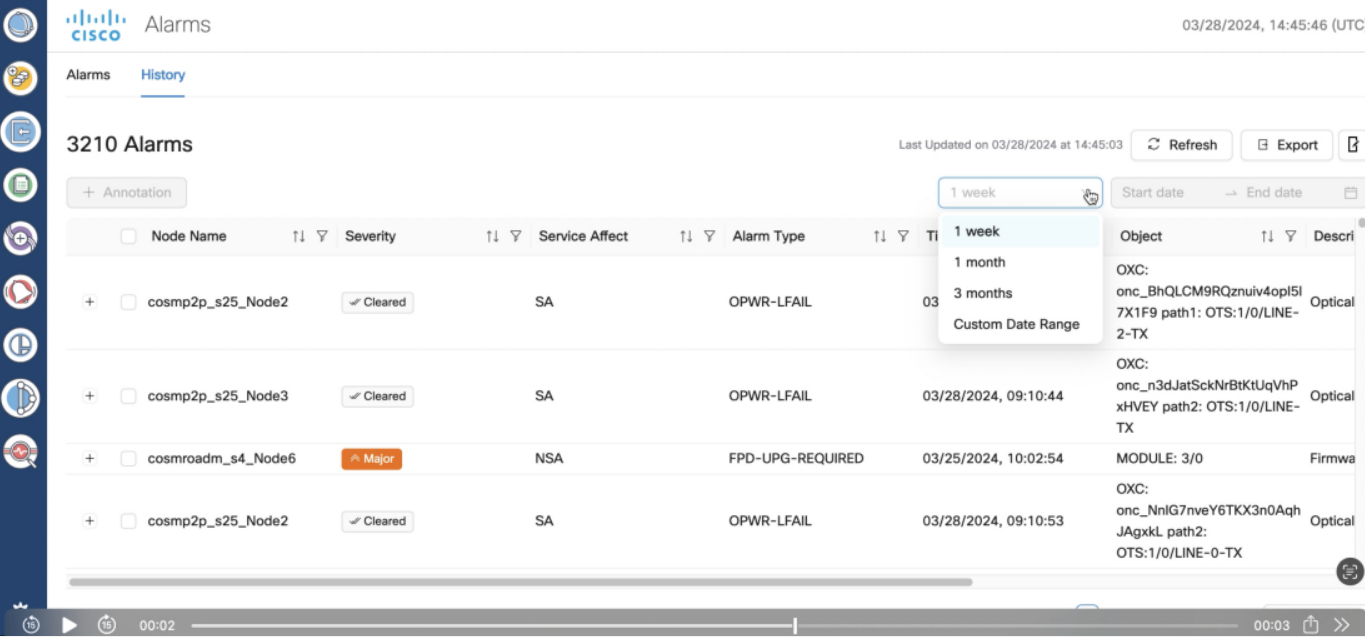
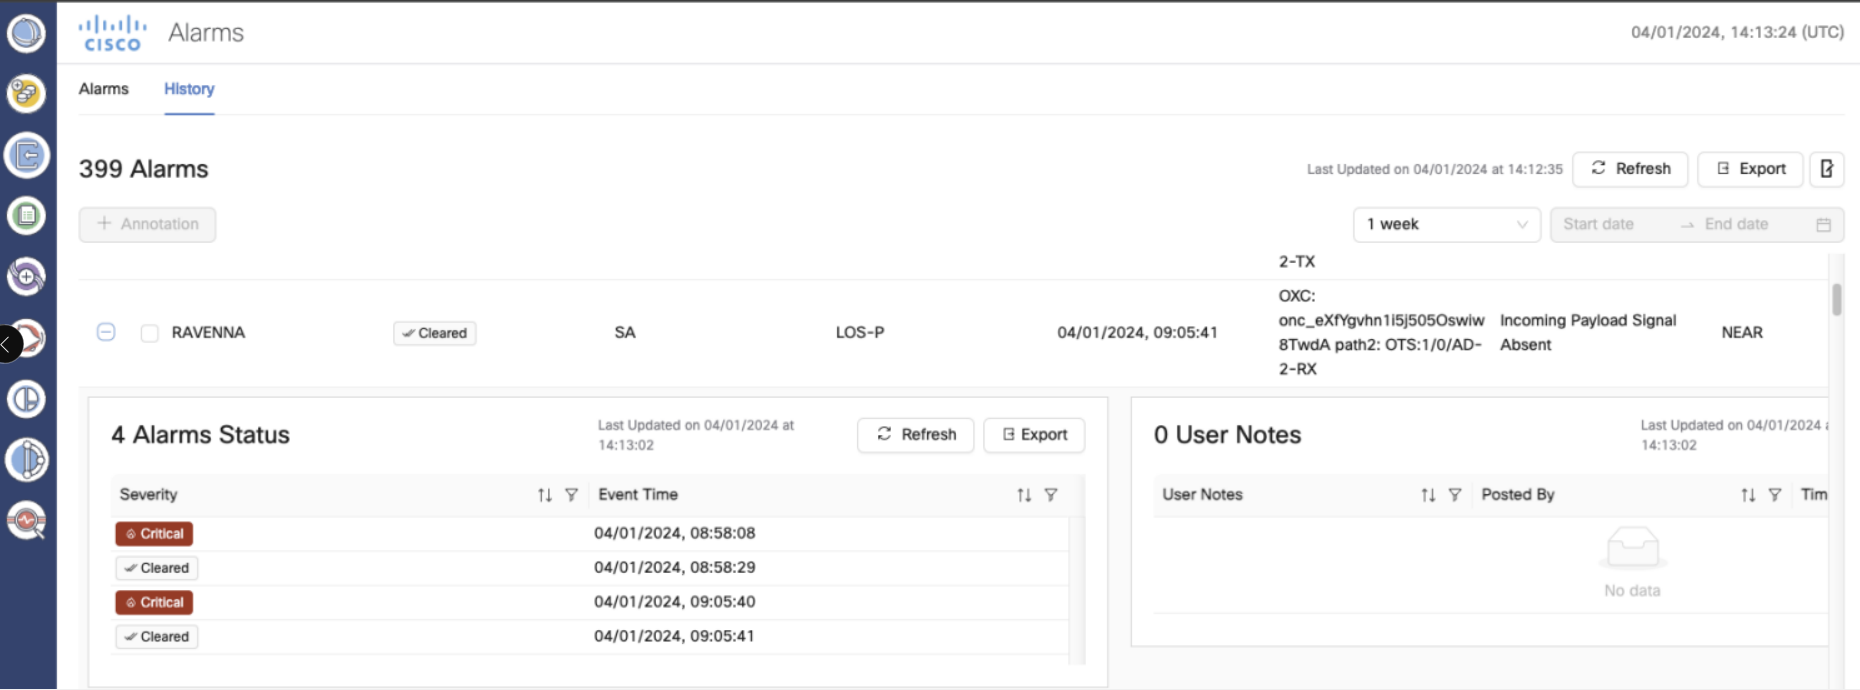
For viewing the active alarms using Alarms tab and the other for previous alarms using History tab.

Figure 13. Alarms History
Screenshot of Alarms History

Procedure


Step 1

Click Alarms in the left panel.

Step 2

Select the Alarms tab to view the active alarms of each node.

Step 3

Click Annotation to add user notes to any alarm, select the node and c. Add the user notes and click Add. This will send a notification to the user for the alarm. You can add multiple notes to multiple alarms in the form of a list.

Step 4

Click Change Status to acknowledge or unacknowledged alarms.

Step 5

Click History to view the inactive or previous alarms. The details of each alarm based on each node and alarm type are displayed in the form of a cascading list and tables. Use the Custom Date Range Custom Date Range drop down option to view the history alarms based on different dates or time periods.

Figure 14. Alarm History Expanded View
Screenshot of Alarm History Expanded View

Step 6

Click any cross-launch icon for any node to cross launch to the linked COSM.

Step 7

Click Export to export the alarms details.

Note


You can export the table content to an excel file using the Table View option which has only the visible portion of the table appearing in the file or export the entire table content at once.

Step 8

Click Refresh button to refresh the alarms status.

Note


If you apply a filter and click the Refresh button, the status is refreshed as per the filter you have applied.

Step 9

Use the Filter option by clicking on the filter icon appearing in each column.

Note

 
  • The filter option allows you to search the alarm details based on the selected filter.

  • When you apply any filter in the Alarms screen, the Critical, Major, Minor and Warning counters they do not update their values as per the individual status of the alarms but only the count of each type of alarm.

Step 10

Use the Sort option by clicking on the sort icon appearing in each column.

Note


The sort option allows you to sort the alarm details based on the order you have selected.

Step 11

Click on Critical, Major, Minor alarm types to filter and display the alarms belonging to each type. Click on Warning to display the list of warnings.

Step 12

Use the Acknowledge column in the table to view the acknowledged or unacknowledged alarms.

Note

 
  • To acknowledge or unacknowledge any particular alarm, select the node from the table and then click on Change Status. From the drop down, select Acknowledge or Unacknowledge option to acknowledge or unacknowledge the alarm of the selected node.

  • If an alarm is acknowledged, it appears with a green check mark in the table.

  • Acknowledged alarms also display the date and time-stamp details.

  • Multiple alarms can be acknowledged or unacknowledged at once.

Step 13

Use the User Notes column in the table to view the user notes added by any user.

Note

 
  • To add a user note, select the node and click on Annotation option. Enter the user note details and click on Add. The newly added user note appears in the User Notes column in the table.

  • Multiple user notes can be added to the same node or alarm.

  • If you click on the user notes icon in the User Notes column, it will display all the user notes added for the selected node or alarm.

Figure 15. User Notes
Screenshot of User Notes

Workspaces

Before you begin

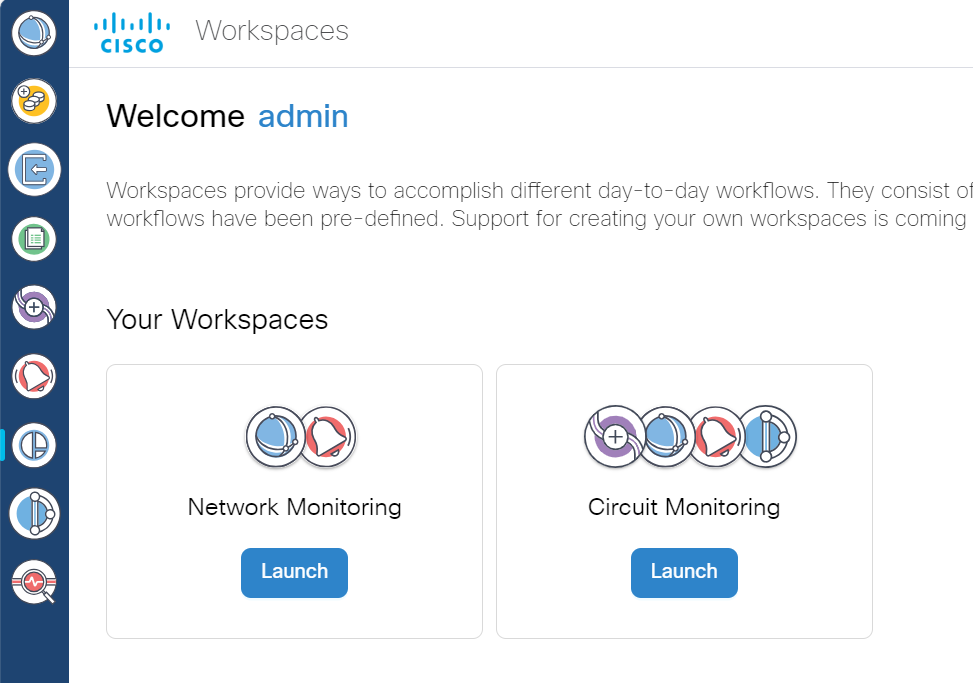
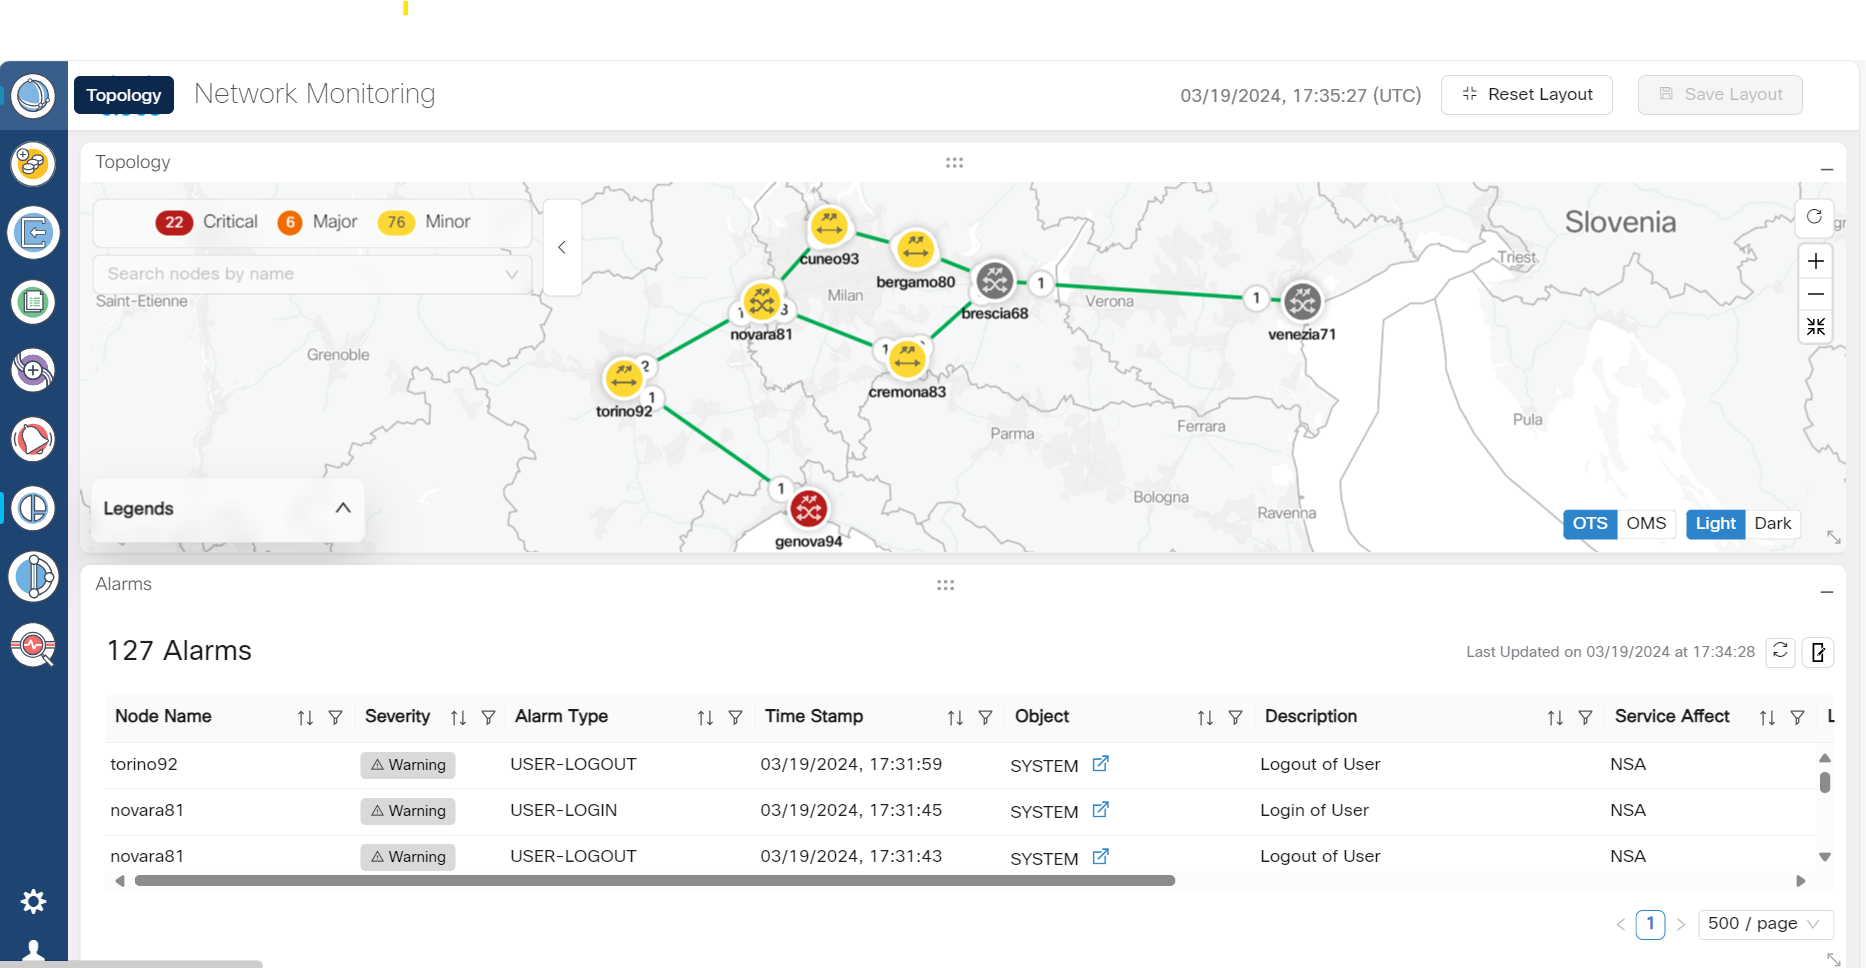
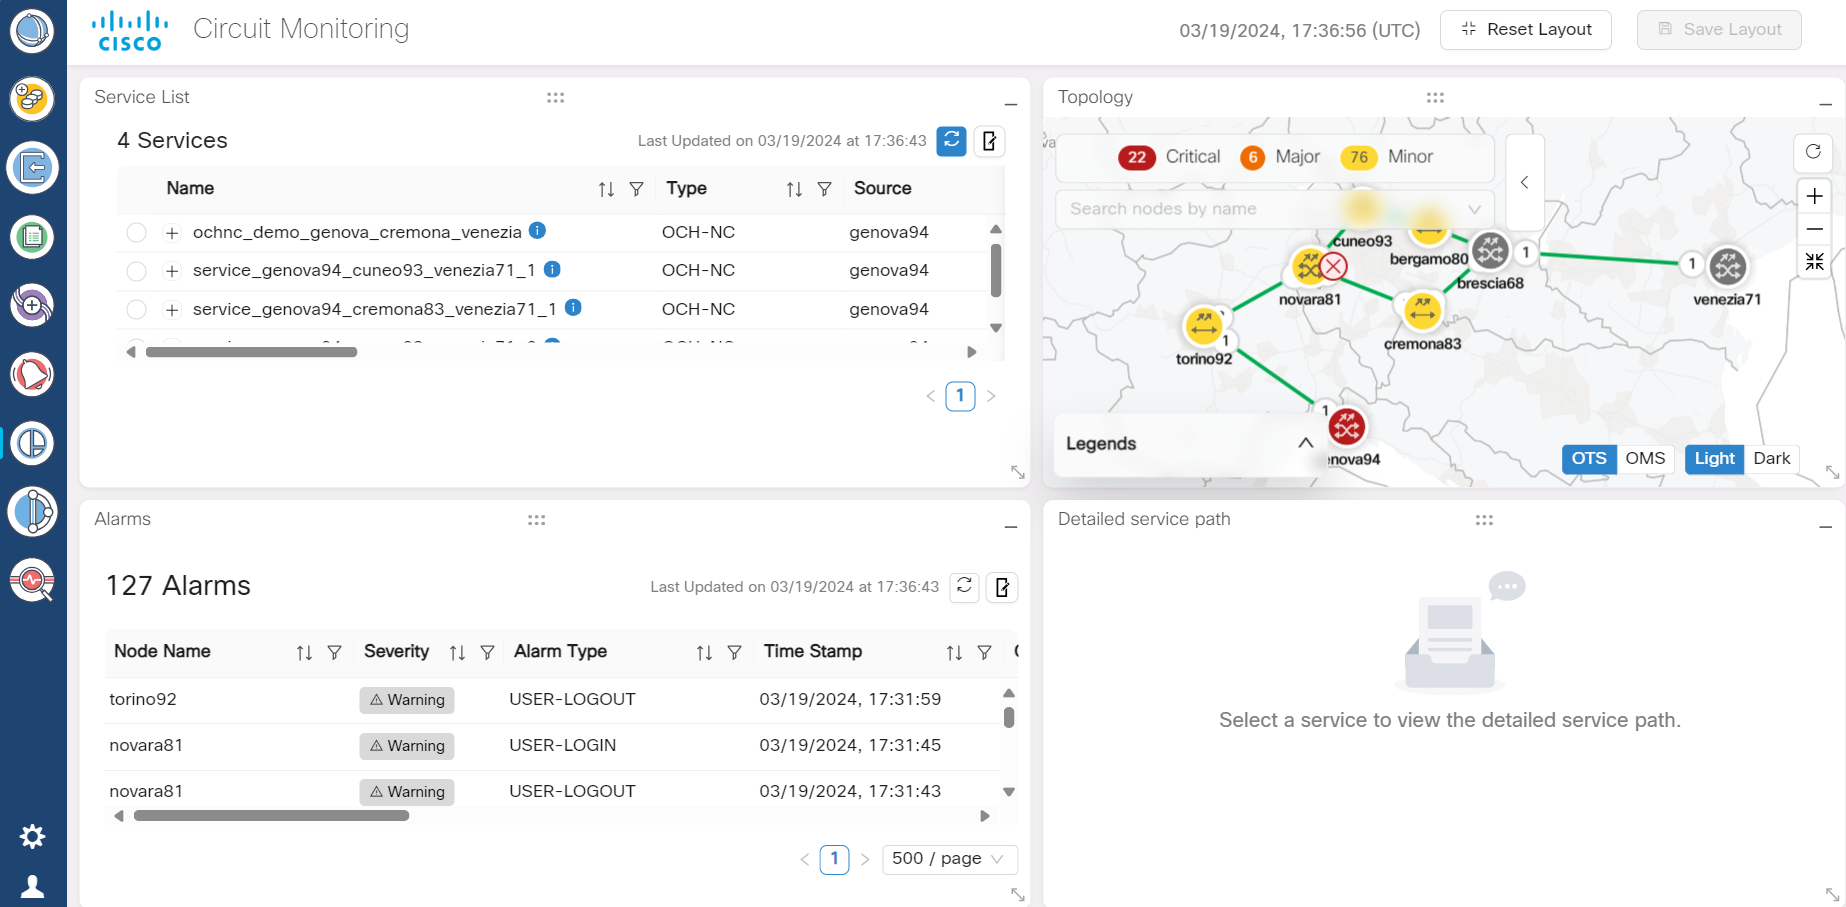
Workspaces option allows you to manage different workflows on a daily basis. The multiple standalone applications can interact with each other anytime and are displayed in multiple panels. The workflows available are Network Monitoring and Circuit Monitoring.

Figure 16. Workspaces
Screenshot of Workspaces
Figure 17. Workspaces Network Monitoring
Screenshot of Workspaces Network Monitoring

Note


In the network monitoring screen above, the alarm details are displayed based on the node or link which is selected from topology.


Figure 18. Workspaces Circuit Monitoring
Screenshot of Workspaces Circuit Monitoring

Note


  • In the Topology screen above, select any node or link and right click followed by Show service(s). This will display all the services related to the selected node or link in the services layout.

  • In the Alarms screen above, select any alarm and right click followed by Show Affected service(s). This will display all the services related to the selected alarm in the services layout.


There can be many such workflows that can be added to the workspace anytime. Also, the workspace panels are dynamic and interactive. By default, we can see the Alarms, Service List, Topology and Detailed Service Path panels. These individual panels can be dragged and dropped anywhere on the monitoring screen. They can also be minimized and maximized as necessary anytime.


Note


The alarms displayed here are applicable to the selected services only and not to the entire Topology. Also for multi carrier services, alarms are displayed for the selected carrier only.


Procedure


Step 1

Click Workspaces in the left panel.

Step 2

Select the workspace and click Launch.

Step 3

Click Save Layout to save the layout at any given point in time.

Step 4

Click Reset Layout to revert to the default layout.

Step 5

Some of the other options that are available on these panels are mentioned below.

  • Hovering on the nodes displays the node name and the alarm severity.

  • Hovering on the equipment displays the equipment name, service state as enabled or disabled and the count of the severity of the alarms.

  • Hovering on the port which is displayed as a round icon on the panel displays the port name, service state, and the alarms severity counts.

  • Connectivity between each equipment is highlighted with arrows.

  • If you right click at the node level it will cross launch to the Nodal UI to verify OXC's.

  • If you right click at the equipment level it will cross launch to View Nodal UI: Equipment.

  • If you right click on any port it will cross launch to View Nodal UI: Port.

  • Connectivity between the nodes are represented with arrows.


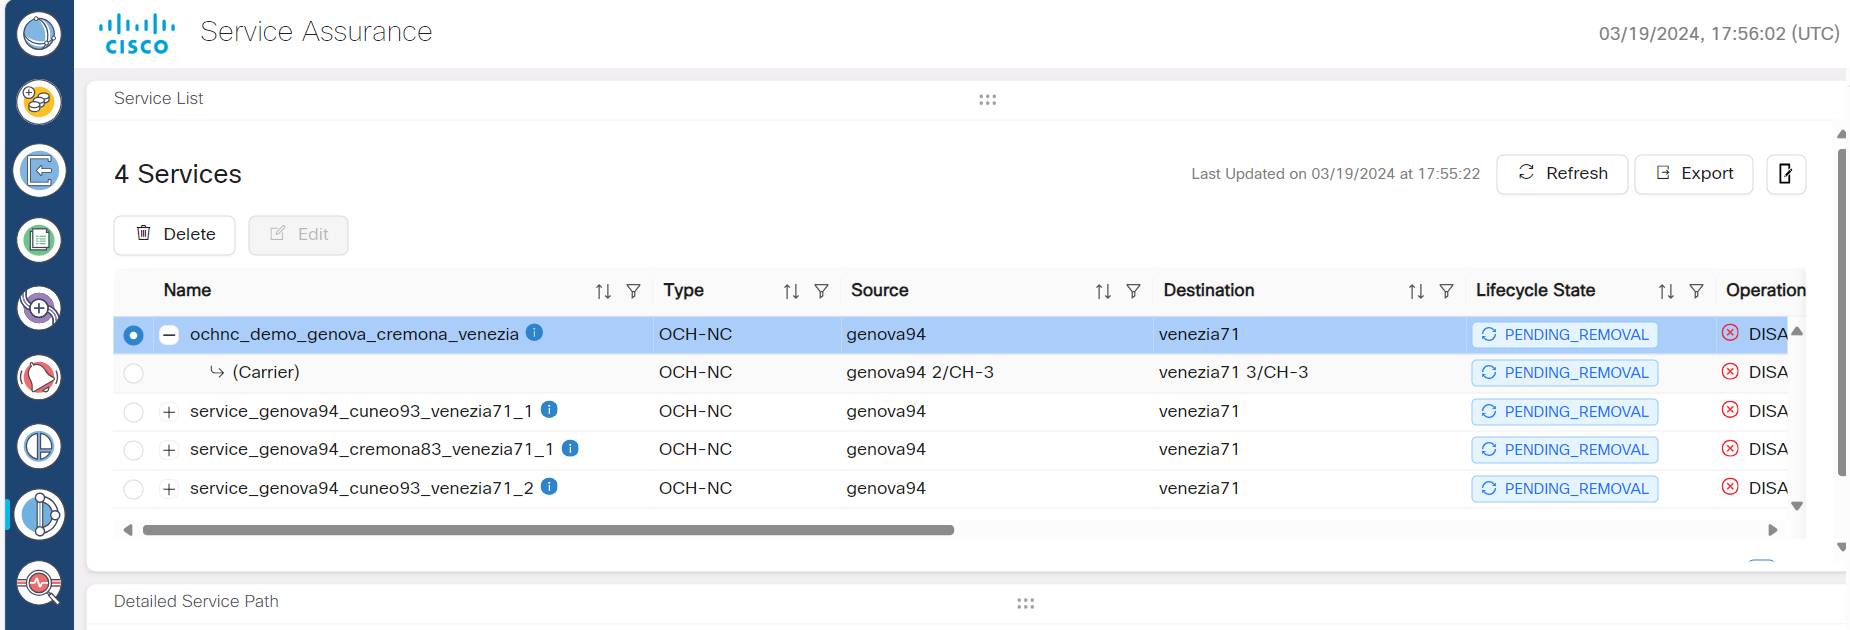
Service Assurance

Before you begin

The Service Assurance option helps in visualizing the circuits and the related nodes, links, and the circuit paths.

Figure 19. Service Assurance
Screenshot of Workspaces Service Assurance

Procedure


Step 1

Click Service Assurance in the left panel.

Step 2

Select the service from the Service List.

Step 3

In the Detailed Service Path layout, you can view the service details by hovering over the visual circuit for each node, ports, links, and paths of any service at any given time. These details are available when the Lifecycle State is either INSTALLED or DELETION FAILED.

Step 4

Click Export to export the details of the table from the screen to a spreadsheet file.


Monitoring

  • Audit Log: You can view the audit logs related to the user login or logout, device enrollment, device re-sync service for circuit create, delete or edit options. Also the create, edit or delete user options.

  • Detailed Node Resources: You can monitor the CPU, memory or disk consumption of the host.

  • Log Viewer: Displays the internal logs of microservices.

  • Pod Monitoring: You can monitor the CPU, memory or disk consumption of the microservices within the kubernetes cluster.

Before you begin

Use this option to view the log messages and other related details.

Procedure


Click to view each option separately.


General Troubleshooting

These are some generic troubleshooting points to consider which are common across the different applications within Cisco ONC.

  • Switchover happens: Refresh the page.

  • TAC case: In order to raise a TAC case, collect the sedo diagnostic logs with the command:
    sedo diagnostics archive-logs

    Collect it along with the Grafana view.