Liveness Monitoring
Liveness refers to the ability of the network to confirm that a specific path, segment, or a node is operational and capable of forwarding packets. Liveness checks are essential for maintaining network availability and reliability. See Configure PTP in System Management Configuration Guide for more information on configuring PTP.
Benefits
-
Fault Detection: You can quickly identify if a device is down, which allows for immediate response and troubleshooting.
-
Load Balancing: You can identify if the devices in a network are live, so work can be distributed more evenly across the network, preventing overloading of specific components and improving overall performance.
-
System Health: You can provide an ongoing snapshot of a system's health, helping to identify potential issues before they become significant problems.
-
Maintenance Planning: Liveness information can also help with maintenance planning, as system administrators can understand which components are live or down and plan maintenance and downtime accordingly without significant disruption to services.
-
Security: Regular liveness checks can also play a role in maintaining network security. Administrators can take proactive steps to mitigate the damage and prevent future incidents by identifying unusual activity that might indicate a security breach or attack.
You can determine liveness for SR Policy and IP Endpoint.
IP Endpoint Liveness Monitoring
|
Feature Name |
Release Information |
Feature Description |
|---|---|---|
|
Liveness Monitoring for IP Endpoint over SRv6 Network |
Release 24.2.11 |
This feature now extends support on the Cisco NCS 540 Series routers running on Cisco IOS XR7. |
|
Liveness Monitoring for IP Endpoint over SRv6 Network |
Release 24.2.1 |
Introduced in this release on the following Cisco NCS 540 router variants running on Cisco IOS XR:
In Segment Routing over an IPv6 network (SRv6), you can keep track of the operational status of both the forward and reverse paths of a particular node or IP endpoint. You can use this information for troubleshooting, network maintenance, and optimizing network performance. Additionally, you can use flow labels to verify the liveness of each subsequent hop path toward the IP endpoint of that path. So that, when network traffic is distributed across multiple available paths towards an IP endpoint, liveness detection tracks the operational status of each of these paths towards the IP endpoint. The feature introduces these changes: CLI:
YANG Data Model:
(see GitHub, YANG Data Models Navigator) |
|
IP Endpoint Delay Measurement and Liveness Monitoring |
Release 7.4.1 |
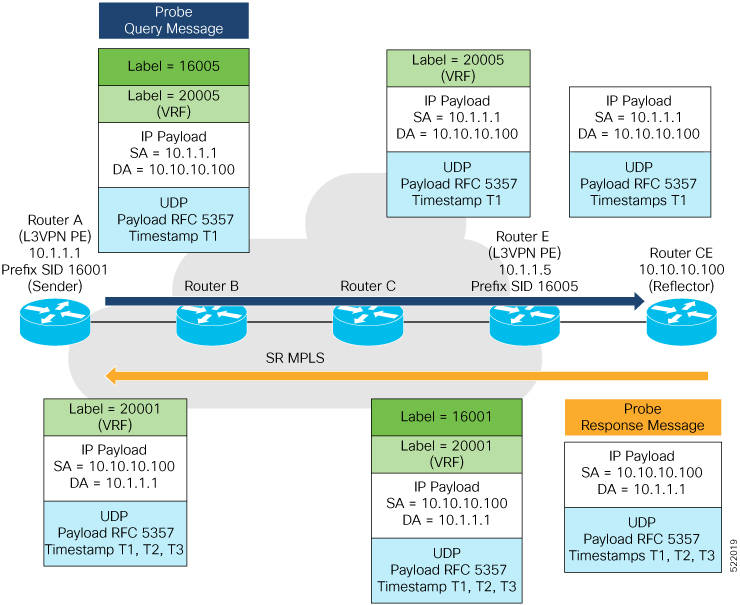
This feature measures the end-to-end delay and monitors liveness of a specified IP endpoint node, including VRF-aware (awareness of multiple customers belonging to different VRFs). This feature is supported on IPv4, IPv6, and MPLS data planes. |
The Segment Routing Performance Measurement (SR-PM) for IP endpoint liveness is a type of node liveness that involves testing whether an IP endpoint or a device identified by an IP address is available to send and receive data.
IP endpoint liveness is verified by sending a request to the IP address of the endpoint and waiting for a response. The probe could be an ICMP echo request (Ping), a TCP packet, a UDP packet, or any other type of packet that the endpoint would respond to.
-
If a response is received, the endpoint is considered live.
-
If no response is received within a certain time frame, the endpoint is considered down or unreachable.
IP endpoint dynamically measures the liveness towards a specified IP endpoint. IP endpoints can be located in a default or nondefault VRFs. IP endpoint is any device in the network a device identified by an IP address.
Liveness of an IP endpoint is verified by sending a request to the IP address of the endpoint and waiting for a response, which is referred to as a probe.
The endpoint of a probe is defined by an IP address, which can be either IPv4 or IPv6. This IP address can be any address that the sender can reach, such as a local interface or a remote node or host, either within an operator's network or accessible via a VRF.
The endpoint of a probe can be any IP address reachable by the sender. For example, a local interface or a remote node or host located within an operator's network or reachable through a VRF.
The IP address of the endpoint can be reached through an IP path, MPLS, LSP SRV6, or IP tunnel (GRE).
-
When the endpoint is reachable using an MPLS LSP (for example, SR, LDP, RSVP-TE, SR Policy), the forwarding stage imposes the corresponding MPLS transport labels.
-
When the endpoint is reachable via a GRE tunnel, the forwarding stage imposes the corresponding GRE header.
-
When the endpoint is reachable via a VRF in an MPLS network, the forwarding stage imposes the corresponding MPLS service labels. In the forward path, the sender node uses the configured VRF for the endpoint address. In the return path, the reflector node derives the VRF based on which incoming VRF label the probe packet is received with.
-
When the endpoint is reachable using SRv6, the forwarding stage imposes the SRv6 encapsulation.
You can configure the following parameters in the performance-measurement command:
-
Endpoint: The endpoint of a probe is defined by an IP address, which can be either IPv4 or IPv6. This IP address can be any address that the sender can reach, such as a local interface or a remote node or host, either within an operator's network or accessible via a VRF.
The endpoint of a probe can be any IP address reachable by the sender. For example, a local interface or a remote node or host located within an operator's network or reachable through a VRF.
Use the performance-measurement endpoint command to configure a probe endpoint source and destination addresses on a sender node.
-
VRF: You can define the endpoint point IP address belonging to a specific VRF. Use the performance-measurement endpoint {ipv4 | ipv6} ip_addr [vrf WORD] command to configure an endpoint to define the VRF. Endpoint segment list configuration is not supported under nondefault VRF.
-
VRF-awareness allows operators to deploy probes in the following scenarios:
-
Managed Customer Equipment (CE) scenarios:
-
PE to CE probes
-
CE to CE probes
-
-
Unmanaged Customer Equipment (CE) scenarios:
-
PE to PE probes
-
PE to PE (source from PE-CE interface) probes
-
-
-
-
Source address: You can define the source of the endpoint using the endpoint specific source address and the global source address.
Global source address configuration is applied to all the endpoints when the endpoint specific source address configuration isn’t specified. endpoint specific configuration overrides all the global source address configuration for those specific endpoints for which source addresses are configured.
For Micro-SID configuration for IPv4 endpoint sessions, if IPv6 global source address is configured, then it applies the configured global IPv6 source address for the IPv6 header in the SRv6 packet. If IPv6 global address is not configured, then It does not form a valid SRv6 packet.
You can use the source-address keyword under the performance-measurement command to define the global source address or use the keyword under performance-measurement endpoint to define endpoint specific source address.
-
Reverse Path: To detect the liveness of the reverse of the segment, you can configure the reverse path using the reverse-path command.
The default reverse path configured under the endpoint submode is only used for sessions with segment list. The endpoint session without a segment list does not support reverse path configuration and will not use this reverse path.
The reverse-path under the performance-measurement endpoint is used as the default reverse path if there are no reverse paths configured under the segment list.
Use the reverse-path under the performance-measurement endpoint segment-routing traffic-eng explicit segment-list name to configure the reverse path under segment list.
The reverse type must be the same as the forward path. Using different types for forward and reverse paths is not supported. For example, uSID forward path and uSID reverse path; MPLS forward path and MPLS reverse path.
User-configured segment-list can also represent the reverse path (reflector to sender) when probe is configured in liveness detection mode. Up to 128 segment-lists can be configured under a probe. An additional PM session is created for each segment-list. Segment-lists are configured under segment-routing traffic-eng segment-list submode. See SR-TE Policy with Explicit Path for details about configuring segment lists.
-
Flow Label: The flow label field in the IPv6 header is used to carry information that helps distribute traffic across multiple network paths. The flow label is a 20-bit field in the IPv6 header designed to carry information about the flow of packets, which routers can use to identify and differentiate between different traffic flows. Flow label sweeping uses a flow label to distribute the traffic load across multiple paths to the endpoint.
Use the flow-label keyword to configure flow label.
Usage Guidelines and Limitations
-
Liveness session without segment list for an endpoint in a non-default VRF is not supported.
-
Liveness on SRv6 is supported on Cisco NCS 5508 starting from Cisco IOS XR Release 24.3.1.
-
IPv6 Endpoint Liveness in Default VRF over SRv6 is not supported.
-
IP Endpoint in VRF without segment list, over SRv6 underlay (dynamic uDT6 or uDT4) is not supported
-
SR Performance Measurement endpoint session over BVI interface is not supported.
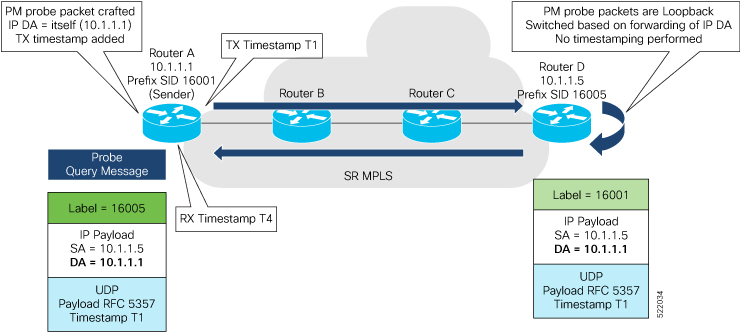
IP Endpoint Liveness Detection in an SR MPLS Network
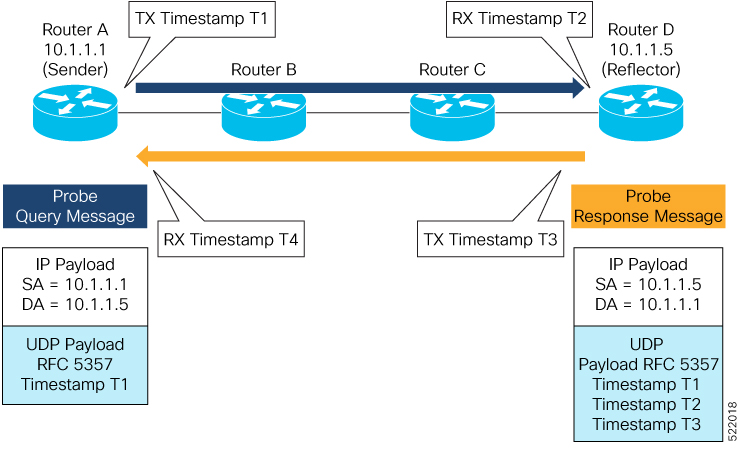
IP endpoint liveness detection leverages the loopback measurement-mode. The following workflow describes the sequence of events.
-
The sender creates and transmits the PM probe packets.
The IP destination address (DA) on the probe packets is set to the loopback value of the sender itself.
The transmit timestamp (T1) is added to the payload.
The probe packet is encapsulated with the label corresponding to the endpoint.
-
The network delivers the PM probe packets following the LSP toward the endpoint.
-
The end-point receives the PM probe packets.
Packets are forwarded back to the sender based on the forwarding entry associated with the IP DA of the PM probe packet. If an LSP exists, the probe packet is encapsulated with the label of the sender.
-
The sender node receives the PM probe packets.
The received timestamp (T4) stored.
If the sender node doesn't receive the specified number of probe packets (based on the configured multiplier), the sender node declares the PM session as down.
The following figure illustrates a liveness detection probe toward an IP endpoint learned by the IGP. The network interconnecting the sender and reflector provides MPLS connectivity with Segment Routing.
The liveness detection multiplier is set to 5 to specify the number of consecutive missed probe packets before the PM session is declared as down.
Configuration Example
RouterA(config)# performance-measurement
RouterA(config-perf-meas)# endpoint ipv4 10.1.1.5
RouterA(config-pm-ep)# source-address ipv4 10.1.1.1
RouterA(config-pm-ep)# liveness-detection
RouterA(config-pm-ep-ld)# exit
RouterA(config-pm-ep)# exit
RouterA(config-perf-meas)# liveness-profile endpoint default
RouterA(config-pm-ld-ep)# liveness-detection
RouterA(config-pm-ld-ep-ld)# multiplier 5
RouterA(config-pm-ld-ep-ld)# exit
RouterA(config-pm-ld-ep)# probe
RouterA(config-pm-ld-ep-probe)# measurement-mode loopback
Running Configuration
performance-measurement
 endpoint ipv4 10.1.1.5
  source-address ipv4 10.1.1.1
  liveness-detection
  !
 !
 liveness-profile endpoint default
  liveness-detection
   multiplier 5
  !
  probe
   measurement-mode loopback
  !
 !
!
end
Verification
RouterA# show performance-measurement endpoint ipv4 10.1.1.5

--------------------------------------------------------------------------------
0/RSP0/CPU0
--------------------------------------------------------------------------------

Endpoint name: IPv4-10.1.1.5-vrf-default
  Source address              : 10.1.1.1
  VRF name                    : default
  Liveness Detection          : Enabled
  Profile Keys:
    Profile name              : default
    Profile type              : Endpoint Liveness Detection

  Segment-list                : None
  Session State: Down
  Missed count: 0
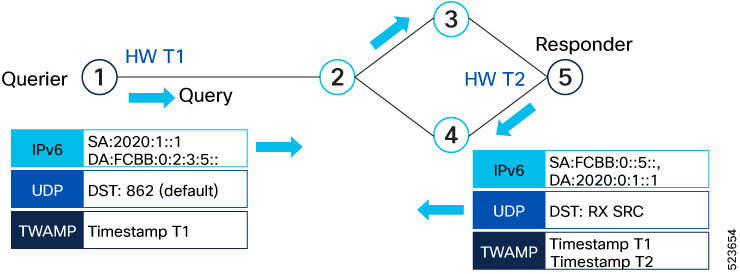
IP Endpoint Liveness in an SRv6 Network
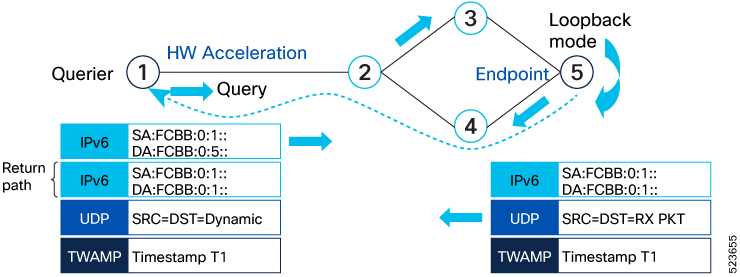
IP endpoint liveness detection leverages the loopback measurement-mode. The following workflow describes the sequence of events.
-
The sender creates and transmits the PM probe packets and sets the IP destination address (DA) on the probe packets to the loopback value of the sender itself. The sender adds the transmit timestamp (T1) to the payload and encapsulates the probe packet with the SRv6 labels corresponding to the endpoint.
-
The network delivers the PM probe packets by following the IPv6 or segment lists towards the endpoint.
-
The endpoint receives the PM probe packets.
-
The sender node receives the PM probe packets and stores the received timestamp. If the sender node doesn't receive the specified number of probe packets based on the configured multiplier, it declares the PM session down.
 Note |
Liveness is not supported for non-default VRF. |
Configuration Example
Router(config)#performance-measurement
Router(config-perf-meas)#source-address ipv6 2020:1::1
Router(config-perf-meas)#endpoint ipv6 FCBB:0::5::
Router(config-pm-ep)#exit
Router(config-perf-meas)#liveness-profile endpoint default
Router(config-pm-ld-ep)#probe
Router(config-pm-ld-ep-probe)#exit
Router(config-pm-ld-ep)#liveness-detection
Router(config-pm-ld-ep-ld)#multiplier 3
Router(config-pm-ld-ep-ld)#
The following example shows how to configure liveness with segment list and reverse path.
Router(config-sr)#traffic-eng
Router(config-sr-te)#segment-lists
Router(config-sr-te-segment-lists)#srv6
Router(config-sr-te-sl-global-srv6)#sid-format usid-f3216
Router(config-sr-te-sl-global-srv6)#exit
Router(config-sr-te-sl-global)#segment-list test
Router(config-sr-te-sl)#srv6
Router(config-sr-te-sl-srv6)#index 10 sid ff::2
Router(config-sr-te-sl-srv6)#index 20 sid ff::3
The following example shows how to configure liveness reverse path under segment list and under endpoint:
Router(config)#performance-measurement
Router(config-perf-meas)#endpoint ipv6 ff::2

/* Configure reverse path under segment list name *\
Router(config-pm-ep)#segment-routing traffic-eng explicit segment-list name fwd-path
Router(config-pm-ep-sl)#reverse-path segment-list name rev-path
Router(config-pm-ep-sl)#exit

/* Configure reverse path under performance measurement endpoint *\
Router(config-pm-ep)# segment-routing traffic-eng explicit reverse-path segment-list name rev-path-name
The following example shows how to configure liveness with flow label:
Router(config-perf-meas)#liveness-profile endpoint default
Router(config-pm-ld-ep)#probe
Router(config-pm-ld-ep-probe)#flow-label from 1000 to 20000 increment 16
Router(config-pm-ld-ep-probe)#liveness-detection
Router(config-pm-ld-ep-ld)#multiplier 3
The following example shows how to configure liveness with flow label sweeping:
Router#configure
Router(config)#performance-measurement
Router(config-perf-meas)#liveness-profile name profile-sweeping
Router(config-pm-ld-profile)# flow-label from 1000 to 20000 increment 16
Routerconfig-pm-ld-profile)#commit
Verification
Router# show performance-measurement endpoint detail
Endpoint name: IPv6-FCBB:0::5:::-vrf-default
  Source address              : 2020:1::1
  VRF name                    : default
  Liveness Detection          : Enabled
  Profile Keys:
    Profile name              : default
    Profile type              : Endpoint Liveness Detection
  Segment-list                : None
  Liveness Detection session:
    Session ID                : 4109
    Flow-label                : 1000
    Session State: Up
    Last State Change Timestamp: Jan 23 2024 16:06:01.214
    Missed count: 0

  Liveness Detection session:
    Session ID                : 4110
    Flow-label                : 2000
    Session State: Up
    Last State Change Timestamp: Jan 23 2024 16:06:01.214
    Missed count: 0

  Segment-list                : test-dm-two-carrier-sl2
    FCBB:0::5:2:e004::/64
      Format: f3216
    FCBB:0::5:3:e000::/64
      Format: f3216
    FCBB:0::5:2:e004::/64
      Format: f3216
    FCBB:0::5:2:e000::/64
      Format: f3216
    FCBB:0::5:1:e000::/64
      Format: f3216
    FCBB:0::5:1:e004::/64
      Format: f3216
    FCBB:0::5:4:e000::/64
      Format: f3216
    FCBB:0::5:4::/48
      Format: f3216
  Liveness Detection session:
    Session ID                : 4111
    Flow-label                : 1000
    Session State: Up
    Last State Change Timestamp: Jan 23 2024 16:06:01.217
    Missed count: 0

  Liveness Detection session:
    Session ID                : 4112
    Flow-label                : 2000
    Session State: Up
    Last State Change Timestamp: Jan 23 2024 16:06:01.217
    Missed count: 0
SR Policy Liveness Monitoring
|
Feature Name |
Release Information |
Feature Description |
|---|---|---|
|
SR Policy Liveness Monitoring on Segment Routing over IPv6 (SRv6) |
Release 7.11.1 |
In segment routing over IPv6 (SRv6), you can now verify end-to-end traffic forwarding over an SR policy candidate path by periodically sending probe messages. Performance monitoring on an SRv6 network enables you to track and monitor traffic flows at a granular level. Earlier releases supported SR policy liveness monitoring over an SR policy candidate path on MPLS. |
|
SR Performance Measurement Named Profiles |
Release 7.3.1 |
You can use this feature to create specific performance measurement delay and liveness profiles, and associate it with an SR policy. This way, a delay or liveness profile can be associated with a policy for which the performance measurement probes are enabled, and performance measurement is precise, and enhanced. The performance-measurement delay-profile sr-policy command was updated with the name profile keyword-argument combination. The performance-measurement liveness-profile sr-policy command was updated with the name profile keyword-argument combination. The performance-measurement delay-measurement command was updated with delay-profile name profile . The performance-measurement liveness-detection command was updated with liveness-profile name profile |
|
SR Policy Liveness Monitoring |
Release 7.3.1 |
This feature allows you to verify end-to-end traffic forwarding over an SR Policy candidate path by periodically sending performance monitoring packets. |
SR Policy liveness monitoring allows you to verify end-to-end traffic forwarding over an SR Policy candidate path by periodically sending performance monitoring (PM) packets. The head-end router sends PM packets to the SR policy's endpoint router, which sends them back to the head-end without any control-plane dependency on the endpoint router.
The following are benefits to using SR-PM liveness monitoring:
-
Allows both liveness monitoring and delay measurement using a single-set of PM packets as opposed to running separate monitoring sessions for each purpose. This improves the overall scale by reducing the number of PM sessions required.
-
Eliminates network and device complexity by reducing the number of monitoring protocols on the network (for example, no need for Bidirectional Failure Detection [BFD]). It also simplifies the network and device operations by not requiring any signaling to bootstrap the performance monitoring session.
-
Improves interoperability with third-party nodes because signaling protocols aren't required. In addition, it leverages the commonly supported TWAMP protocol for packet encoding.
-
Improves liveness detection time because PM packets aren't punted on remote nodes
-
Provides a common solution that applies to data-planes besides MPLS, including IPv4, IPv6, and SRv6.
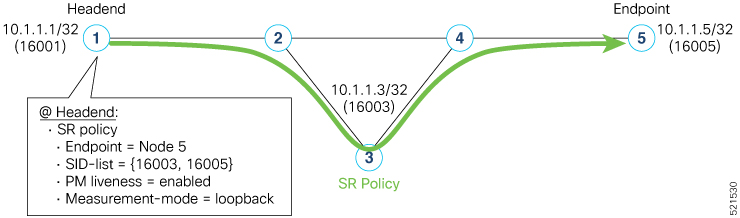
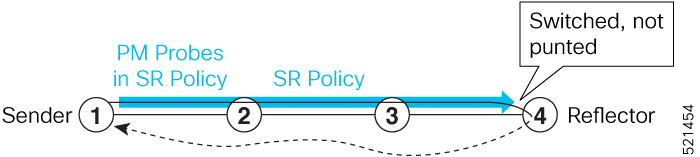
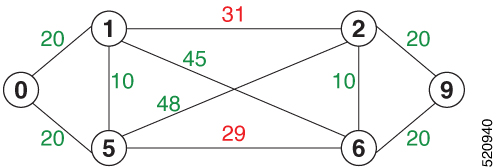
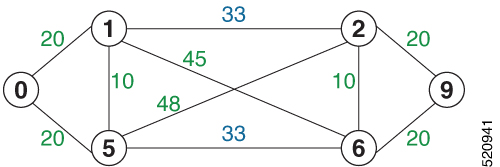
How it works?
The workflow associated with liveness detection over SR policy is described in the following sequence.
Consider an SR policy programmed at head-end node router 1 towards end-point node router 5. This SR policy is enabled for liveness detection using the loopback measurement-mode.
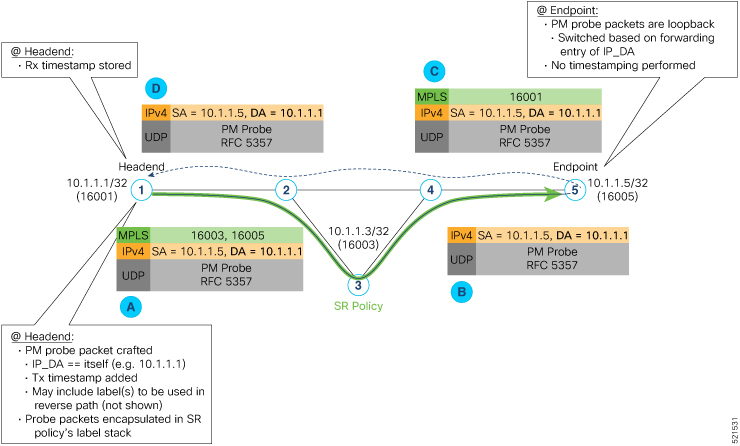
-
A: The head-end node creates and transmits the PM probe packets.
The IP destination address (DA) on the probe packets is set to the loopback value of the head-end node itself.
A transmit (Tx) timestamp is added to the payload.
Optionally, the head-end node may also insert extra encapsulation (labels) to enforce the reverse path at the endpoint node.
Finally, the packet is injected into the data-plane using the same encapsulation (label stack) of that of the SR policy being monitored.
-
B: The network delivers the PM probe packets as it would user traffic over the SR policy.
-
C: The end-point node receives the PM probe packets.
Packets are switched back based on the forwarding entry associated with the IP DA of the packet. This would typically translate to the end-point node pushing the prefix SID label associated with the head-end node.
If the head-end node inserted label(s) for the reverse path, then the packets are switched back at the end-point node based on the forwarding entry associated with the top-most reverse path label.
-
D: Headend node receives the PM probe packets.
A received (Rx) timestamp stored.
If the head-end node receives the PM probe packets, the head-end node assume that the SR policy active candidate path is up and working.
If the head-end node doesn't receive the specified number of consecutive probe packets (based on configured multiplier), the head-end node assumes the candidate path is down and a configured action is trigerred.
Usage Guidelines and Limitations
The following usage guidelines and limitations apply:
-
SR-PM liveness-detection over SR Policy is supported on manually configured SR Policies and On-Demand SR Policies (ODN).
-
SR-PM liveness-detection over SR Policy is not supported on PCE-initiated SR Policies.
-
SR-PM liveness-detection and delay-measurement aren't supported together
-
When liveness-profile isn't configured, SR Policies use the default values for the liveness-detection profile parameters.
-
The head-end router doesn’t load-balance the liveness probes across bundle member links.
Configure SR Policy Liveness Monitoring in an MPLS Network
Configuring SR Policy liveness monitoring involves the following steps:
-
Configuring a performance measurement liveness profile to customize generic probe parameters
-
Enabling liveness monitoring under SR Policy by associating a liveness profile, and customizing SR policy-specific probe parameters
Liveness monitoring parameters are configured under performance-measurement liveness-profile sub-mode. The following parameters are configurable:
-
liveness-profile sr-policy {default | name name}
Parameters defined under the sr-policy default liveneness-profile apply to any SR policy with liveness monitoring enabled and that does not reference a non-default (named) liveneness-profile.
-
probe: Configure the probe parameters.
-
measurement-mode: Liveness detection must use loopback mode (see Measurement Modes).
-
burst interval: Interval for sending probe packet. The default value is 3000 milliseconds and the range is from 30 to 15000 milliseconds.
-
tos dscp value: The default value is 48 and the range is from 0 to 63. You can modify the DSCP value of the probe packets, and use this value to priortize the probe packets from headend to tailend.
-
sweep destination ipv4 127.x.x.x range range: Configure SR Policy ECMP IP-hashing mode. Specifiy the number of IP addresses to sweep. The range is from 0 (default, no sweeping) to 128. The option is applicable to IPv4 packets.
Note
The destination IPv4 headendaddress 127.x.x.x – 127.y.y.y is used in the Probe messages to take advantages of 3-tuple IP hashing (source-address, destination-address, and local router ID) for ECMP paths of SR-MPLS Policy.
The destination IPv4 address must be 127/8 range (loopback), otherwise it will be rejected.
Note
One PM session is always created for the actual endpoint address of the SR Policy.
-
liveness-detection: Configure the liveness-detection parameters:
-
multiplier: Number of consecutive missed probe packets before the PM session is declared as down. The range is from 2 to 10, and the default is 3.
Note
The detection-interval is equal to (burst-interval * multiplier).
Enabling Liveness Monitoring under SR Policy
Enable liveness monitoring under SR Policy, associate a liveness-profile, and configure SR Policy-specific probe parameters under the segment-routing traffic-eng policy performance-measurement sub-mode. The following parameters are configurable:
-
liveness-detection: Enables end-to-end SR Policy Liveness Detection for all segment-lists of the active and standby candidate-path that are in the forwarding table.
-
liveness-profile name name: Specifies the profile name for named profiles.
-
invalidation-action {down | none}:
-
Down (default): When the PM liveness session goes down, the candidate path is immediately operationally brought down.
-
None: When the PM liveness session goes down, no action is taken. If logging is enabled, the failure is logged but the SR Policy operational state isn’t modified.
-
-
logging session-state-change: Enables Syslog messages when the session state changes.
-
reverse-path label {BSID-value | NODE-SID-value}: Specifies the MPLS label to be used for the reverse path for the reply. If you configured liveness detection with ECMP hashing, you must specify the reverse path. The default reverse path uses IP Reply.
-
BSID-value: The Binding SID (BSID) label for the reverse SR Policy. (This is practical for manual SR policies with a manual BSID.)
-
NODE-SID-value: The absolute SID label of the (local) Sender Node to be used for the reverse path for the reply.
-
Configuration Examples
Configure a Default SR-Policy PM Liveness-Profile
The following example shows a default sr-policy liveness-profile:
RP/0/RSP0/CPU0:ios(config)# performance-measurement
RP/0/RSP0/CPU0:ios(config-perf-meas)# liveness-profile sr-policy default
RP/0/RSP0/CPU0:ios(config-pm-ld-srpolicy)# probe
RP/0/RSP0/CPU0:ios(config-pm-ld-srpolicy-probe)# measurement-mode loopback
RP/0/RSP0/CPU0:ios(config-pm-ld-srpolicy-probe)# burst-interval 1500
RP/0/RSP0/CPU0:ios(config-pm-ld-srpolicy-probe)# tos dscp 52
RP/0/RSP0/CPU0:ios(config-pm-ld-srpolicy-probe)# exit
RP/0/RSP0/CPU0:ios(config-pm-ld-srpolicy)# liveness-detection
RP/0/RSP0/CPU0:ios(config-pm-ld-srpolicy-ld)# multiplier 5
Running Configuration:
performance-measurement
 liveness-profile sr-policy default
  liveness-detection
   multiplier 5
  !
  probe
   tos dscp 52
   measurement-mode loopback
   burst-interval 1500
  !
 !
!
end
Configure a Named (Non-Default) SR-Policy PM Liveness-Profile
The following example shows a named sr-policy liveness-profile:
RP/0/RSP0/CPU0:ios(config)# performance-measurement
RP/0/RSP0/CPU0:ios(config-perf-meas)# liveness-profile name sample-profile
RP/0/RSP0/CPU0:ios(config-pm-ld-srpolicy)# probe
RP/0/RSP0/CPU0:ios(config-pm-ld-srpolicy-probe)# measurement-mode loopback
RP/0/RSP0/CPU0:ios(config-pm-ld-srpolicy-probe)# burst-interval 1500
RP/0/RSP0/CPU0:ios(config-pm-ld-srpolicy-probe)# tos dscp 52
RP/0/RSP0/CPU0:ios(config-pm-ld-srpolicy-probe)# exit
RP/0/RSP0/CPU0:ios(config-pm-ld-srpolicy)# liveness-detection
RP/0/RSP0/CPU0:ios(config-pm-ld-srpolicy-ld)# multiplier 5
Running Configuration:
performance-measurement
 liveness-profile sr-policy name sample-profile
  liveness-detection
   multiplier 5
  !
  probe
   tos dscp 52
   measurement-mode loopback
   burst-interval 1500
  !
 !
!
end
Configure a SR-Policy PM Liveness-Profile with Sweep Parameters
The following example shows a named liveness-profile with sweep parameters:
RP/0/RSP0/CPU0:ios(config)# performance-measurement
RP/0/RSP0/CPU0:ios(config-perf-meas)# liveness-profile name sample-profile
RP/0/RSP0/CPU0:ios(config-pm-ld-srpolicy)# probe
RP/0/RSP0/CPU0:ios(config-pm-ld-srpolicy-probe)# measurement-mode loopback
RP/0/RSP0/CPU0:ios(config-pm-ld-srpolicy-probe)# burst-interval 1500
RP/0/RSP0/CPU0:ios(config-pm-ld-srpolicy-probe)# tos dscp 52
RP/0/RSP0/CPU0:ios(config-pm-ld-srpolicy-probe)# sweep
RP/0/RSP0/CPU0:ios(config-pm-ld-srpolicy-probe-sweep)# destination ipv4 127.0.0.1 range 25
RP/0/RSP0/CPU0:ios(config-pm-ld-srpolicy-probe-sweep)# exit
RP/0/RSP0/CPU0:ios(config-pm-ld-srpolicy-probe)# exit
RP/0/RSP0/CPU0:ios(config-pm-ld-srpolicy)# liveness-detection
RP/0/RSP0/CPU0:ios(config-pm-ld-srpolicy-ld)# multiplier 5
Running Configuration
performance-measurement
 liveness-profile sr-policy name sample-profile
  liveness-detection
   multiplier 5
  !
  probe
   tos dscp 52
   sweep
    destination ipv4 127.0.0.1 range 25
   !
   measurement-mode loopback
   burst-interval 1500
  !
 !
!
end
Enable Liveness Monitoring Under SR Policy
The following example shows how to enable liveness monitoring under SR Policy, associate a liveness-profile, and configure the invalidation action:
RP/0/RSP0/CPU0:ios(config)# segment-routing traffic-eng
RP/0/RSP0/CPU0:ios(config-sr-te)# policy FOO
RP/0/RSP0/CPU0:ios(config-sr-te-policy)# performance-measurement
RP/0/RSP0/CPU0:ios(config-sr-te-policy-perf-meas)# liveness-detection
RP/0/RSP0/CPU0:ios(config-sr-te-policy-live-detect)# liveness-profile name sample-profile
RP/0/RSP0/CPU0:ios(config-sr-te-policy-live-detect)# invalidation-action none
Running Config
segment-routing
 traffic-eng
  policy FOO
   performance-measurement
    liveness-detection
     liveness-profile name sample-profile
     invalidation-action none
    !
   !
  !
 !
!
end
Enable Liveness Monitoring under SR Policy with Optional Parameters
The following example shows how to enable liveness monitoring under SR Policy, associate a liveness-profile, and configure reverse path label and session logging:
RP/0/RSP0/CPU0:ios(config)# segment-routing traffic-eng
RP/0/RSP0/CPU0:ios(config-sr-te)# policy BAA
RP/0/RSP0/CPU0:ios(config-sr-te-policy)# performance-measurement
RP/0/RSP0/CPU0:ios(config-sr-te-policy-perf-meas)# liveness-detection
RP/0/RSP0/CPU0:ios(config-sr-te-policy-live-detect)# liveness-profile name sample-profile
RP/0/RSP0/CPU0:ios(config-sr-te-policy-live-detect)# invalidation-action down
RP/0/RSP0/CPU0:ios(config-sr-te-policy-live-detect)# logging session-state-change
RP/0/RSP0/CPU0:ios(config-sr-te-policy-live-detect)# exit
RP/0/RSP0/CPU0:ios(config-sr-te-policy-perf-meas)# reverse-path label 16001
Running Config
segment-routing
 traffic-eng
  policy BAA
   performance-measurement
    liveness-detection
     logging
      session-state-change
     !
     liveness-profile name sample-profile
     invalidation-action down
    !
    reverse-path
     label 16001
    !
   !
  !
 !
!
end
Configure Segment Lists to Activate Candidate Paths in SRv6 for PM Liveness
|
Feature Name |
Release Information |
Feature Description |
|---|---|---|
|
Configure Segment Lists to Activate Candidate Paths in SRv6 for PM Liveness |
Release 7.11.1 |
You can now enable a candidate path to be up by configuring the minimum number of active segment lists associated with the candidate path. The head-end router determines that a candidate path is up based on the minimum number of active segment lists configured. In earlier releases, the head-end router identified a candidate path as up only when all the segment lists associated with the path were active. The feature introduces these changes: CLI:
YANG Data Models:
See (GitHub, Yang Data Models Navigator) |
The state of the segment lists in a candidate path determines whether a candidate path is up or down. You can now configure the minimum number of active segment lists associated with a candidate path. The head-end router identifies a candidate path as up when one or more segment lists are active.
Note |
If the configured minimum number of active segment lists is greater than the number of available segment lists in a candidate path, the head-end router determines the candidate path as up only when all the segment lists are active. |
In earlier releases, the router identified a candidate path as up only when all the segment lists associated with the path were active.
Configuration Example
Configure the minimum number of segment lists in SRv6
Perform this task to activate three segment lists to have the PM liveness session up:
Router(config)#segment-routing
Router(config-sr)#traffic-eng
Router(config-sr-te)#policy po-103
Router(config-sr-te-policy)#performance-measurement
Router(config-sr-te-policy-perf-meas)#liveness-detection
Router(config-sr-te-policy-live-detect)#validation-cp minimum-active segment-lists 3
Show Running Configuration
segment-routing
 traffic-eng
  policy po-103
   performance-measurement
    liveness-detection
     validation-cp minimum-active segment-lists 3
    !
   !
  !
 !
!
Verification
Router#show performance-measurement sr-policy liveness color 103 detail verbose private
Mon Oct 30 15:10:51.863 EDT

----------------------------------------------------------------------------------------------------------------------------------------------------------------
0/1/CPU0
----------------------------------------------------------------------------------------------------------------------------------------------------------------

SR Policy name: srte_c_103_ep_3::1
  Color                       : 103
  SRv6 Encap Source Address   : 1::1
  Endpoint                    : 3::1
  Handle                      : 0x00000000
  Policy to be deleted        : False
  Number of candidate-paths   : 1

  Candidate-Path:
    Instance                  : 5
    Preference                : 300
    Protocol-origin           : Configured
    Discriminator             : 300
    Profile Keys:
      Profile name            : default
      Profile type            : SR Policy Liveness Detection
    Candidate path to be deleted: False
    Source address            : 1::1
    Local label               : Not set
    Fast notification for session down: Disabled
      No fast notifications have been sent
    Number of segment-lists   : 3
    Liveness Detection: Enabled
      Minumum SL Up Required: 1
      Session State: Up
      Last State Change Timestamp: Oct 30 2023 15:10:16.322
      Missed count: 0

    Segment-List              : sl-1041
      fccc:cc00:1:fe10:: (Local Adjacency SID)
      fccc:cc00:2:fe41::/64
        Format: f3216
      Segment List ID: 0
      Reverse path segment-List: Not configured
      Segment-list to be deleted: False
      Number of atomic paths  : 1
      Liveness Detection: Enabled
        Session State: Up
        Last State Change Timestamp: Oct 30 2023 15:10:16.322
        Missed count: 0

      Atomic path:
        Flow Label            : 0
        Session ID            : 4198
        Trace ID              : 738913600
        Atomic path to be deleted: False
        NPU Offloaded session : False
        Timestamping Enabled  : True
        Liveness Detection: Enabled
          Session State: Up
          Last State Change Timestamp: Oct 30 2023 15:10:16.322
          Missed count: 0
        Responder IP          : 1::1
        Number of Hops        : 3

    Segment-List              : sl-1042
      fccc:cc00:1:fe10:: (Local Adjacency SID)
      fccc:cc00:2:fe42::/64
        Format: f3216
      Segment List ID: 0
      Reverse path segment-List: Not configured
      Segment-list to be deleted: False
      Number of atomic paths  : 1
      Liveness Detection: Enabled
        Session State: Up
        Last State Change Timestamp: Oct 30 2023 15:10:16.322
        Missed count: 0

      Atomic path:
        Flow Label            : 0
        Session ID            : 4199
        Trace ID              : 954039677
        Atomic path to be deleted: False
        NPU Offloaded session : False
        Timestamping Enabled  : True
        Liveness Detection: Enabled
          Session State: Up
          Last State Change Timestamp: Oct 30 2023 15:10:16.322
          Missed count: 0
        Responder IP          : 1::1
        Number of Hops        : 3

    Segment-List              : sl-1043
      fccc:cc00:1:fe10:: (Local Adjacency SID)
      fccc:cc00:2:fe43::/64
        Format: f3216
      Segment List ID: 0
      Reverse path segment-List: Not configured
      Segment-list to be deleted: False
      Number of atomic paths  : 1
      Liveness Detection: Enabled
        Session State: Up
        Last State Change Timestamp: Oct 30 2023 15:10:16.322
        Missed count: 0

      Atomic path:
        Flow Label            : 0
        Session ID            : 4200
        Trace ID              : 1119107116
        Atomic path to be deleted: False
        NPU Offloaded session : False
        Timestamping Enabled  : True
        Liveness Detection: Enabled
          Session State: Up
          Last State Change Timestamp: Oct 30 2023 15:10:16.322
          Missed count: 0
        Responder IP          : 1::1
        Number of Hops        : 3

----------------------------------------------------------------------------------------------------------------------------------------------------------------
0/RSP0/CPU0
----------------------------------------------------------------------------------------------------------------------------------------------------------------
Configure Flow Labels in SRv6 Header for PM Liveness
|
Feature Name |
Release Information |
Feature Description |
|---|---|---|
|
Configure Flow Labels in SRv6 Header for PM Liveness |
Release 7.11.1 |
You can now monitor the activeness of multiple paths for a given segment list using flow labels in the SRv6 header. In earlier releases, the SRv6 header didn't include flow labels. The feature introduces these changes: CLI:
YANG Data Models:
See (GitHub, Yang Data Models Navigator) |
To monitor the activeness of multiple paths for a given a segment list, you can configure the SRv6 header to include flow labels as the packet travels in the network. When there are multiple paths, different traffic flows may use different paths. A flow label is a flow identifier and you can use different flow labels to monitor different ECMP paths. It's only used for IPv6 probe packets. Flow labels are 20-bit fields in the SRv6 header.
Configure flow labels in the SRv6 header
Perform the following task in the global configuration mode to configure flow labels in the SRv6 header:
Router#configure
Router(config)#performance-measurement
Router(config-perf-meas)#liveness-profile name name1
Router(config-pm-ld-profile)#probe flow-label from 0 to 1000000 increment 10
Running Configuration
performance-measurement
 liveness-profile name name1
  probe
   flow-label from 0 to 1000000 increment 10
  !
 !
!
Verification
Router#show performance-measurement sr-policy liveness color 1001 detail verbose private

Mon Oct 30 15:25:55.241 EDT

----------------------------------------------------------------------------------------------------------------------------------------------------------------
0/1/CPU0
----------------------------------------------------------------------------------------------------------------------------------------------------------------

SR Policy name: srte_c_1001_ep_3::1
  Color                       : 1001
  SRv6 Encap Source Address   : 1::1
  Endpoint                    : 3::1
  Handle                      : 0x00000000
  Policy to be deleted        : False
  Number of candidate-paths   : 1

  Candidate-Path:
    Instance                  : 3
    Preference                : 300
    Protocol-origin           : Configured
    Discriminator             : 300
    Profile Keys:
      Profile name            : profile-scale
      Profile type            : Generic Liveness Detection
    Candidate path to be deleted: False
    Source address            : 1::1
    Local label               : Not set
    Fast notification for session down: Disabled
      No fast notifications have been sent
    Number of segment-lists   : 2
    Liveness Detection: Enabled
      Minumum SL Up Required: 2
      Session State: Up
      Last State Change Timestamp: Oct 26 2023 15:31:43.478
      Missed count: 0

    Segment-List              : sl-1041
      fccc:cc00:1:fe10:: (Local Adjacency SID)
      fccc:cc00:2:fe41::/64
        Format: f3216
      Segment List ID: 0
      Reverse path segment-List: Not configured
      Segment-list to be deleted: False
      Number of atomic paths  : 2
      Liveness Detection: Enabled
        Session State: Up
        Last State Change Timestamp: Oct 26 2023 15:31:43.478
        Missed count: 0

      Atomic path:
        Flow Label            : 0
        Session ID            : 4178
        Trace ID              : 280178832
        Atomic path to be deleted: False
        NPU Offloaded session : False
        Timestamping Enabled  : True
        Liveness Detection: Enabled
          Session State: Up
          Last State Change Timestamp: Oct 26 2023 15:31:43.478
          Missed count: 0
        Responder IP          : 1::1
        Number of Hops        : 3

      Atomic path:
        Flow Label            : 10
        Session ID            : 4179
        Trace ID              : 1866227171
        Atomic path to be deleted: False
        NPU Offloaded session : False
        Timestamping Enabled  : True
        Liveness Detection: Enabled
          Session State: Up
          Last State Change Timestamp: Oct 26 2023 15:31:43.478
          Missed count: 0
        Responder IP          : 1::1
        Number of Hops        : 3

    Segment-List              : sl-scale
      fccc:cc00:1:fe10:: (Local Adjacency SID)
      fccc:cc00:2:fed1::/64
        Format: f3216
      Segment List ID: 0
      Reverse path segment-List: Not configured
      Segment-list to be deleted: False
      Number of atomic paths  : 2
      Liveness Detection: Enabled
        Session State: Up
        Last State Change Timestamp: Oct 26 2023 15:31:43.478
        Missed count: 0

      Atomic path:
       Flow Label            : 0
        Session ID            : 4180
        Trace ID              : 2609815826
        Atomic path to be deleted: False
        NPU Offloaded session : False
        Timestamping Enabled  : True
        Liveness Detection: Enabled
          Session State: Up
          Last State Change Timestamp: Oct 26 2023 15:31:43.478
          Missed count: 0
        Responder IP          : 1::1
        Number of Hops        : 3

      Atomic path:
        Flow Label            : 10
        Session ID            : 4181
        Trace ID              : 170501506
        Atomic path to be deleted: False
        NPU Offloaded session : False
        Timestamping Enabled  : True
        Liveness Detection: Enabled
          Session State: Up
          Last State Change Timestamp: Oct 26 2023 15:31:43.478
          Missed count: 0
        Responder IP          : 1::1
        Number of Hops        : 3

----------------------------------------------------------------------------------------------------------------------------------------------------------------
0/RSP0/CPU0
----------------------------------------------------------------------------------------------------------------------------------------------------------------
SR Policy Liveness Monitoring - Hardware Offloading
|
Feature Name |
Release |
Description |
||
|---|---|---|---|---|
|
SR Policy Liveness Monitoring - Hardware Offloading |
Release 7.10.1 |
You can now hardware offload the liveness monitoring in performance measurement to the router hardware, which is the Network Processing Unit (NPU). This feature helps you optimize and scale the measurement operation, helping you meet delay-bound Service Level Agreements (SLAs). Previously, this feature was software driven. The feature introduces a new keyword npu-offload under the performance-measurement liveness-profile name liveness profile command.
|
Performance Measurement (PM) hardware offload feature allows the offload of PM liveness monitoring session to the Network Processing Unit (NPU) on the platform, which considerably improves scale and reduces the overall network convergence detection time.
This improvement is done by sending rapid failure detection probes (messages) and detecting policy or path failures quickly and help routing protocols in recalculating the routing table.
This feature is required in order to quickly react on delay-bound Service Level Agreement (SLAs), for example 5G low-latency, where SRTE policy can quickly re-optimize once the SLA is violated.
Advantages of the PM Hardware Offloading feature are as listed:
-
Probes are sent every 3.3 milliseconds
-
Complete liveness of the endpoint is now reduced to 10ms from 50ms when the operator configures the multiplier to be 3 (10ms = 3.3ms * 3).
-
Currently, the hardware offload supports only liveness monitoring .
Note |
The hardware offload does not support delay and loss measurement yet. |
Usage Guidelines and Limitations
The following usage guidelines and limitations apply:
-
The NPU offload generates PM probes (Packets Per Second) with a maximum limit. PPS is directly proportional with the number of sessions and transmit interval. If the PPS exceeds the limit supported by the offload engine, the stretch algorithm activates. This algorithm doubles the transmit interval until the PPS is within the supported limit. Use 'show performance-measurement pps' command to verify the maximum probes per second (PPS) supported by offload engine and total pps currently in use.
Configuration Example
Note |
The Hw-module profile offload 4 command is a prerequisite for LC CPU sessions to work. Once you use the ‘hw-module profile offload 4’ command, the Bidirectional Forwarding Detection for IPv6 (BFDv6) will not work even if the Performance Measurement sessions are hosted only on LC CPU and not offloaded to the offload processor. Use the 4th option 4 PM-HW-Offload and Bsync in hw-module profile offload command to configure the Hardware Profile Offloading. |
The following example allows you to enable Performance Measurement Liveness Hardware (NPU) offload in the SR environment.
Router(config)#performance-measurement
Router(config-perf-meas)#liveness-profile name hwo_profile
Router(config-pm-ld-profile)#npu-offload
Router(config-pm-ld-profile-npu-offload)#commit
Running Configuration
The running configuration for this feature is as shown:
performance-measurement
 liveness-profile name
  npu-offload
  !
 !
!
Verification
Use the show command to verify the running configuration as shown:
Router# show performance-measurement sessions detail

Transport type : SR Policy
Measurement type : Liveness Detection
Policy name : srte_c_90005_ep_10.2.2.2
Color : 90005
Endpoint : 10.2.2.2
Instance : 7
preference : 20
Protocol-origin : Configured
Discriminator : 20
Segment-list : route_12_2
Atomic path:
Hops : 10.2.2.2
Session ID : 45
Trace ID : 3111803555
NPU Offloaded session : True
NPU number : 0
NPU session state : Session created
Retry count : 0
Last NPU notification:
Session state : Up
Timestamp : Feb 28 2023 16:28:09.411
Timestamping Enabled : True
Liveness Detection: Enabled
Session State: Up
Last State Change Timestamp: Feb 28 2023 16:28:09.411
Missed count: 0 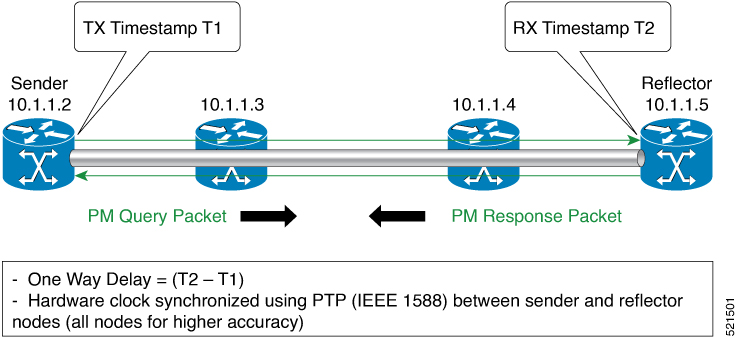
 Feedback