Build Intelligence on the Router Using AI-Driven Telemetry

Table 1. Feature History Table

Feature Name

Release Information

Description

AI-driven telemetry (ADT)

Release 7.3.1

This feature leverages machine learning to detect and retrieve important network-state changes on the router. Relevant data is filtered and exported to the network management system for analysis or troubleshooting purposes.

ADT significantly simplifies the configuration of streaming telemetry, and you are no longer required to manually choose sensor paths or tune the cadence at which counters have to be collected.


Note


Starting from Release 24.3.1, Cisco AI-Driven Telemetry is not supported.


Cisco IOS XR offers a rich set of sensor paths that help you stream telemetry data about your network using model-driven telemetry (MDT). However, this rich offering of sensor paths leads to the following questions:

  • Which sensor paths do I have to subscribe to?

  • When do I know that the state of the system has changed, and which parameters do I look for troubleshooting purposes?

  • How do I map between my router configuration and the sensor paths that I must monitor?

  • Can I get the state changes in an automated, unsupervised, and data-driven way?

  • Can I automatically filter a small set of sensor paths that properly portray an event?

AI-Driven Telemetry (ADT) is the answer to all these questions.

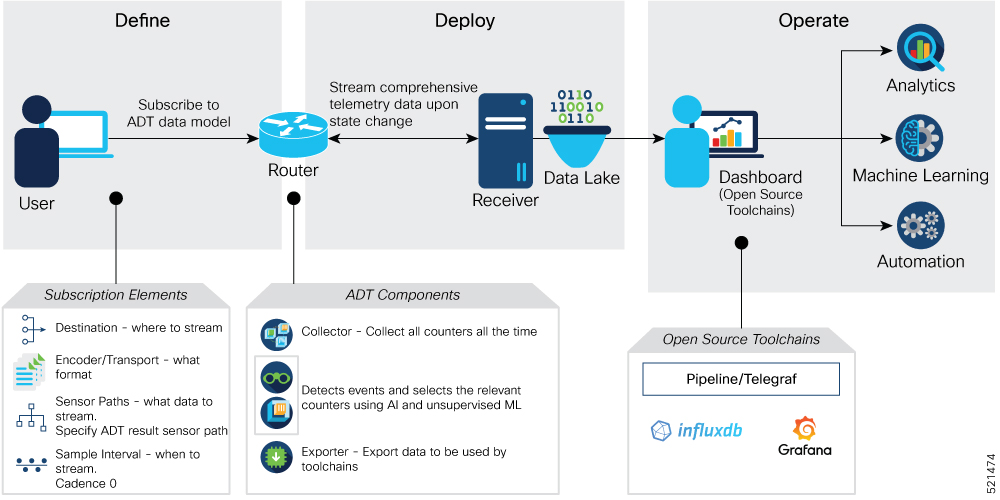
This article describes ADT, a component of the Cisco IOS XR operating system. ADT leverages machine learning (ML) and artificial intelligence (AI) to detect and describe important state changes on the router, and export only the relevant data using telemetry.

ADT eases streaming telemetry data and does not require the complex configurations of MDT. MDT supports streaming telemetry data at a configured cadence, or when an event occurs in the network. However, with MDT, not all telemetry data can be exported by the router at high frequencies. You must choose and subscribe to only a subset of the available information. Data availability does not mean that the data is easily consumable. You may miss some events generated within a cadence duration, either because you did not subscribe to the appropriate sensor paths or data models, or because the sampling rate was too coarse. On the other hand, you may be overwhelmed with redundant information, because a single event is represented through a large set of correlated counters.

ADT provides data-correlation and filtering on the router so that the router exports only the relevant data to network management systems (NMS). ADT correlates data by detecting important state changes on the router using a multivariate, unsupervised machine learning approach. ADT significantly simplifies the configuration of streaming telemetry. You are not required to choose the set of sensor paths (counters) to collect from the system, nor tune the cadence. ADT describes a change in the state of the router by choosing a small set of representative counters that best portray the change. The results of ADT change detection and description are provided as event-driven streaming telemetry using YANG model.

Consider a scenario where a bidirectional forwarding detection (BFD) session is enabled. Ideally, the system must filter a set of counters that are related to BFD. ADT uses automated feature selection process, wherein, in addition to streaming BFD-related counters, ADT might also highlight counters related to CPU. This is because BFD changes can trigger route re-calculation and eventually CPU occupancy. This shows that ADT learns the associated configuration in a system, and streams a representative 
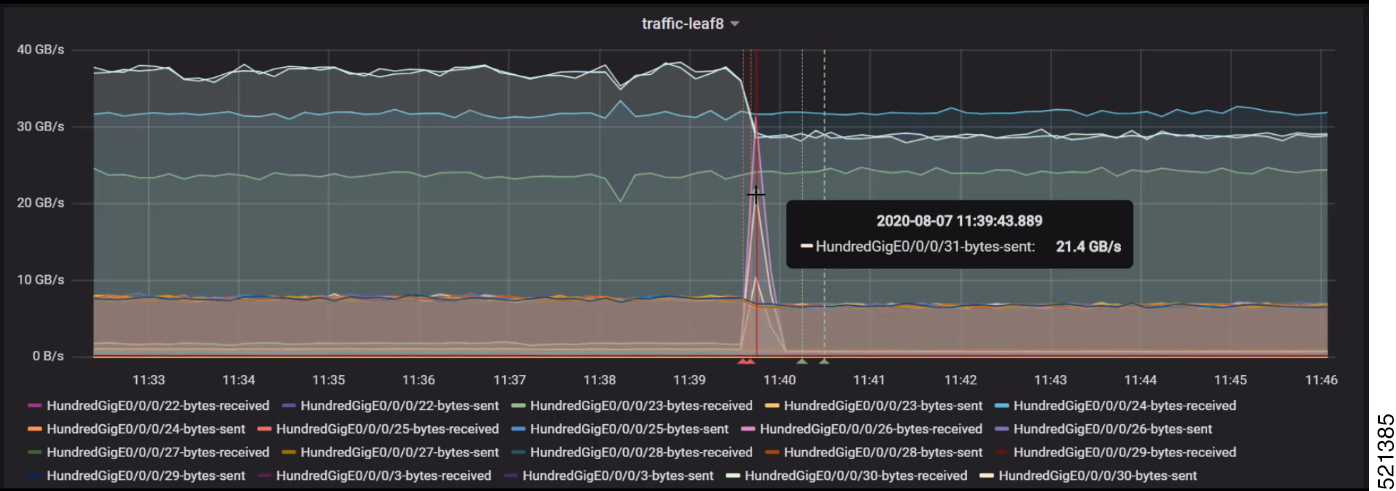
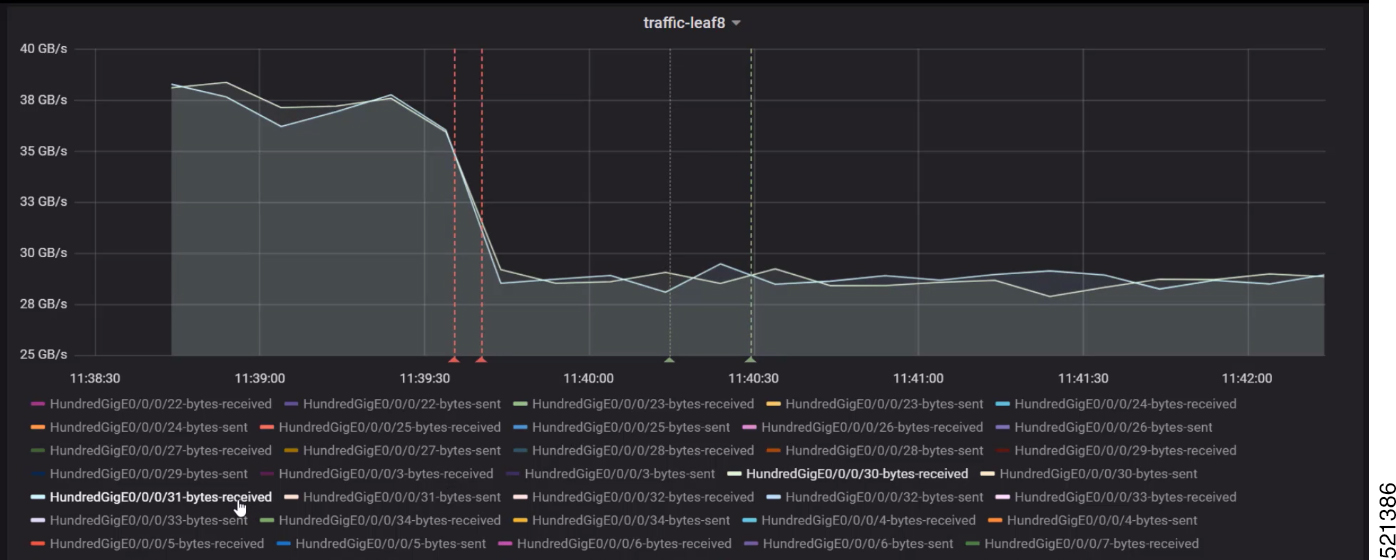
set of sensor paths that get impacted with the state change. So, the uses cases for ADT falls under a broad spectrum where any event that causes fluctuation at the interface-level traffic is detected in an unsupervised manner.

With this streamed telemetry data, a data lake is created at the collector. Analyzing this data, you proactively monitor your network, identify patterns, troubleshoot your network in a predictive manner, and devise strategies to create a resilient network using automation.

Key Components

ADT comprises of the following key components:
  • Collector: Collects all data from the router to provide a comprehensive view of the system. This function is synonymous to MDT.

  • Detector: Prepares the collected data, remove redundancies, and detect changes to provide a macroscopic view of the system unlike Event Driven Telemetry (EDT). The detector learns how the sensor paths evolve to depend on each other and monitors changes at the system level. This learning about dependancies is unsupervised, multi-variate and adaptive to the data stream.

  • Selector: Chooses a small, representative subset of the set of counters that best portrays events that are detected by the Detector using AI and unsupervised ML.

  • Exporter: Streams the selected sensor paths using the ADT YANG data model to the MDT infrastructure. The ADT data model supports EDT where data is streamed only when an event in the system is detected. With sample interval 0, there is no overhead due to high frequency push.

Processing Telemetry Data on the Router to Analyze Traffic Changes

The use case illustrates how, with the AI-driven telemetry (ADT), you can use telemetry data to monitor events in the network. Monitoring the events ensures efficient network management. This use case describes the tools that are used in the open-sourced collection stack to store and analyse telemetry data.


Note


Watch this video to see how you configure model-driven telemetry to take advantage of data models, Open Source collectors, encodings, and integrate into monitoring tools.

Telemetry involves the following workflow:

Figure 1. AI-Driven Telemetry
The image shows a high-level overview of streaming telemetry data using ADT.
  • Define: You define a subscription to stream data from the router to the receiver. To define a subscription, you create a destination-group and a sensor-group.

  • Deploy: The router establishes a subscription-based telemetry session and streams data to the receiver. You verify subscription deployment on the router.

  • Operate: You consume and analyze telemetry data using Open Source tools, and take necessary actions based on analysis.

Before you begin

Make sure you have L3 connectivity between the router and the receiver for external traffic.

Define a Subscription to Stream ADT Events from Router to Receiver

Create a subscription to define the data of interest to be streamed from the router to the destination.

Procedure


Step 1

Enable telemetry on the router.

Example:


Router(config)#telemetry model-driven
Router(config)#commit

Step 2

Enable ADT on the router.

Example:


Router(config)#adt enable
Router(config)#commit

Once ADT is enabled, it monitors a set of sensor paths that are derived from the configuration on the router. ADT learns these sensor paths in an unsupervised machine learning approach.

Note

 
The Cisco-IOS-XR-adt-config-cfg.yang YANG data model can be used to configure ADT using NETCONF protocol.
container adt-config {
    description "Container Schema adt configuration";

    container enable-feature {
      presence "CLI submode compatibility.";
      description "Enable adt feature";

      container input {
        description "Sources for ADT collector";

        container mdt {
          description "MDT config for collector";

          container mdt-sensor-group-ids {
            description "MDT sensor groups";

            list mdt-sensor-group-id {
              key "groupname";
              description "MDT sensor group id";
              leaf groupname {
                type xr:Cisco-ios-xr-string;
                description "Mdt Sensor Group name";
              }   
            }   
          }   
        }   
      }   
    }   
  }
The following example shows the basic configuration to enable ADT using data model.

<config>
    <adt-config xmlns="http://cisco.com/ns/yang/Cisco-IOS-XR-adt-config-cfg">
        <enable-feature/>
    </adt-config>
</config>
To disable ADT, use the following operation:

<config>
    <adt-config xmlns="http://cisco.com/ns/yang/Cisco-IOS-XR-adt-config-cfg">
        <enable-feature xmlns:nc="urn:ietf:params:xml:ns:netconf:base:1.0" nc:operation="delete"/>
    </adt-config>
</config>

Step 3

Create one or more destinations to collect telemetry data from a router. Define a destination-group to contain the details about the destinations. Include the destination address (IPv4 or IPv6) or fully qualified domain name (FQDN), port, transport, and encoding format in the destination-group.

Example:


Router(config)#telemetry model-driven
Router(config-model-driven)#destination-group ADT-DESTINATION
Router(config-model-driven-dest)#address family ipv4 172.0.0.0 port 57500
Router(config-model-driven-dest-addr)#encoding self-describing-gpb
Router(config-model-driven-dest-addr)#protocol tcp
Where -
  • ADT-DESTINATION is the name of the destination-group

  • 172.0.0.0 is the IP address of the destination where data is to be streamed

    Note

     
    To avoid hardcoding IP address, the router can choose any of the configured IPv4 or IPv6 address using domain name service. If an established connection fails, the router connects to another resolved IP address, and streams data to that IP address.
  • 57500 is the port number of the destination

  • self-describing-gpb is the format in which data is encoded and streamed to the destination. For the supported formats, see Encoder.

  • tcp is the protocol through which data is transported to the destination. For the supported protocols, see Transport.

Step 4

Specify the subset of the data that you want to stream from the router using sensor paths. The sensor path represents the path in the hierarchy of a YANG data model. Create a sensor-group to contain the sensor paths.

Example:


Router(config)#telemetry model-driven
Router(config-model-driven)#sensor-group ADT-EVENT
Router(config-model-driven-snsr-grp)#sensor-path Cisco-IOS-XR-adt-oper:adt/adt-output
Where -
  • ADT-EVENT is the name of the sensor-group

  • Cisco-IOS-XR-adt-oper:adt/adt-output is the sensor path from where data is streamed.

Note

 
The following example showss how to add a custom sensor group using data model.

<config>
    <adt-config xmlns="http://cisco.com/ns/yang/Cisco-IOS-XR-adt-config-cfg">
        <enable-feature>
            <input>
                <mdt>
                    <mdt-sensor-group-ids>
                        <mdt-sensor-group-id>
                            <groupname> QOS_VOQ </groupname>
                        </mdt-sensor-group-id>
                    </mdt-sensor-group-ids>
                </mdt>
            </input>
        </enable-feature>
    </adt-config>
</config>

Step 5

Subscribe to telemetry data that is streamed from a router. A subscription binds the destination-group with the sensor-group and sets the streaming method. The streaming method can be cadence-driven or event-driven telemetry. ADT is event-driven; subscriptions are defined with 0 (zero) cadence.

Example:


Router(config)#telemetry model-driven  
Router(config-model-driven)#subscription ADT-SUBSCRIPTION
Router(config-model-driven-subs)#sensor-group-id ADT-EVENT sample-interval 0 
Router(config-model-driven-subs)#destination-id ADT-DESTINATION 
Router(config-model-driven-subs)#source-interface Interface1
Where -
  • ADT-SUBSCRIPTION is the name of the subscription

  • ADT-EVENT is the name of the sensor-group

  • ADT-DESTINATION is the name of the destination-group

  • Interface1 is the source interface that is used for establishing the telemetry session. If both the VRF and source interface are configured, the source interface must be in the same VRF as the one specified in the destination-group.

  • 0 is the sample interval.

Running Configuration


adt enable
!
telemetry model-driven
 destination-group ADT-DESTINATION
  destination 172.0.0.0 port 57500
   encoding self-describing-gpb
   protocol tcp
  !
 !
 sensor-group ADT-EVENT
  sensor-path Cisco-IOS-XR-adt-oper:adt/adt-output
 !
 subscription ADT-SUBSCRIPTION
  sensor-group-id ADT-EVENT sample-interval 0
  destination-id ADT-DESTINATION
 !
!

Alternate Method: Configure ADT Using YANG Data Model

The above ADT configuration using CLI can also be configured using YANG data model Cisco-IOS-XR-adt-config-cfg.yang. You can obtain the data model from Github.


<config>
    <adt-config xmlns="http://cisco.com/ns/yang/Cisco-IOS-XR-adt-config-cfg">
        <enable-feature/>
    </adt-config>
</config>

Verify Deployment of the Subscription

The router dials out to the receiver to establish a session with each destination in the subscription. After the session is established, the router streams data to the receiver to create a data lake.

ADT operational models are classified into three categories:
  • ADT events: This model defines how ADT generates output to describe an event using Cisco-IOS-XR-adt-oper:adt/adt-output sensor path.

  • ADT subscriptions: This model exports the sensor paths that are monitored by ADT and the cadence at which each path is monitored using Cisco-IOS-XR-adt-oper:adt/subscription-info sensor path.
    Router#show adt subscription details
    Wed Feb  3 14:51:39.444 IST
    ADT SUBSCRIPTION  Details
    [Subscription ID, Cadence(in seconds), (E)xplicit/(I)mplicit] Sensor Path
    *Subscription ID = 0: Not enough system resources to subscribe
    
    Active Groups : 2
    
        Group: QOS_VOQ                  
        -----------------------------------------
            [300000028,  20, E] Cisco-IOS-XR-qos-ma-oper:qos/interface-table/interface/output/service-policy-names/service-policy-instance/statistics
            [300000027,  20, E] Cisco-IOS-XR-fretta-bcm-dpa-npu-stats-oper:dpa/stats/nodes/node/npu-numbers/npu-number/display/base-numbers/base-number
    
        Group: implicit                 
        -----------------------------------------
            [300000001,  60, I] Cisco-IOS-XR-telemetry-model-driven-oper:telemetry-model-driven/subscriptions/subscription
            [300000002,  40, I] Cisco-IOS-XR-wdsysmon-fd-oper:system-monitoring/cpu-utilization
            [300000003,  40, I] Cisco-IOS-XR-nto-misc-oper:memory-summary/nodes/node/summary
            [300000004,  40, I] Cisco-IOS-XR-procmem-oper:processes-memory/nodes/node[node-name="0/RP0/CPU0"]/process-ids/process-id[process-id="8893"]
            [300000005,  20, I] Cisco-IOS-XR-pfi-im-cmd-oper:interfaces/node-type-sets/node-type-set/interface-summary
            [300000006,  20, I] Cisco-IOS-XR-infra-statsd-oper:infra-statistics/interfaces/interface[interface-name=".*(GigE|Ethernet).*"]/latest/generic-counters
            [300000007,  20, I] Cisco-IOS-XR-ipv6-io-oper:ipv6-io
            [300000008,  20, I] Cisco-IOS-XR-ip-iarm-v6-oper:ipv6arm/router-id
            
            --------------------------------- Truncated for Brevity -------------------------
    
  • ADT statistics: This model reports health statistics of ADT system using Cisco-IOS-XR-adt-oper:adt/statistics sensor path.

In this example, the output is shown for ADT events. ADT event can have one or more events reported.
  • Each event contains:
    • An event identifier
    • The time-stamp of the event
    • A short description of the event
    • List of sensors that changed their behavior during the event
  • Each sensor path exported contains:
    • Tags which define the scope of the sensor path

    • List of value, timestamp pair containing samples of the sensor output before and after the event.

Procedure


Step 1

View the generated events.

Example:

Following is a snippet of ADT event output, generated by traffic change.

  "node_id_str": "PE4",
  "subscription_id_str": "app_1887_75f00000001",
  "encoding_path": "Cisco-IOS-XR-adt-oper:adt/adt-output",
  "collection_id": "9569581",
  "collection_start_time": "1607525488535",
  "msg_timestamp": "1607525488556",
  "data_json": [
    {
      "timestamp": "1607525488552",
      "keys": [],
      "content": {
        "adt-event": [
          {
            "event-id": 123,
            "change-description": "Traffic",
            "timestamp": "1607431905419",
            "change": [
              {
                "sensor-path": "Cisco-IOS-XR-infra-statsd-oper:infra-statistics/interfaces/interface/latest/generic-counters/bytes-received",
                "sensor-path-tags": "interface-name=GigabitEthernet0/3/0/19",
                "data": [
                  {
                    "value": {
                      "value-type": 8,
                      "val-counter64": "62808023132655"
                    },
                    "timestamp": "1607431545418"
                  },
                  ...
                  ...
                  {
                    "value": {
                      "value-type": 8,
                      "val-counter64": "62869633436614"
                    },
                    "timestamp": "1607432235421"
                  },
                  {
                    "value": {
                      "value-type": 8,
                      "val-counter64": "62872314602090"
                    },
                    "timestamp": "1607432265421"
                  }
                ]
              }
            ]
          }
        ]
      }
    }
  ],
  "collection_end_time": "1607525488556"

The router streams data to the receiver upon state change using the subscription-based telemetry session. A data lake is created at the receiver.

See the ADT events.


Router#show adt events
|-------------------------------------------------------------------------------|
| Number of Events :      5                                                     |
|-------------------------------------------------------------------------------|
|  Event id |                   Timestamp | Description                         |
|-------------------------------------------------------------------------------|
|       119 |  Tue 2020-12-01 13:41:56:141|                              Traffic|
|       120 |  Thu 2020-12-03 19:36:14:937|            Addressing & Reachability|
|       121 |  Thu 2020-12-03 20:00:48:015|            Addressing & Reachability|
|       122 |  Sun 2020-12-06 17:09:57:994|                              Traffic|
|       123 |  Tue 2020-12-08 18:21:45:419|                              Traffic|
|-------------------------------------------------------------------------------|

Step 2

See the details of events.

Example:

In this example, the details of event 123 are displayed.

Router#show adt events id 123 detail
Event Id             : 123
 Timestamp            : Tue 2020-12-08 18:21:45:419
 Description          : Traffic
 Number of Sensor paths : 1
    Sensor Path      : Cisco-IOS-XR-infra-statsd-oper:infra-statistics/interfaces/interface/latest/generic-counters/bytes-received
    Sensor Path Tags : interface-name=GigabitEthernet0/3/0/19
    Message          :
        Number of entries in list: 25
        Value : [ 62808023132655, 62810701566605, 62813380497605, 62816056633805,
                  62818733833405, 62821412539395, 62824092600551, 62826773125641,
                  62829461449196, 62832132687840, 62834805072011, 62837462182289,
                  62840165873427, 62842846468785, 62845523517431, 62848199893619,
                  62852053505122, 62853557475735, 62856237814551, 62858917998694,
                  62861594969436, 62864275943572, 62866948687442, 62869633436614,
                  62872314602090, ]
        First Timestamp : Tue 2020-12-08 18:15:45:418 [1607431545418]
        Last Timestamp  : Tue 2020-12-08 18:27:45:421 [1607432265421]

ADT event lists 25 sample values of data that are reported by sensor paths before and after the event. So, 25 data points help us describe a particular event and its associated sensor path.


Operate on Telemetry Data for In-Depth Analysis of the Network

You can start consuming and analysing telemetry data from the data lake using an open-sourced collection stack. This use case uses the following tools from the collection stack:
  • Pipeline is a lightweight tool that is used to collect data. You can download Network Telemetry Pipeline from Github. You define how you want the collector to interact with routers and where you want to send the processed data using pipeline.conf file.

  • Telegraph (plugin-driven server agent) and InfluxDB (time series database (TSDB)) stores telemetry data, which is retrieved by visualization tools. You can download InfluxDB from Github. You define what data you want to include into your TSDB using the metrics.json file.

  • Grafana is a visualization tool that displays graphs and counters for data that is streamed from the router.

In summary, Pipeline accepts TCP and gRPC telemetry streams, converts data and pushes data to the InfluxDB database. Grafana uses the data from the InfluxDB database to build dashboards and graphs. Pipeline and InfluxDB may run on the same server or on different servers.

Consider that the router is streaming data on an event change, and Telegraf requests information from the Pipeline at 1-second intervals.

Procedure


Step 1

Start Pipeline, and enter your router credentials.

Note


The IP address and port that you specify in the destination-group must match the IP address and port on which Pipeline is listening.

Example:


$ bin/pipeline -config pipeline.conf 

Startup pipeline 
Load config from [pipeline.conf], logging in [pipeline.log] 

CRYPT Client [grpc_in_mymdtrouter], [http://172.0.0.0:5432]
 Enter username: <username>
 Enter password: <password>
Wait for ^C to shutdown

Step 2

In the Telegraph configuration file, add the following values to read the metrics about CPU usage.

Example:


[[inputs.cpu]]
  ## Whether to report per-cpu stats or not
  percpu = true
  ## Whether to report total system cpu stats or not
  totalcpu = true
  ## If true, collect raw CPU time metrics.
  collect_cpu_time = false
  ## If true, compute and report the sum of all non-idle CPU states.
  report_active = false

Step 3

Use Grafana to create a dashboard and visualize data.

Figure 2. Visual Analysis of the Interfaces Impacted Due to Traffic Change Using Telemetry Data
Further, narrow down to view the impact on individual interfaces. In this example, the bytes received for interfaces HundredGigE0/0/0/30 and HundredGigE0/0/0/31 are visualized and analysed.
Figure 3. Visual Analysis of System Monitoring on Two Interfaces Using Telemetry Data

In conclusion, until the point where an event occurred, there is relatively no change. When an event is detected, there is significant drop in traffic on few interfaces and a peak on few other interfaces. ADT predicted these changes in the interfaces accurately using the associated sensor paths that it learned using AI and unsupervised ML from the router's configuration.