IP Endpoint Delay Measurement and Liveness Monitoring

This module describes the performance measurement for the IP Endpoint feature that measures the end-to-end delay and monitors liveness towards a specified IP endpoint.

Information About IP Endpoint Performance Delay Measurement and Liveness Monitoring

The performance measurement for the IP Endpoint feature dynamically measures the end-to-end delay towards a specified IP endpoint. IP endpoints can be in the global routing table or VRFs.

Benefits of IP Endpoint Performance Delay Measurement and Liveness Monitoring

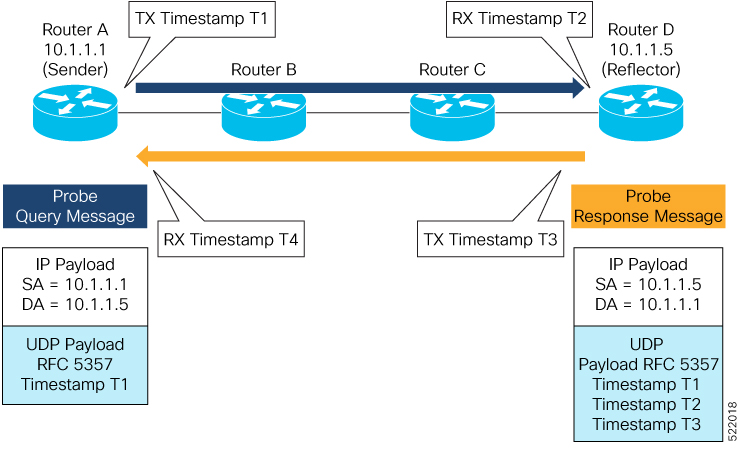
  • Performance values (delay metrics and liveness states) are computed using the Two-Way Active Measurement Protocol (TWAMP) light.

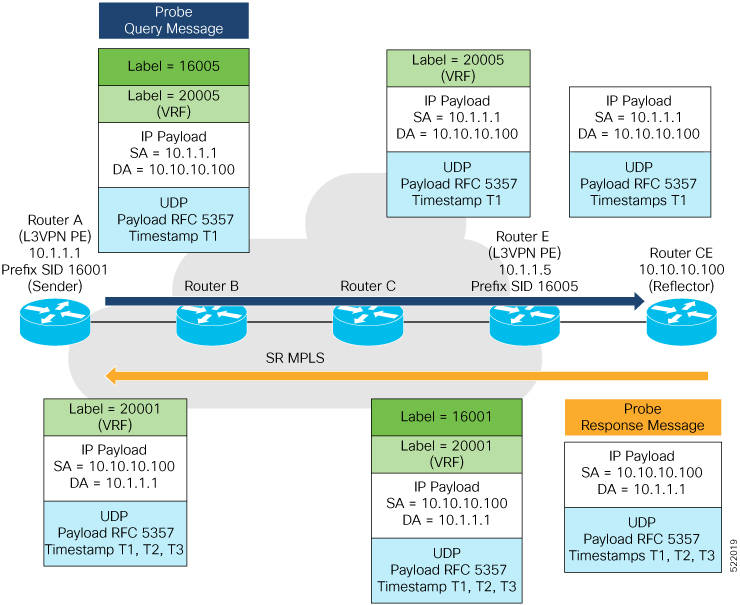
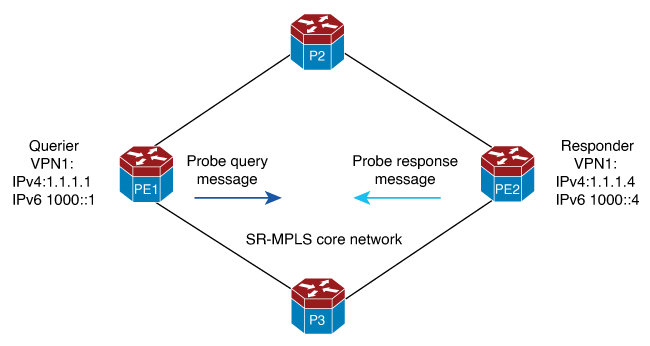
  • Support for TWAMP measurements using IP addresses in the global routing table, IPv4 VRFs, and IPv6 VRFs.

  • Performance values, including histograms, are sent out using streaming telemetry, which is a push-based data collection technique, rather than a manual data collection technique.

Restrictions for IP Endpoint Performance Delay Measurement and Liveness Monitoring

  • IP Endpoint Performance Delay Measurement with MPLS-Path is not supported.

  • IP Endpoint Performance Delay Measurement with Loopback mode is not supported.

  • The platform punt policer for TWAMP is recommended to configure for the scaling deployment.

  • Be careful when changing the default burst interval (3 seconds) because this will directly influence the number of pps sent by the performance measurement feature.

  • TWAMP Light support for both sender and responder.

  • Two-way (must) and one-way (optional) delay measurements are supported. It is strongly recommended to use two-way delay measurement.

  • One-way measurements should only be used for cases where the delay is expected to be in the order of tens/hundreds of milliseconds and the path is known to be asymmetric. The clocks on the source and target devices should be synchronized in this measurement.

  • The use of Network Time Protocol (NTP) for clock synchronization is highly recommended.

  • Minimum 2500 pps (250 probes/sessions each configured with 10 pps).

  • Expected accuracy similar to IP-SLA.

  • Configuration of TOS/DSCP for the TWAMP-light probes is supported.

  • Configuration of packet size is supported.

  • Altering padding size will increase CPU utilization.

Supported Platforms for IP Endpoint Performance Delay Measurement and Liveness Monitoring

The IP Endpoint Delay Measurement and Liveness Monitoring feature is available on the following platforms:

  • Cisco Catalyst 8500 Series Edge Platforms

  • Cisco Catalyst 8200 Series Edge Platforms

  • Cisco ASR 1000 Series Aggregation Services Routers

  • Cisco Catalyst 8000V Edge Software

Use Cases for IP Endpoint Performance Delay Measurement

The following use cases show different ways to deploy delay measurement and liveness detection for IP endpoints.

Use Case 1: Delay Measurement Probe Toward an IP Endpoint Reachable in the Global Routing Table

The following figure illustrates a delay measurement probe toward an IP endpoint reachable in the global routing table. The network interconnecting the sender and the reflector provides plain IP connectivity.

Use Case 2: Delay Measurement Probe Toward an IP Endpoint Reachable in a User-Specified VRF

The following figure illustrates a delay measurement probe toward an IP endpoint reachable in a user-specified L3VPN's VRF routing table. The L3VPN ingress PE (Router A) acts as the sender. The reflector is located in a CE device behind the L3VPN egress PE (Router E). The network interconnecting the L3VPN PEs provides MPLS connectivity with Segment Routing.

How to Configure IP Endpoint Performance Delay Measurement

Usage Guidelines and Limitations

  • The endpoint of a probe is specified with an IP address. IPv4 and IPv6 endpoint addresses are supported.

  • The endpoint of a probe can be any IP address reachable by the sender. For example, a local interface or a remote node or host located within an operator's network or reachable through a VRF.

  • The endpoint's IP address can be located in the global routing table or under a user-specified VRF routing table.

  • VRF-awareness allows operators to deploy probes in the following scenarios:

  • Managed Customer Equipment (CE) scenarios:

    • PE to CE probes

    • CE to CE probes

  • Unmanaged Customer Equipment (CE) scenarios:

    • PE to PE probes

    • PE to PE (source from PE-CE interface) probes

  • SRv6 locator prefix and VRF SRv6 locator/function (uDT4/uDT6) as IPv6 endpoint of a probe is not supported.

  • The endpoint's IP address can be reached through an IP path, MPLS LSP, or IP tunnel (GRE).

  • When the endpoint is reachable using an MPLS LSP (for example, SR, LDP, RSVP-TE, SR Policy), the forwarding stage imposes the corresponding MPLS transport labels.

  • When the endpoint is reachable via a VRF in an MPLS network, the forwarding stage imposes the corresponding MPLS service labels. In the forward path, the sender node uses the configured VRF for the endpoint address. In the return path, the reflector node derives the VRF based on which incoming VRF label the probe packet is received with.

Configuring Performance Delay Measurement IP Endpoint

Perform the following steps to configure the performance delay measurement IP endpoint.

SUMMARY STEPS

  1. enable
  2. configureterminal
  3. performance-measurement
  4. endpoint endpoint-name
  5. vrf vrf-name
  6. source-address ipv4 source_ip_address
  7. destination-address ipv4 destination_ip_address
  8. delay-measurement
  9. profile profile-name

DETAILED STEPS

  Command or Action Purpose

Step 1

enable

Example:

Router> enable

Enables the privileged EXEC mode. Enter your password, if prompted.

Step 2

configureterminal

Example:

Router# configure terminal

Enters global configuration mode.

Step 3

performance-measurement

Example:

RouterA(config)# performance-measurement

Enters performance delay measurement mode.

Step 4

endpoint endpoint-name

Example:

RouterA(config-perf-meas)# endpoint test-ipv4-1

Specifies the name of the IP endpoint.

Step 5

vrf vrf-name

Example:

RouterA(config-pm-ep)# vrf VPN-1

Specifies the name of the VRF instance.

Step 6

source-address ipv4 source_ip_address

Example:

RouterA(config-pm-ep)# source-address ipv4 1.1.1.1

Specifies the source IP address.

Step 7

destination-address ipv4 destination_ip_address

Example:

RouterA(config-pm-ep)# destination-address ipv4 1.1.1.4

Specifies the destination IP address.

Step 8

delay-measurement

Example:

RouterA(config-pm-ep)#delay-measurement

Enables delay measurement on the IP endpoint.

Step 9

profile profile-name

Example:

RouterA(config-pm-ep-dm)#profile test-profile

Specifies the profile name.

Configuring IP Endpoint Performance Delay Measurement Profile

Perform the following steps to configure the IP endpoint performance delay measurement profile.

SUMMARY STEPS

  1. enable
  2. configureterminal
  3. performance-measurement
  4. delay-profile endpoint name endpoint-name
  5. probe
  6. measurement-mode {one-way | two-way}
  7. computation-interval seconds
  8. burst-interval milliseconds
  9. padding-size size
  10. tos-dscp value
  11. exit
  12. liveness-detection
  13. multiplier value
  14. exit
  15. advertisement
  16. threshold-check {average-delay | maximum-delay | minimum-delay}
  17. exit
  18. periodic {disabled | interval seconds | minimum-change microseconds | threshold value}
  19. exit
  20. accelerated {minimum-change microseconds | threshold value}
  21. exit

DETAILED STEPS

  Command or Action Purpose

Step 1

enable

Example:

Router> enable

Enables the privileged EXEC mode. Enter your password, if prompted.

Step 2

configureterminal

Example:

Router# configure terminal

Enters global configuration mode.

Step 3

performance-measurement

Example:

RouterA(config)# performance-measurement

Enters performance delay measurement mode.

Step 4

delay-profile endpoint name endpoint-name

Example:

RouterA(config-perf-meas)#delay-profile endpoint name test-profile

Specifies the delay profile name to be associated.

Step 5

probe

Example:

RouterA(config-pm-dm-ep)#probe

Enters probe configuration mode.

Step 6

measurement-mode {one-way | two-way}

Example:

RouterA(config-pm-dm-ep-probe)# measurement-mode two-way

Specifies the interval measurement mode. The default value is two-way measurement mode.

Step 7

computation-interval seconds

Example:

RouterA(config-pm-dm-ep-probe)# computation-interval 60

Specifies the interval for metric computation. The range is from 1 to 3600 seconds. The default value is 30 seconds.

Step 8

burst-interval milliseconds

Example:

RouterA(config-pm-dm-ep-probe)#burst-interval 3000

Specifies the interval for sending probe packet. The range is from 30 to 15000 milliseconds. The default value is 3000 milliseconds.

Step 9

padding-size size

Example:

RouterA(config-pm-dm-ep-probe)#padding-size 0

Specifies the packet pading size. The range is from 0 to 8000.

Note


It is not recommended to configure padding-size greater than 1500. Bigger padding size can cause fragmentation and reassembly which impacts system performance and IP endpoint PM delay precision.

Step 10

tos-dscp value

Example:

RouterA(config-pm-dm-ep-probe)# tos-dscp 48

Specifies the type of Service DSCP. The range is from 0 to 63.The default value is DSCP 48 for IP/UDP.

Step 11

exit

Example:

RouterA(config-pm-dm-ep-probe)#exit

Exits probe configuration mode.

Step 12

liveness-detection

Example:

RouterA(config-pm-dm-ep)#liveness-detection

Enters endpoint liveness detection configuration mode.

Step 13

multiplier value

Example:

RouterA(config-pm-dm-ep-live)#multiplier 3

Specify the number of probe packets sent before the head-end node assumes the endpoint liveness session state is down. The range is from 2 to 10.

Step 14

exit

Example:

RouterA(config-pm-dm-ep-live)#exit

Exits endpoint liveness detection configuration mode.

Step 15

advertisement

Example:

RouterA(config-pm-dm-ep)#advertisement

Enters advertisement configuration mode.

Step 16

threshold-check {average-delay | maximum-delay | minimum-delay}

Example:

RouterA(config-pm-dm-ep-adv)#threshold-check maximum-delay

Enters threshold check advertisement configuration mode. Checks the delay metric change for threshold crossing for accelerated advertisement. The default value is average-delay.

Step 17

exit

Example:

RouterA(config-pm-dm-ep-adv-threshold-check)#exit

Exits threshold check advertisement configuration mode.

Step 18

periodic {disabled | interval seconds | minimum-change microseconds | threshold value}

Example:

RouterA(config-pm-dm-ep-adv)# periodic interval 120

Enters periodic advertisement configuration mode.

disabled: Disables periodic advertisement.

interval: Periodic advertisement and metric aggregation interval. The range is from 30 to 3600 seconds. The default value is 120 seconds.

minimum-change: Periodic advertisement minimum change value. The range is from 0 to 1000000 microseconds. The default value is 500 microseconds.

threshold: Specifies the minimum-delay metric change for threshold crossing for periodic advertisement. The range is from 0 to 100 percent. The default value is 10 percent.

Note


An advertisement happens when both minimum-change and threshold are crossed.

Step 19

exit

Example:

RouterA(config-pm-dm-ep-adv-per)#exit

Exits periodic advertisement configuration mode.

Step 20

accelerated {minimum-change microseconds | threshold value}

Example:

RouterA(config-pm-dm-ep-adv)#accelerated minimum-change 1000

Enters accelerated advertisement configuration mode.

minimum-change: Periodic advertisement minimum change value. The range is from 1 to 1000000 microseconds.. The default value is 500 microseconds.

threshold: Specifies the minimum-delay metric change for threshold crossing for periodic advertisement. The range is from 0 to 100 percent. The default value is 20 percent.

Step 21

exit

Example:

RouterA(config-pm-dm-ep-adv-acc)#exit

Exits accelerated advertisement configuration mode.

Configuration Examples for IP Endpoint Performance Delay Measurement

The following are configuration examples for the IP endpoint performance delay measurement.

Configuration Example: Configuring IP Endpoint Performance Delay Measurement (global configuration)

Running Configuration

Querier (Sender) configuration:

performance-measurement
delay-profile endpoint name test-profile
probe
burst-interval 95
tos-dscp 24
!
endpoint test-ipv4-1
source-address ipv4 1.1.1.1
destination-address ipv4 4.4.4.4
delay-measurement
profile test-profile
performance-measurement
!
endpoint test-ipv6-1
source-address ipv6 1000::1
destination-address ipv6 4000::1
delay-measurement
profile test-profile

Querier (Sender) configuration:

performance-measurement

Configuration Example: Configuring IP Endpoint Performance Delay Measurement (VRF configuration)

Running Configuration

Querier (Sender) configuration:

performance-measurement
delay-profile endpoint name test-profile
probe
burst-interval 95
tos-dscp 24
!
endpoint test-ipv4-1
vrf VPN-1
source-address ipv4 1.1.1.1
destination-address ipv4 1.1.1.4
delay-measurement
profile test-profile
!
performance-measurement
!
endpoint test-ipv6-1
vrf VPN-1
source-address ipv6 1000::1
destination-address ipv6 1000::4
delay-measurement
profile test-profile

Querier (Sender) configuration:

performance-measurement

Verification for IP Endpoint Performance Delay Measurement

You can use the following show commands for verifying the IP endpoint performance delay measurement.

  • show performance-measurement counters endpoint filter name pm-name detail

  • show performance-measurement endpoint filter name pm-name detail

  • show performance-measurement history endpoint adv

  • show performance-measurement history endpoint aggr

  • show performance-measurement history endpoint filter name liveness-notification

  • show performance-measurement history endpoint filter name pm-name adv

  • show performance-measurement history endpoint filter name pm-name aggr

  • show performance-measurement history endpoint filter name probe

  • show performance-measurement profile endpoint

  • show performance-measurement responder counters interface

  • show performance-measurement responder summary

  • show performance-measurement summary

Examples

The following are sample outputs of the show commands for verifying the IP endpoint performance delay measurement.

show performance-measurement summary

pe1#show performance-measurement summary 
Total interfaces : 1 
Total SR Policies : 0 
Total endpoints : 250 
Maximum PPS : 2000 pkts/sec 
Dual-color gre bit-position : 9 
Endpoint Delay-Measurement: 
    Total sessions : 250 
    Counters: 
        Packets: 
            Total sent : 12816719 
            Total received : 11443853 
        Errors: 
            Total sent errors : 0 
            Total received errors : 172421 
        Probes: 
            Total started : 40959 
            Total completed : 35208 
            Total incomplete : 5751 
            Total advertisements : 33

show performance-measurement profile

pe1#show performance-measurement profile endpoint name test-profile 
test-profile Endpoint Delay Measurement: 
    Profile configuration: 
        Measurement Type : Two-Way 
        Computation interval : 30 (effective : 30) seconds 
        Burst interval : 95 mSec 
        Burst count : 316 
        Protocol : TWAMP-Lite Unauth 
        ToS DSCP value : 48 
        Destination sweeping mode : Disabled 
        Periodic advertisement : Enabled 
            Interval : 120 (effective: 120) sec 
            Threshold : 10% 
            Minimum-Change : 500 uSec 
        Accelerated advertisement : Disabled 
        Threshold crossing check : Average-delay 
        Liveness-detection multiplier : 3

show performance-measurement endpoint session

PE#show performance-measurement endpoint filter name test-ipv6-2000 detail
Endpoint name: test-ipv6-2000
  Source address                  : 1412::1
  Destination address             : 1412::4
  Delay Measurement               : Enabled
  VRF                             : Not configured
  Profile name                    : test-profile
  Forward SID List                : Not configured
  Reverse SID List                : Not configured

  Delay Measurement session:
    Session ID                : 6
    Profile name              : test-profile

    Last advertisement:
      Advertised at: 15:00:52 11-01 2023 (30 seconds ago)
      Advertised reason: Periodic timer, avg delay threshold crossed
      Advertised anomaly: INACTIVE
      Advertised delays (uSec): avg: 4265, min: 2902, max: 5999, variance: 986

    Next advertisement:
      Check scheduled in 3 more probes (roughly every 120 seconds)
      No probes completed
      Rolling average (uSec): 4378

    Current Probe:
      Started at 15:00:52 11-01 2023 (30 seconds ago)
      Packets Sent: 311, received: 311
      Measured delays (uSec): avg: 5004, min: 4010, max: 5977, variance: 994
      Probe samples:
        Packet Rx Timestamp       Measured Delay (nsec)
        15:01:23 11-01 2023       5093944
        15:01:23 11-01 2023       5092502
        15:01:23 11-01 2023       5110069
        15:01:23 11-01 2023       5365350
        15:01:23 11-01 2023       5365940
      Next probe scheduled at 15:01:22 11-01 2023 (in 0 seconds)
      Burst completed

    Liveness Detection:
      Session Creation Timestamp: 11-01 14:50:29.937
      Session State: Up
      Last State Change Timestamp: 11-01 14:51:56.110
      Missed count   [consecutive]: 0
      Received count [consecutive]: 5691
      Backoff                     : 0
      Unique Path Name            : Path-6
      Loss in Last Interval       : 0 % [TX: 313 RX: 313]

show performance-measurement counters endpoint

pe1#show performance-measurement counters endpoint filter name test-ipv6-100 detail 
Endpoint name: test-ipv6-100 
Source address : 1000::100 
Destination address : 6000::100 
Delay Measurement : Enabled 
VRF : Not configured 
Profile name : test-profile 
Forward SID List : Not configured 
Reverse SID List : Not configured 
Delay-Measurement: 
    Packets: 
        Total sent : 771804 
        Total received : 741831 
    Errors: 
        TX: 
            Total interface down : 0 
            Total no MPLS caps : 0 
            Total no IP address : 0 
            Total other : 0     
        RX: 
            Total negative delay : 1762 
            Total delay threshold exceeded : 0 
            Total missing TX timestamp : 0 
            Total missing RX timestamp : 0
            Total probe full : 0 
            Total probe not started : 1 
            Total control code error : 0 
            Total control code notif : 0 
        Probes:     
            Total started : 2487 
            Total completed : 2358 
            Total incomplete : 128 
            Total advertisements : 1

show performance-measurement history endpoint

pe1#show performance-measurement history endpoint filter name test-ipv6-100 probe
Endpoint name: test-ipv6-100
Source address : 1000::100
Destination address : 6000::100
Delay Measurement : Enabled
VRF : Not configured
Profile name : test-profile
Forward SID List : Not configured
Reverse SID List : Not configured
Delay-Measurement history (uSec):
Probe Start Timestamp     Pkt(TX/RX)     Average       Min     Max
03:52:25 01-18 2024     313/313             30         16      314
03:51:54 01-18 2024     313/313             29         13      47
03:51:22 01-18 2024     313/313             30         15      349
03:38:16 01-18 2024     10/10               42         29      101
<snip>
03:37:46 01-18 2024     10/10               37         28       45
03:37:16 01-18 2024     10/10               37         29       47
03:36:46 01-18 2024     10/10               38         31       46
03:36:16 01-18 2024     10/10               39         28       48

Feature Information for IP Endpoint Delay Measurement and Liveness Monitoring

The following table provides release information about the feature or features described in this module. This table lists only the software release that introduced support for a given feature in a given software release train. Unless noted otherwise, subsequent releases of that software release train also support that feature.

Use Cisco Feature Navigator to find information about platform support and Cisco software image support. To access Cisco Feature Navigator, go to www.cisco.com/go/cfn. An account on Cisco.com is not required.
Table 1. Feature Information for IP Endpoint Delay Measurement and Liveness Monitoring

Feature Name

Releases

Feature Information

IP Endpoint Delay Measurement and Liveness Monitoring

IOS XE 17.14.1a

This feature enables you to measure the end-to-end delay and monitor liveness towards either a specified IPv4 or IPv6 endpoint.

This feature is introduced for the following platforms:

  • Cisco Catalyst 8500 Series Edge Platforms

  • Cisco Catalyst 8200 Series Edge Platforms

  • Cisco ASR 1000 Series Aggregation Services Routers

  • Cisco Catalyst 8000V Edge Software

From Cisco IOS XE 17.14.1a, you can be configure this feature using the performance-measurement endpoint and performance-measurement delay-profile endpoint commands.