Logging in and Managing the Cisco Nexus Dashboard Data Broker

This chapter has details about logging in and managing the Cisco Nexus Dashboard Data Broker, and overview of the GUI.

Beginning with Release 3.10.1, Cisco Nexus Data Broker (NDB) has been renamed to Cisco Nexus Dashboard Data Broker. However, some instances of NDB are present in this document, to correspond with the GUI, and installation folder structure. References of NDB/ Nexus Data Broker/ Nexus Dashboard Data Broker can be used interchangeably.

Configuring High Availability Clusters

Cisco Nexus Dashboard Data Broker supports high availability clustering in active/active mode with up to five controllers. To use high availability clustering with Cisco Nexus Dashboard Data Broker, you must edit the config.ini file for each instance of Cisco Nexus Dashboard Data Broker.

NDB supports the following cluster configurations – 2 nodes, 3 nodes, 5 nodes.

In case of a split-brain scenario, 2-node clusters, and 3-node (and 5-node) clusters are handled as follows:

  • 2-node cluster: Cluster health is indicated as Red. To avoid both the NDDB controllers (of the cluster) acting on the devices after split brain, both the NDDB nodes disconnect all devices. You cannot configure using the NDDB GUI. However, the state of the NDDB switch is not affected. To continue using the NDDB GUI, click Yes when you are prompted (pop-up) for an override operation. Ensure to click Yes for an override operation on only one of the clusters; clicking Yes for both the controllers in the clusters will lead to all the switches connected to the controller to an inconsistent state.

  • 3-node (and 5-node cluster): Cluster health is indicated as Yellow. At least fifty percent of the configured cluster nodes must be reachable for the cluster to be in an operational state. If not, the cluster nodes will move to a non-operational state; cluster health indicator is displayed as Red. There is no override option for 3 or more nodes cluster. Fix the VM and/or network link, as required.


Note


IPv6 is supported in centralized Nexus Dashboard Data Broker mode only, it is not supported in Embedded mode.


Table 1. Cluster Operation Status

Cluster Indicator

Cluster Status

Recommendation

Green

Operational

Yellow

Some of the cluster nodes are not available

Do not make any changes or add to the existing Nexus Dashboard Data Broker configuration.

Red

The node is isolated from the cluster.

Do not make any changes or add to the existing Nexus Dashboard Data Broker configuration.

Note: For two node cluster, you need to override in any one of the cluster node only, to ensure regular operation.

Before you begin

  • All IP addresses must be reachable and capable of communicating with each other.

  • All switches in the cluster must connect to all of the controllers.

  • All controllers must have the same HA clustering configuration information in the config.ini files.

  • All controllers must have the same information in the ndb/configuration/startup directory.

  • If using cluster passwords, all controllers must have the same password configured in the ndbjgroups.xml file.

Procedure


Step 1

Open a command window on one of the instances in the cluster.

Step 2

Navigate to the ndb/configuration directory that was created when you installed the software.

Step 3

Use any text editor to open the config.ini file.

Step 4

Locate the following text:

# HA Clustering configuration (semi-colon-separated IP addresses of all controllers that are part of the cluster.)
# supernodes=<ip1>;<ip2>;<ip3>;<ipn>

Step 5

Example:

IPv4 example.

# HA Clustering configuration (semi-colon-separated IP addresses of all controllers that are part of the cluster.)
supernodes=10.1.1.1;10.2.1.1;10.3.1.1;10.4.1.1;10.5.1.1

Example:

IPv6 example.

# HA Clustering configuration (semi-colon-separated IP addresses of all controllers that are part of the cluster.)
supernodes=2001:22:11::1;2001:33::44::1;2001:55:66::1

Step 6

Save the file and exit the editor.


What to do next

(Optional) Use this procedure to configure the delay time for a node and the number of retries.

  1. Open a command window on one of the instances in the cluster.

  2. Navigate to the ndb configuration directory.

  3. Use any text editor to open the ndbjgroups.xml file.

  4. Locate the following text:

    FD timeout="3000" max_tries="3"/
  5. Modify the Latency Time value and maximum_tries value.

  6. Save the file and exit the editor.

  7. Repeat the above steps for all the instances of the cluster.

Password Protecting High Availability Clusters

Procedure


Step 1

Open a command window on one of the instances in the cluster.

Step 2

Navigate to the ndb/configuration directory.

Step 3

Use any text editor to open the ndbjgroups.xml file.

Step 4

Locate the following text:

<!-- <AUTH auth_class="org.jgroups.auth.MD5Token" auth_value="ciscoXNC" token_hash="MD5"></AUTH> -->

Step 5

Remove the comments from the AUTH line.

Example:

<AUTH auth_class="org.jgroups.auth.MD5Token" auth_value="ciscoXNC" token_hash="MD5"></AUTH>

Step 6

(Optional) Change the password in the auth_value attribute.

By default, the cluster is protected with the password "ciscoXNC". You can change this password to whatever value you want, you need make the similar changes on all machines in the cluster.

Step 7

Save the file and exit the editor.


Logging in to Cisco Nexus Dashboard Data Broker GUI

You can login to the Cisco Nexus Data Broher GUI using HTTPS. The default HTTPS web link for the Cisco Nexus Dashboard Data Broker GUI is https://IP_address:8443/monitor.


Note


You must manually specify the https:// protocol in your web browser. The controller must also be configured for HTTPS.


Procedure


Step 1

In your web browser, enter the Cisco Nexus Dashboard Data Broker web link.

Step 2

On the launch page, do the following:

  1. Enter your username and password.

    The default username and password is admin/admin.

  2. Click LOGIN.


Changing Controller Access

An unencrypted (HTTP) access to the GUI and the API to the controller access is disabled by default. You cannot access the controller with the URL http://<host>:8080.

To change the controller access to HTTP, complete the following steps:

Before you begin

Cisco Nexus Dashboard Data Broker is shipped with a certificate for the HTTPS connection between the Cisco Nexus Dashboard Data Broker and a browser. You can change to a different certificate.

The script generateWebUIcertificate.sh is available in the ndb/configuration folder. If you execute this script, it moves the shipped certificate to old_keystore and the new certificate is generated in keystore. On the next Cisco Nexus Dashboard Data Broker restart, this new certificate is used.

Procedure


Step 1

Remove the comment character from the connector for port 8080 in the tomcat-server.xml files in the configuration directory as displayed in the following example:


<Service name="Catalina">
<!--
<Connector port="8080" protocol="HTTP/1.1"
connectionTimeout="20000"
redirectPort="8443" server="Cisco NDB" enableLookups="false" />
-->
<Connector port="8443" protocol="HTTP/1.1" SSLEnabled="true"
scheme="https" secure="true"
clientAuth="false" sslProtocol="TLS"
keystoreFile="configuration/keystore"
keystorePass="ciscondb" server="Cisco NDB"
connectionTimeout="60000" enableLookups="false" />

Step 2

Restart the controller.


Cisco Nexus Dashboard Data Broker GUI Overview

The Cisco Nexus Dashboard Data Broker GUI contains the following tabs and each of these tabs are discussed in detail (as separate chapters) in the subsequent pages of this guide.

For details about the header icons, see Header.

Components of a screen of the Cisco Nexus Dashboard Data Broker

When you click a tab/ sub-tab, the current information of the tab is displayed in a table.

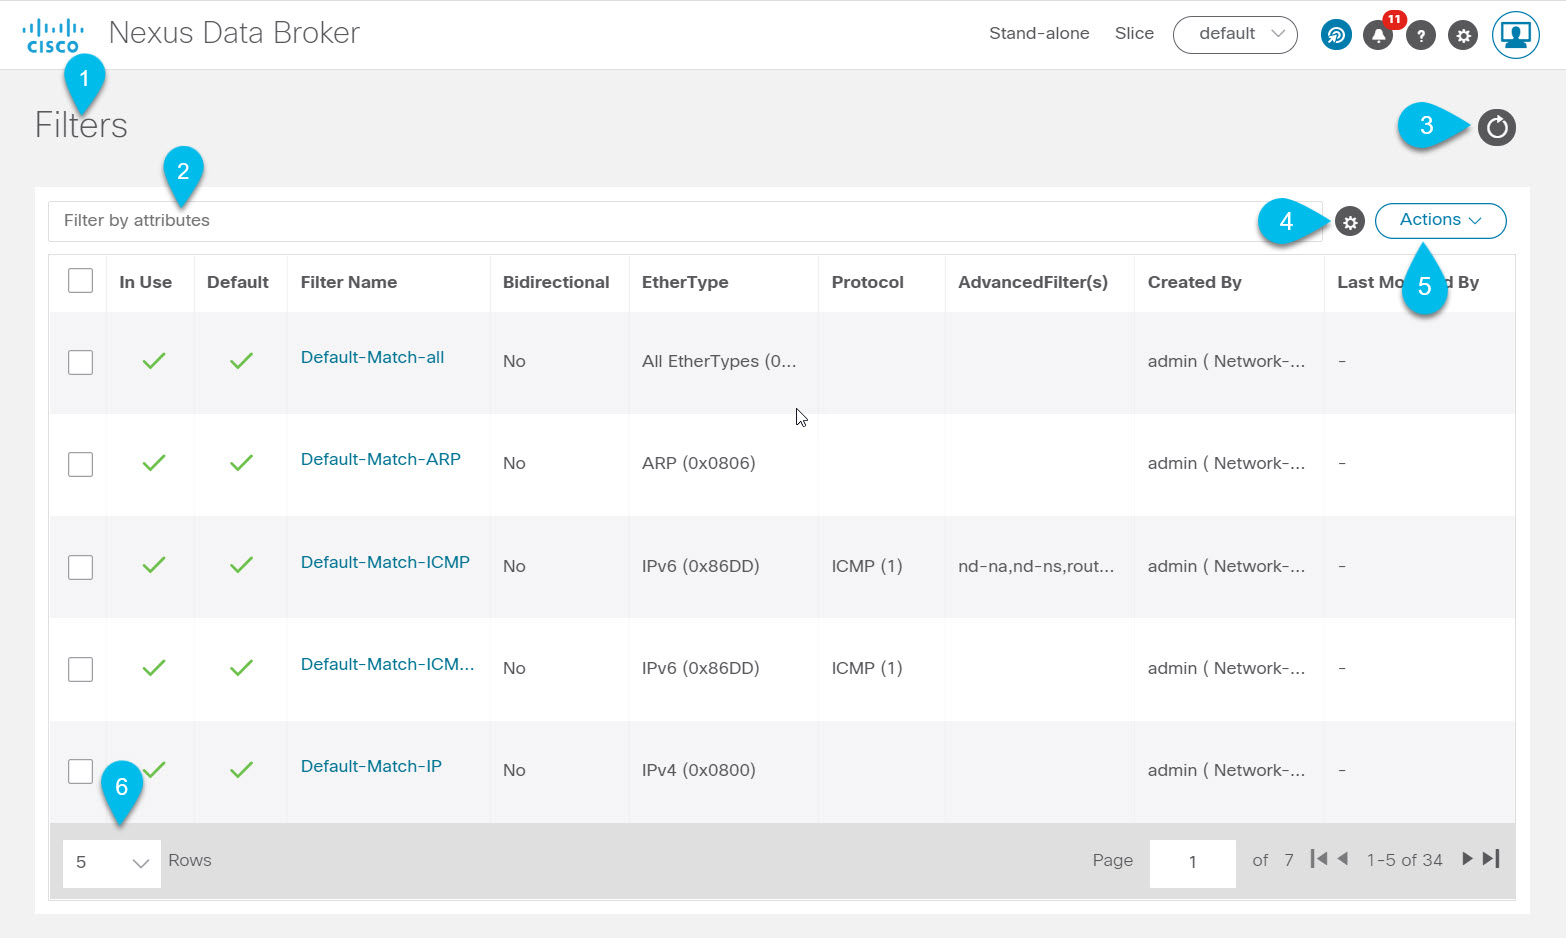
A typical screen representing one of the tabs of the Release 3.10.1 Cisco Nexus Dashboard Data Broker GUI is displayed here:

  • 1—Name of the tab/sub-tab.

  • 2—Use the Filter by attributes bar to filter the displayed table which has the details of the selected tab. Choose the attribute, operator and filter-value.

    You can also filter the displayed table based on the filter icon that appears when you hover over an element of the table.

  • 3—Use the Refresh icon to refresh the displayed details and get the latest information about the tab/ sub-tab.

  • 4—Use the Column Customization icon to select the columns you want to see in the displayed table.

  • 5—Click the Actions button to see the available actions for the screen.

  • 6—From the Rows drop-down list, select the number of rows to be displayed in the table.

Header

This section provides an overview of the Cisco Nexus Dashboard Data Broker GUI Header (upper right corner) icons:

Table 2. Cisco Nexus Dashboard Data Broker Header Icons

Icon

Description

Cluster

Displays the role of the current Nexus Dashboard Data Broker controller instance- either Primary (P) or Member (M). The IP addresses of the primary and member(s) are displayed; the IP address of the primary cluster is denoted with an (*).

If Nexus Dashboard Data Broker controller is not in a cluster, Stand-alone is displayed.

Slice

Displays the slice name the user is currently logged in to.

From the drop-down list, select another slice to change the network view.

Figure 1. Create
Provides quick navigation to often-used configuration and administration procedures.
Figure 2. Alarm

Displays the number of inconsistent NDB devices. Click the Alarm icon; you are directed to the Flow Management tab for details.

Figure 3. Help Menu-Bar

Displays the following options:

  • What's New—Displays new features for the latest release.

  • Help—Displays online help content.

Figure 4. System Tools Menu-Bar

Provides the following options:

  • Download Log—Enables you to download log files to your local machine.

  • Northbound API—takes you to the Swagger UI for details about Nexus Dashboard Data Broker REST APIs.

  • Session Timeout—Enables you to set the session timeout value.

  • About Nexus Dashboard Data Broker—Displays Nexus Dashboard Data Broker details such as, build and version.

Figure 5. User Profile Menu-Bar

Provides the following options:

  • Welcome User—Displays the current user of the GUI.

  • Change Password—Enables you to change the password of the current user.

  • Logout—Enables you to logout of the GUI.

Syslog

In the Nexus Dashboard Data Broker server backend, you can configure the logback.xml file to send logs to the Syslog server. You can customize the log format as per your requirement. The logback file is located at: /ndb/configuration/logback.xml


Note


If the Nexus Dashboard Data Broker server(s) are running, restart the servers after the changes are made in the logback.xml file.


Sample Syslog configuration:

Add below config with respective Syslog server IP address and port number in logback.xml file.
  <appender name="SYSLOG" class="ch.qos.logback.classic.net.SyslogAppender">
    <syslogHost>10.16.206.171</syslogHost>
    <facility>LOCAL7</facility>
    <port>514</port>
    <suffixPattern>[%thread] %logger %msg</suffixPattern>
  </appender>
  
Append "<appender-ref ref="SYSLOG" />" in root as shown below,
  <root level="error">
    <appender-ref ref="STDOUT" />
    <appender-ref ref="SYSLOG" />
    <appender-ref ref="ndb.log" />
  </root>

After an upgrade, these configuration changes in the logback.xml file are lost. Ensure to check and restore the configuration manually, after upgrading the controller to a newer Nexus Dashbaord Data Broker version.