Troubleshooting Tools

This chapter contains the following sections:

Consistency Checker Overview

The Consistency Checker verifies deployments after the initial deploy operation, and integrates the results of this tool within the Cisco ACI Multi-Site user interface. This feature verifies cross mappings. Only usable on a template that has been deployed, that is stretched across at least two sites and contains at least one of the following policies:

  • EPG

  • VRF

  • BD

  • External EPG

Verifying a Template that has Been Deployed Across Sites

This section describes how to verify a template that has been deployed across sites.

Before you begin

  • The template that has been depolyed across at least two stretched sites and contains at least one of the following policies:

    • EPG

    • VRF

    • BD

    • External EPG

Procedure


Step 1

Log in to the Multi-Site GUI.

Step 2

In the Main Menu, click Schemas, and on the Schema List page, choose the appropriate schema_name.

Step 3

Click on a deployed template.

Step 4

In the top right corner, click on unverified.
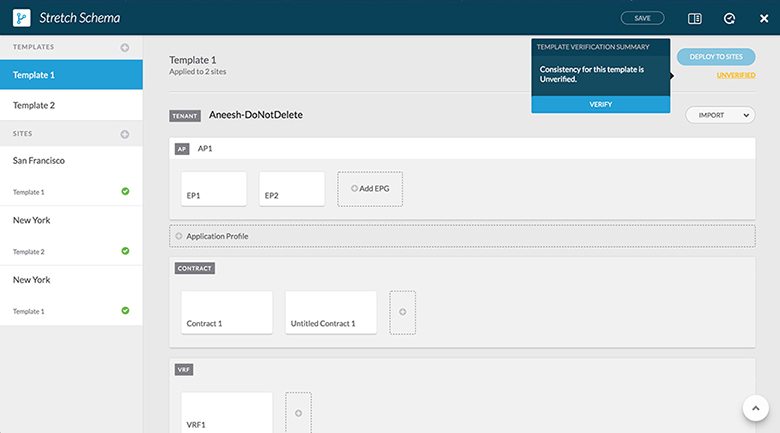
Step 5

In the TEMPLATE VERIFICATION SUMMARY dialog box, click VERIFY.

A popup message appears:

Consistency verification has been successfully triggered.

Step 6

The verification status will either be:

  • VERIFICATION SUCCESSFUL—No action is needed.

  • VERIFICATION FAILED—Action is needed.

  1. If the verification failed, click VERIFICATION FAILED.

  2. In the TEMPLATE VERIFICATION SUMMARY dialog box, for the site(s) that did fail, click on the pencil icon for a more detailed report of the template.

    Example:

    Hover over the red x for the description of the issue. The issue can either be Not Found (unable to locate) or Mismatch (misconfigured).

  3. You can either click DOWNLOAD or VERIFY TEMPLATE.

    • DOWNLOAD—Provides you the report for only the current site.

    • VERIFY TEMPLATE—Provides you the verified template across all sites.


Setting Up a Scheduled Verification for Every Deployed Template

This section describes how to set up a scheduled verification for every deployed template on a per tenant basis.

Procedure


Step 1

Log in to the Multi-Site GUI.

Step 2

In the Main Menu, click Tenant, and on the Tenant List page, click Set Schedule for the appropriate tenant_name.

Step 3

In the Consistency Checker Scheduler Settings, uncheck the Disabler Schedule, select the time and frequency.

  1. Click OK.


Troubleshooting an Error

This section describes how to troubleshoot an error.

Procedure


Step 1

Log in to the Multi-Site GUI.

Step 2

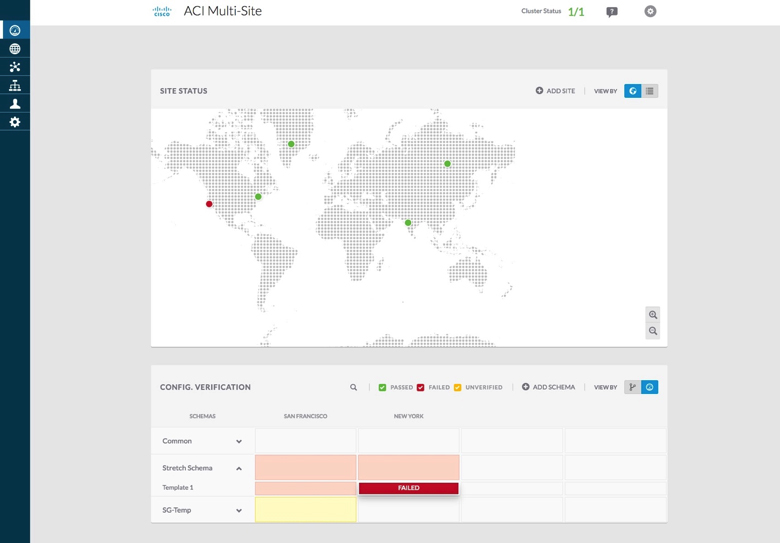
In the Dashboard, in the SCHEMA HEALTH section, in the view by field, click on the schema verification icon.

The small squares in a site represents the templates within the schema.

At a first glance, you can see what has passed, failed, or is unverified.

  • PASSED—is in green.

  • FAILED—is in red.

  • UNVERIFIED—is in yellow.

Step 3

Expand the schema that contains a site in red to show the templates.

Step 4

If you hover over the red sites, it displays FAILED.

Step 5

You can click on the FAILED site and it will bring up a more detailed report.

Example:
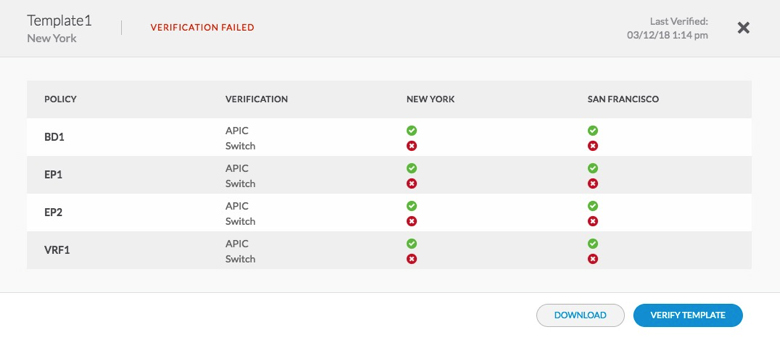
If you hover over the red x for the description of the issue. The issue can either be Not Found (unable to locate) or Mismatch (misconfigured).

  1. You can either click DOWNLOAD or VERIFY TEMPLATE.

    • DOWNLOAD—Provides you the report for only the current site.

    • VERIFY TEMPLATE—Provides you the verified template across all sites.

Step 6

You can also see which templates passed, failed or are unverified.
Step 7

(Optional) You can verify the entire schema, click on the and choose Verify Schema.

Step 8

(Optional) You can search by EPG, BD, VRF, or External EPG to find out which schema contains this policy.


Downloading System Logs

This section describes how to generate a troubleshooting report and infrastructure logs file for all the schemas, sites, tenants, and users that are managed by Cisco ACI Multi-Site Orchestrator.

Procedure


Step 1

Log in to your Multi-Site Orchestrator GUI.

Step 2

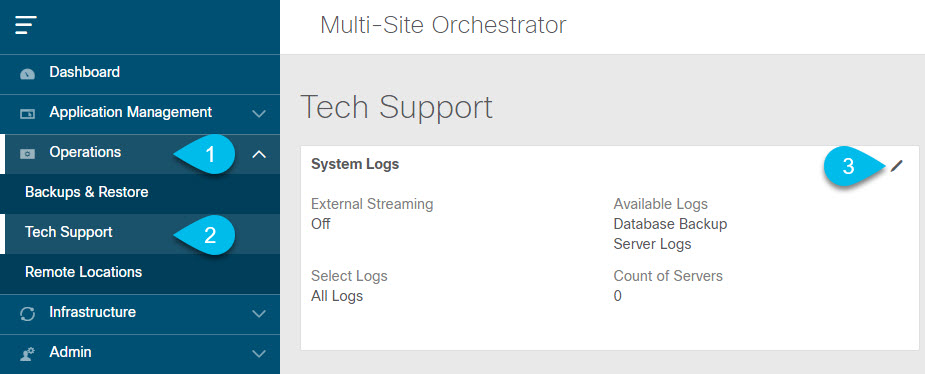
Open the System Logs screen.

  1. In the main menu, select Operations > Tech Support.

  2. In the top right corner of the System Logs frame, click the edit button.

Step 3

Download the logs.

  1. Select which logs you want to download.

  2. Click the Download button.

    An archive of the selected items will be downloaded to your system. The report contains the following information:

    • All schemas in JSON format

    • All sites definitions in JSON format

    • All tenants definitions in JSON format

    • All users definitions in JSON format

    • All logs of the containers in the infra_logs.txt file


Gathering Docker Container Information

You can log in to one of the Orchestrator VMs and gather information about the Docker services and its logs for specific containers. A number of useful Docker commands is available from the following cheat sheet: https://www.docker.com/sites/default/files/Docker_CheatSheet_08.09.2016_0.pdf.

Inspecting the Health of Docker Containers

To inspect the health of Docker services, you can use the docker service ls command. The output of the command lists the current health status of each service. All services should have all containers replicated as displayed in the REPLICAS column. If any one of them is down, there may be issues that need to be addressed.

# docker service ls
ID                  NAME                      MODE                REPLICAS  [...]
ve5m9lwb1qc4        msc_auditservice          replicated          1/1       [...]
bl0op2eli7bp        msc_authyldapservice      replicated          1/1       [...]
uxc6pgzficls        msc_authytacacsservice    replicated          1/1       [...]
qcws6ta7abwo        msc_backupservice         global              3/3       [...]
r4p3opyf5dkm        msc_cloudsecservice       replicated          1/1       [...]
xrm0c9vof3r8        msc_consistencyservice    replicated          1/1       [...]
le4gy9kov7ey        msc_endpointservice       replicated          1/1       [...]
micd93h5gj97        msc_executionengine       replicated          1/1       [...]
6wxh4mgnnfi9        msc_jobschedulerservice   replicated          1/1       [...]
lrj1764xw91g        msc_kong                  global              3/3       [...]
n351htjnks75        msc_kongdb                replicated          1/1       [...]
xcikdpx9o3i6        msc_mongodb1              replicated          1/1       [...]
u9b9ihxxnztn        msc_mongodb2              replicated          1/1       [...]
m0byoou6zuv5        msc_mongodb3              replicated          1/1       [...]
logqawe8k3cg        msc_platformservice       global              3/3       [...]
m3sxof6odn74        msc_schemaservice         global              3/3       [...]
3wd4zrqf6kbk        msc_siteservice           global              3/3       [...]
ourza0yho7ei        msc_syncengine            global              3/3       [...]
ojb8jkkrawqr        msc_ui                    global              3/3       [...]
zm94hzmzzelg        msc_userservice           global              3/3       [...]

Getting Container IDs

You can get the list of all running container IDs using the docker ps command.

# docker ps
CONTAINER ID    IMAGE                        COMMAND                  [...]
05f75d088dd1    msc-ui:2.1.2g                "/nginx.sh"              [...]
0ec142fc639e    msc-authyldap:v.4.0.6        "/app/authyldap.bin"     [...]
b08d78533b3b    msc-cloudsecservice:2.1.2g   "bin/cloudsecservice"    [...]
685f54b70a0d    msc-executionengine:2.1.2g   "bin/executionengine"    [...]
0c719107adce    msc-schemaservice:2.1.2g     "bin/schemaservice"      [...]
f2e3d144738c    msc-userservice:2.1.2g       "bin/userservice"        [...]
edd0d4604e27    msc-syncengine:2.1.2g        "bin/syncengine"         [...]
001616674a00    msc-siteservice:2.1.2g       "bin/siteservice"        [...]
7b30c61f8aa7    msc-platformservice:2.1.2g   "bin/platformservice"    [...]
d02923992d77    msc-backupservice:2.1.2g     "bin/backupservice"      [...]
9de72d291aaa    msc-kong:2.1.2g              "/docker-entrypoint.…"   [...]
6135f9de5dd2    msc-mongo:3.6                "sh -c 'sleep 3 && e…"   [...]

You can get the running container ID for a specific service using the docker ps | grep <service-name> command.

# docker ps | grep executionengine
685f54b70a0d    msc-executionengine:2.1.2g   "bin/executionengine"    [...]

To get all container IDs for a service, including the ones that are exited, you can use the docker ps –a | grep <service-name> command.

# docker ps -a | grep executionengine
685f54b70a0d    msc-executionengine:2.1.2g   "bin/executionengine"    Up 2 weeks (healthy)
3870d8031491    msc-executionengine:2.1.2g   "bin/executionengine"    Exited (143) 2 weeks ago

Viewing Container Logs

Use the docker logs <container-id> command to view the logs for a container. The logs for a container could be large as there are many files to be transferred, so consider your network speed when you run the command.

The sample location of the log files for a container is /var/lib/docker/containers/<container> There can be multiple <container>-json.log files.

# cd /var/lib/docker/containers
# ls -al
total 140
drwx------. 47 root root 4096 Jul  9 14:25 .
drwx--x--x. 14 root root 4096 May  7 08:31 ..
drwx------.  4 root root 4096 Jun 24 09:58 051cf8e374dd9a3a550ba07a2145b92c6065eb1071060abee12743c579e5472e
drwx------.  4 root root 4096 Jul 11 12:20 0eb27524421c2ca0934cec67feb52c53c0e7ec19232fe9c096e9f8de37221ac3
[...]
# cd 051cf8e374dd9a3a550ba07a2145b92c6065eb1071060abee12743c579e5472e/
# ls -al
total 48
drwx------.  4 root root 4096 Jun 24 09:58 .
drwx------. 47 root root 4096 Jul  9 14:25 ..
-rw-r-----.  1 root root 4572 Jun 24 09:58 051cf8e374dd9a3a550ba07a2145b92c6065eb1071060abee12743c579e5472e-json.log
drwx------.  2 root root    6 Jun 24 09:58 checkpoints
-rw-------.  1 root root 4324 Jun 24 09:58 config.v2.json
-rw-r--r--.  1 root root 1200 Jun 24 09:58 hostconfig.json
-rw-r--r--.  1 root root   13 Jun 24 09:58 hostname
-rw-r--r--.  1 root root  173 Jun 24 09:58 hosts
drwx------.  3 root root   16 Jun 24 09:58 mounts
-rw-r--r--.  1 root root   38 Jun 24 09:58 resolv.conf
-rw-r--r--.  1 root root   71 Jun 24 09:58 resolv.conf.hash

Viewing Docker Networks

You can view the list of networks used by Docker using the docker network list command.

# docker network list
NETWORK ID          NAME                DRIVER              SCOPE
c0ab476dfb0a        bridge              bridge              local
79f5e2d63623        docker_gwbridge     bridge              local
dee475371fcb        host                host                local
99t2hdts7et0        ingress             overlay             swarm
588qhaj3mrj1        msc_msc             overlay             swarm
a68901087366        none                null                local

Generating the API Call Logs

You can access the Multi-Site Orchestrator API call logs through the Infra Logs in a Troubleshooting Report. For information on generating troubleshooting, see Downloading System Logs.

You can also access the API call logs Multi-Site with the following steps:

Procedure


Step 1

Locate the worker node that has the msc-executionengine service running, as in the following example:

Example:

[root@worker1 ~]# docker ps
CONTAINER ID  IMAGE                       COMMAND                 CREATED      STATUS                PORTS      NAMES
1538a9289381  msc-kong:latest             "/docker-entrypoin..."  2 weeks ago  Up 2 weeks            7946/tcp,  msc_kong.1.ksdw45p0qhb6c08i3c8i4ketc
                                                                                                     8000-8001/tcp, 8443/tcp
cc693965f502  msc-executionengine:latest  "bin/executionengine"   2 weeks ago  Up 2 weeks (healthy)  9030/tcp   msc_executionengine.1.nv4j5uj5786yj621wjxsxvgxl
00f627c6804c  msc-platformservice:latest  "bin/platformservice"   2 weeks ago  Up 2 weeks (healthy)  9050/tcp   msc_platformservice.1.fw58jr62dfcme4noh67am0s73

In this case, on cc693965f502 the image is msc-executionengine:latest, find the -json.log, that contains the API calls from Multi-Site to the APIC controllers.

Step 2

Enter the command in the following example:

Example:

# cd /var/lib/docker/containers/cc693965f5027f291d3af4a6f2706b19f4ccdf6610de3f7ccd32e1139e31e712
# ls
cc693965f5027f291d3af4a6f2706b19f4ccdf6610de3f7ccd32e1139e31e712-json.log checkpoints config.v2.json hostconfig.json hostname 
hosts resolv.conf resolv.conf.hash shm

# less \
cc693965f5027f291d3af4a6f2706b19f4ccdf6610de3f7ccd32e1139e31e712-json.log | grep intersite
{"log":" \u003cfvBD name=\"internal\" arpFlood=\"yes\" intersiteBumTrafficAllow=\"yes\" unkMacUcastAct=\"proxy\" 
intersiteL2Stretch=\"yes\"\u003e\n","stream":"stdout","time":"2017-07-25T08:41:51.241428676Z"}
{"log":" \"intersiteBumTrafficAllow\" : true,\n","stream":"stdout","time":"2017-07-27T07:17:55.418934202Z"}
{"log":" \"intersiteBumTrafficAllow\" : true,\n","stream":"stdout","time":"2017-07-29T10:46:15.077426434Z"}
{"log":" \u003cfvBD name=\"internal\" arpFlood=\"yes\" intersiteBumTrafficAllow=\"yes\" unkMacUcastAct=\"proxy\" 
intersiteL2Stretch=\"yes\"\u003e\n","stream":"stdout","time":"2017-07-29T10:46:15.334099333Z"}
{"log":" \"intersiteBumTrafficAllow\" : true,\n","stream":"stdout","time":"2017-07-29T11:57:09.361401249Z"}
{"log":" \"intersiteBumTrafficAllow\" : true,\n","stream":"stdout","time":"2017-07-29T11:58:05.491624285Z"}
{"log":" \u003cfvBD name=\"internal\" arpFlood=\"yes\" intersiteBumTrafficAllow=\"yes\" unkMacUcastAct=\"flood\" 
intersiteL2Stretch=\"yes\"\u003e\n","stream":"stdout","time":"2017-07-29T11:58:05.673341176Z"}
{"log":" \u003cfvBD name=\"internal\" arpFlood=\"yes\" intersiteBumTrafficAllow=\"yes\" unkMacUcastAct=\"flood\" 
intersiteL2Stretch=\"yes\"\u003e\n","stream":"stdout","time":"2017-07-29T11:58:05.680167766Z"}
{"log":" \"intersiteBumTrafficAllow\" : true,\n","stream":"stdout","time":"2017-07-29T11:58:44.826160838Z"}
{"log":" \u003cfvBD name=\"internal\" arpFlood=\"yes\" intersiteBumTrafficAllow=\"yes\" unkMacUcastAct=\"proxy\" 
intersiteL2Stretch=\"yes\"\u003e\n","stream":"stdout","time":"2017-07-29T11:58:45.008739316Z"}
{"log":" \u003cfvBD name=\"internal\" arpFlood=\"yes\" intersiteBumTrafficAllow=\"yes\" unkMacUcastAct=\"proxy\" 
intersiteL2Stretch=\"yes\"\u003e\n","stream":"stdout","time":"2017-07-29T11:58:45.008812862Z"}

Reading the Execution Log

The execution log provides three different kinds of log information:

  • Websocket refresh information that is printed out every 5 minutes.

    2017-07-11 18:02:45,541 [debug] execution.serice.monitor.WSAPicActor - WebSocket connection open
    2017-07-11 18:02:45,542 [debug] execution.serice.monitor.WSAPicActor - Client 3 intialized
    2017-07-11 18:02:45,551 [debug] execution.serice.monitor.WSAPicActor - WSAPicActor stashing message Monitor Policy(WSMonitorQuery(/api/class/fvRsNodeAtt,?subscript
    2017-07-11 18:02:45,551 [debug] execution.serice.monitor.WSAPicActor - WSAPicActor stashing message RefreshClientTokenFailed()
    2017-07-11 18:02:45,551 [debug] execution.serice.monitor.WSAPicActor - WSAPicActor stashing message RefreshClientToken()
    2017-07-11 18:02:45,551 [debug] execution.serice.monitor.WSAPicActor - WSAPicActor stashing message RefreshClientToken()
    2017-07-11 18:02:50,042 [debug] execution.serice.monitor.WSAPicActor - Websocket connection open
    2017-07-11 18:02:50,042 [debug] execution.serice.monitor.WSAPicActor - Client 3 intialized
    2017-07-11 18:02:50,043 [debug] execution.serice.monitor.WSAPicActor - Initiate WS subscription for WSMonitorQuery(/api/class/fvRsNodeAtt,?subscript-yes&page-s
    2017-07-11 18:02:50,047 [debug] execution.serice.monitor.WSAPicActor - WSAPicActor stashing message RefreshClientToken()
    2017-07-11 18:02:50,047 [debug] execution.serice.monitor.WSAPicActor - WSAPicActor stashing message RefreshClientToken()
    2017-07-11 18:02:50,180 [debug] execution.serice.monitor.WSAPicActor - WSAPicActor stashing message akka.actor.LightArrayRevolerScheduler$TaskHolder@13d740ff
    2017-07-11 18:02:55,221 [debug] execution.serice.monitor.WSAPicActor - Websocket connection open
    2017-07-11 18:02:55,222 [debug] execution.serice.monitor.WSAPicActor - Client 3 intialized
    2017-07-11 18:02:55,233 [debug] execution.serice.monitor.WSAPicActor - Token Refreshed
    2017-07-11 18:02:55,323 [debug] execution.serice.monitor.WSAPicActor - Token Refreshed
  • The schema to push and the plan being generated.

  • Websocket monitoring VNID for cross VNID programming.

Note the following signs of errors:

  • Log lines starting with a red error.

  • Stacktrace for exceptions.

Verifying Policy Resolution on APIC Sites

In this task, use a REST API MO query on local APIC sites or switches to view the policies resolved on an APIC, for a site managed by Cisco ACI Multi-Site.

For diagrams of the managed objects (MO) relationships, see the Cisco APIC Management Information Model Reference (MIM). For example, in the MIM, see the diagram for fv:FabricExtConnP.

Procedure


Step 1

To view details for the logical MOs under the Fabric External Connection Profile (fabricExtConnP), log on to the APIC CLI and enter the following MO query:

Example:

admin@apic1:~> moquery -c fvFabricExtConnP -x "query-target=subtree" 
| egrep "#|dn"
# fv.IntersiteMcastConnP
dn: uni/tn-infra/fabricExtConnP-1/intersiteMcastConnP
# fv.IntersitePeeringP
dn: uni/tn-infra/fabricExtConnP-1/ispeeringP
# fv.IntersiteConnP
dn: uni/tn-infra/fabricExtConnP-1/podConnP-1/intersiteConnP-[5.5.5.1/32]
# fv.Ip
dn: uni/tn-infra/fabricExtConnP-1/podConnP-1/ip-[5.5.5.4/32]
# fv.PodConnP
dn: uni/tn-infra/fabricExtConnP-1/podConnP-1
# fv.IntersiteConnP
dn: uni/tn-infra/fabricExtConnP-1/siteConnP-6/intersiteConnP-[6.6.6.1/32]
# fv.IntersiteMcastConnP
dn : uni/tn-infra/fabricExtConnP-1/siteConnP-6/intersiteMcastConnP
# fv.SiteConnP
dn: uni/tn-infra/fabricExtConnP-1/siteConnP-6
# l3ext.FabricExtRoutingP
dn: uni/tn-infra/fabricExtConnP-1/fabricExtRoutingP-default
# fv.FabricExtConnP
dn: uni/tn-infra/fabricExtConnP-1
Step 2

To view the logical MOs for the L3Out used for Multi-Site connections, log on to the APIC CLI and enter an MO query, such as the following:

Example:

admin@apic1:~> moquery -c l3extOut -x "query-target=subtree" | egrep 
"#|dn.*intersite" | grep -B 1 dn
# bgp.ExtP
dn: uni/tn-infra/out-intersite/bgpExtP
# fv.RsCustQosPol
dn: uni/tn-infra/out-intersite/instP-intersiteInstP/rscustQosPol
# l3ext.InstP
dn: uni/tn-infra/out-intersite/instP-intersiteInstP
# bgp.AsP
dn: uni/tn-infra/out-intersite/lnodep-node-501-profile/infraPeerP-[6.6.6.3]/as
# bgp.RsPeerPfxPol
dn: uni/tn-infra/out-intersite/lnodep-node-501-profile/infraPeerP-[6.6.6.3]/rspeerPfxPol
# bgp.InfraPeerP
dn: uni/tn-infra/out-intersite/lnodep-node-501-profile/infraPeerP-[6.6.6.3]
# l3ext.RsEgressQosDppPol
dn: uni/tn-infra/out-intersite/lnodep-node-501-profile/lifp-port-1-1/rsegressQosDppPol
# l3ext.RsIngressQosDppPol
dn: uni/tn-infra/out-intersite/lnodep-node-501-profile/lifp-port-1-1/rsingressQosDppPol
# l3ext.RsNdIfPol
dn: uni/tn-infra/out-intersite/lnodep-node-501-profile/lifp-port-1-1/rsNdIfPol
# l3ext.RsPathL3OutAtt
dn: uni/tn-infra/out-intersite/lnodep-node-501-profile/lifp-port-1-1/rspathL3OutAtt-
[topology/pod-1/paths-501/pathep-[eth1/1]]
# ospf.RsIfPol
dn: uni/tn-infra/out-intersite/lnodep-node-501-profile/lifp-port-1-1/ospfIfP/rsIfPol
# ospf.IfP
dn: uni/tn-infra/out-intersite/lnodep-node-501-profile/lifp-port-1-1/ospfIfP
# l3ext.LIfP
dn: uni/tn-infra/out-intersite/lnodep-node-501-profile/lifp-port-1-1
# l3ext.InfraNodeP
dn: uni/tn-infra/out-intersite/lnodep-node-501-profile/rsnodeL3OutAtt-
[topology/pod-1/node-501]/infranodep
# l3ext.IntersiteLoopBackIfP
dn: uni/tn-infra/out-intersite/lnodep-node-501-profile/rsnodeL3OutAtt-
[topology/pod-1/node-501]/sitelbp-[5.5.5.3]
# l3ext.RsNodeL3OutAtt
dn: uni/tn-infra/out-intersite/lnodep-node-501-profile/rsnodeL3OutAtt-
[topology/pod-1/node-501]
# l3ext.LNodeP
dn: uni/tn-infra/out-intersite/lnodep-node-501-profile
# l3ext.RsEctx
dn: uni/tn-infra/out-intersite/rsectx
# l3ext.RsL3DomAtt
dn: uni/tn-infra/out-intersite/rsl3DomAtt
# ospf.ExtP
dn: uni/tn-infra/out-intersite/ospfExtP
# l3ext.Out
dn: uni/tn-infra/out-intersite--
# l3ext.ConfigOutDef
dn: uni/tn-infra/out-intersite/instP-intersiteInstP/configOutDef 
Step 3

To view the resolved MOs for an APIC local site, log on to the APIC CLI and enter an MO query such as the following:

Example:

admin@apic1:~> moquery -c fvSite -x "query-target=subtree" | egrep "#|dn"
# fv.RemoteBdDef
dn: resPolCont/sitecont/site-6/remotebddef-[uni/tn-msite-tenant-welkin/BD-internal]
# fv.RemoteCtxDef
dn: resPolCont/sitecont/site-6/remotectxdef-[uni/tn-msite-tenant-welkin/ctx-dev]
# fv.RemoteEPgDef
dn: resPolCont/sitecont/site-6/remoteepgdef-[uni/tn-msite-tenant-welkin/ap-Ebiz/epg-data]
# fv.RemoteEPgDef
dn: resPolCont/sitecont/site-6/remoteepgdef-[uni/tn-msite-tenant-welkin/ap-Ebiz/epg-web]
# fv.Site
dn: resPolCont/sitecont/site-6
# fv.LocalBdDef
dn: resPolCont/sitecont/site-5/localbddef-[uni/tn-msite-tenant-welkin/BD-internal]
# fv.LocalCtxDef
dn: resPolCont/sitecont/site-5/localctxdef-[uni/tn-msite-tenant-welkin/ctx-dev]
# fv.LocalEPgDef
dn: resPolCont/sitecont/site-5/localepgdef-[uni/tn-msite-tenant-welkin/ap-Ebiz/epg-web]
# fv.LocalEPgDef
dn: resPolCont/sitecont/site-5/localepgdef-[uni/tn-msite-tenant-welkin/ap-Ebiz/epg-data]
# fv.Site
dn: resPolCont/sitecont/site-5
Step 4

To view the concrete MOs on a switch for a Multi-Site site, log on to the switch and enter an MO query such as the following:

Example:

spine501# moquery -c dci.LocalSite -x "query-target=subtree" | egrep "#|dn"
# l2.RtToLocalBdSubstitute       //(site5 vrf 2195456 -> bd 15794150 is translated to 
site6 vrf 2326528 -> bd 16449430)
dn: sys/inst-overlay-1/localSite-5/localCtxSubstitute-[vxlan-2195456]/localBdSubstitute-
[vxlan-15794150]/rttoLocalBdSubstitute-[sys/inst-overlay-1/remoteSite-6/remoteCtxSubstitute-
[vxlan-2326528]/remoteBdSubstitute-[vxlan-16449430]]
# l2.LocalBdSubstitute
dn: sys/inst-overlay-1/localSite-5/localCtxSubstitute-[vxlan-2195456]/localBdSubstitute-
[vxlan-15794150]
# l2.RtToLocalPcTagSubstitute    //(site5 vrf 2195456 -> pcTag 49154 is translated to 
site6 vrf 2326528 - > pcTag 32770)
dn: sys/inst-overlay-1/localSite-5/localCtxSubstitute-[vxlan-2195456]/localPcTagSubstitute-
49154/rttoLocalPcTagSubstitute-[sys/inst-overlay-1/remoteSite-6/remoteCtxSubstitute-
[vxlan-2326528]/remotePcTagSubstitute-32770]
# l2.LocalPcTagSubstitute
dn: sys/inst-overlay-1/localSite-5/localCtxSubstitute-[vxlan-2195456]/localPcTagSubstitute-
49154# l2.RtToLocalPcTagSubstitute    //(site5 vrf 2195456 -> pcTag 16387 is translated to site6 
vrf 2326528 - > pcTag 16386)
dn: sys/inst-overlay-1/localSite-5/localCtxSubstitute-[vxlan-2195456]/localPcTagSubstitute-
16387/rttoLocalPcTagSubstitute-[sys/inst-overlay-1/remoteSite-6/remoteCtxSubstitute-
[vxlan-2326528]/remotePcTagSubstitute-16386]
# l2.LocalPcTagSubstitute 
dn: sys/inst-overlay-1/localSite-5/localCtxSubstitute-[vxlan-2195456]/localPcTagSubstitute-
16387# l3.RtToLocalCtxSubstitute      //(site5 vrf 2195456  is translated to site6 vrf 2326528)
dn: sys/inst-overlay-1/localSite-5/localCtxSubstitute-[vxlan-2195456]/rttoLocalCtxSubstitute-
[sys/inst-overlay-1/remoteSite-6/remoteCtxSubstitute-[vxlan-2326528]]
# l3.LocalCtxSubstitute
dn: sys/inst-overlay-1/localSite-5/localCtxSubstitute-[vxlan-2195456]
# dci.LocalSite
dn: sys/inst-overlay-1/localSite-5

What to look for: The output displays the data translated between sites. In this example, the original data on the sites was as follows:

  • site5 vrf msite-tenant-welkin:dev -> vxlan 2195456, bd internal -> vxlan 15794150, epg web: access-encap 200 → pcTag 49154, access-encap 201 → pcTag 16387

  • site6 vrf msite-tenant-welkin:dev -> vxlan 2326528, bd internal -> vxlan 16449430, epg web: access-encap 200 ->pcTag 32770,access-encap 201 ->pcTag 16386

Step 5

To verify the concrete MOs for a remote site, enter an MO query such as the following:

Example:

spine501# moquery -c dci.RemoteSite -x "query-target=subtree" 
| egrep "#|dn"
# dci.AnycastExtn
dn: sys/inst-overlay-1/remoteSite-6/anycastExtn-[6.6.6.1/32] 
// attribute is_unicast is Yes, Unicast ETEP
# dci.AnycastExtn
dn: sys/inst-overlay-1/remoteSite-6/anycastExtn-[6.6.6.2/32] 
// attribute is_unicast is No, Multicast ETEP
# l2.RsToLocalBdSubstitute
dn: sys/inst-overlay-1/remoteSite-6/remoteCtxSubstitute-[vxlan-2326528]/remoteBdSubstitute-
[vxlan-16449430]/rsToLocalBdSubstitute
# l2.RemoteBdSubstitute
dn: sys/inst-overlay-1/remoteSite-6/remoteCtxSubstitute-[vxlan-2326528]/remoteBdSubstitute-
[vxlan-16449430]
# l2.RsToLocalPcTagSubstitute
dn: sys/inst-overlay-1/remoteSite-6/remoteCtxSubstitute-[vxlan-2326528]/remotePcTagSubstitute-
32770/rsToLocalPcTagSubstitute
# l2.RemotePcTagSubstitute
dn: sys/inst-overlay-1/remoteSite-6/remoteCtxSubstitute-[vxlan-2326528]/remotePcTagSubstitute-
32770# l2.RsToLocalPcTagSubstitute
dn: sys/inst-overlay-1/remoteSite-6/remoteCtxSubstitute-[vxlan-2326528]/remotePcTagSubstitute-
16386/rsToLocalPcTagSubstitute
# l2.RemotePcTagSubstitute
dn: sys/inst-overlay-1/remoteSite-6/remoteCtxSubstitute-[vxlan-2326528]/remotePcTagSubstitute-
16386# l3.RsToLocalCtxSubstitute
dn: sys/inst-overlay-1/remoteSite-6/remoteCtxSubstitute-[vxlan-2326528]/rsToLocalCtxSubstitute
# l3.RemoteCtxSubstitute
dn: sys/inst-overlay-1/remoteSite-6/remoteCtxSubstitute-[vxlan-2326528]
# dci.RemoteSite
dn: sys/inst-overlay-1/remoteSite-6