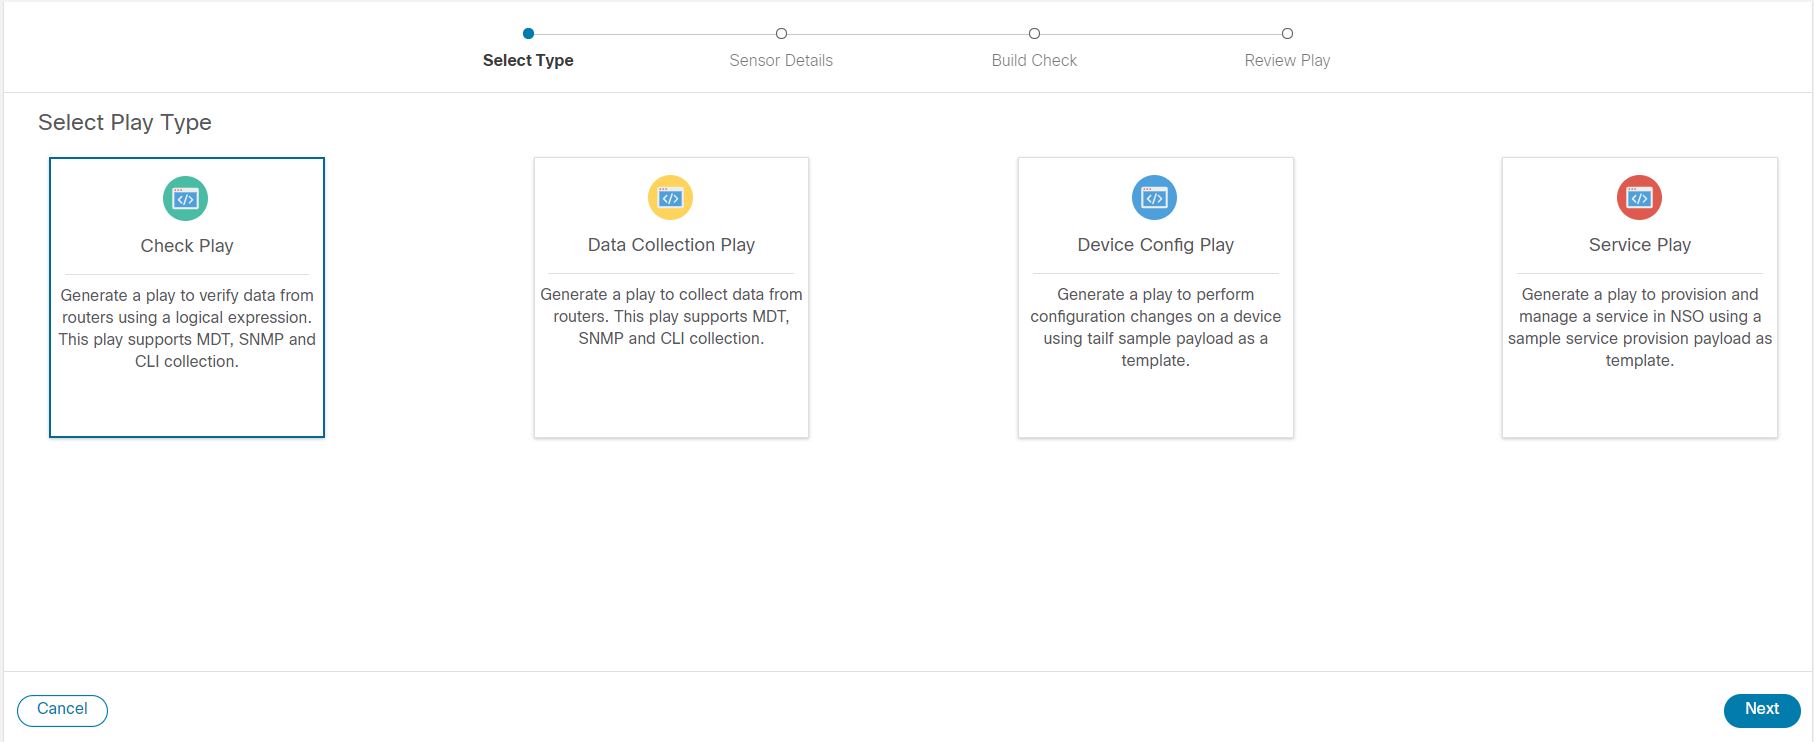
Change Automation Overview
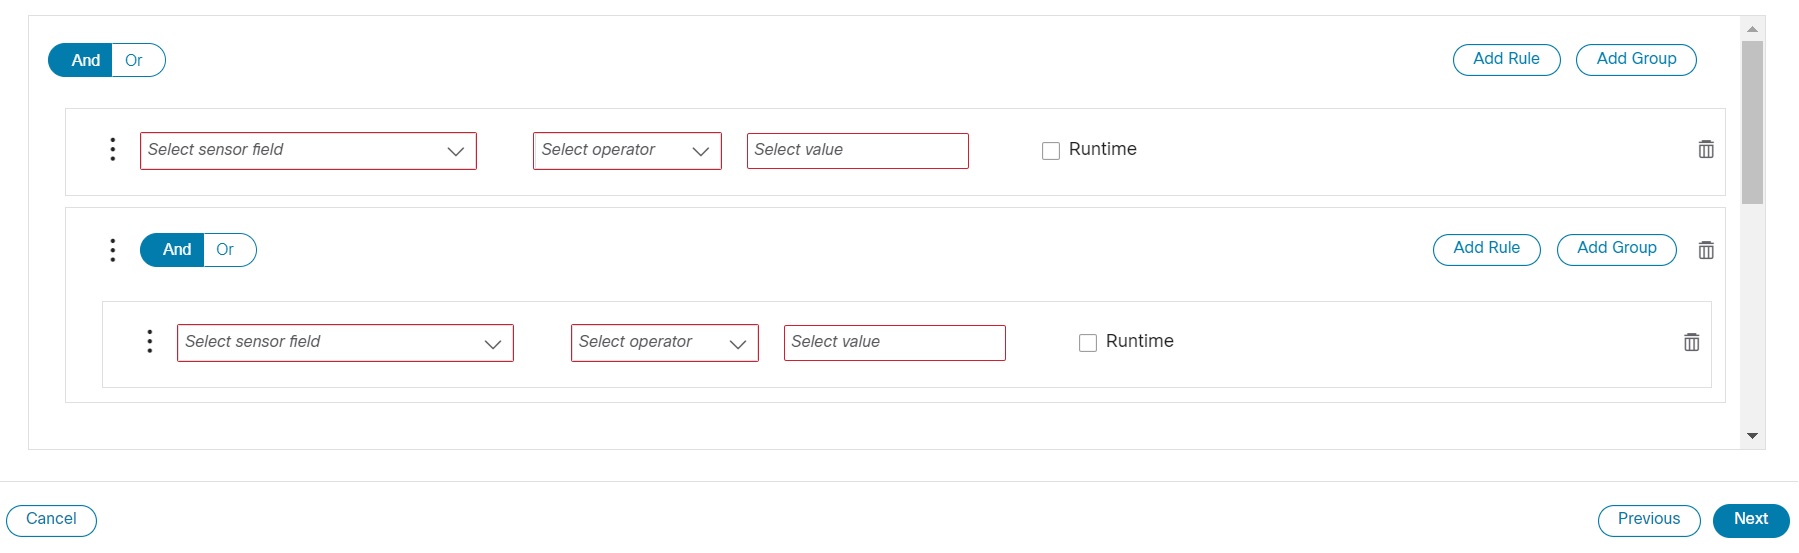
The Change Automation application automates the process of deploying changes to the network. You can define automation tasks to achieve the intended network states in Change Automation using Playbooks that consists of plays written using YAML. You can then push configuration changes to Cisco Network Service Orchestrator (NSO), which deploys these changes to the network devices.
The difference between Change Automation and other existing scripted automation frameworks is that Change Automation is a closed-loop framework. Changes are deployed to the router or other device using programmable APIs, and the intent of the change is verified using telemetry that comes back in the router. Change Automation relies on telemetry to verify the intent of the change, avoiding the need to frequently poll the device for updates.
The following is a high level Change Automation workflow:
-
Review the existing plays and Playbooks to see if any of them meet your needs fully or partially.

Note
Change Automation comes with a robust library of Playbooks, each with its own collection of configuration and check plays.
-
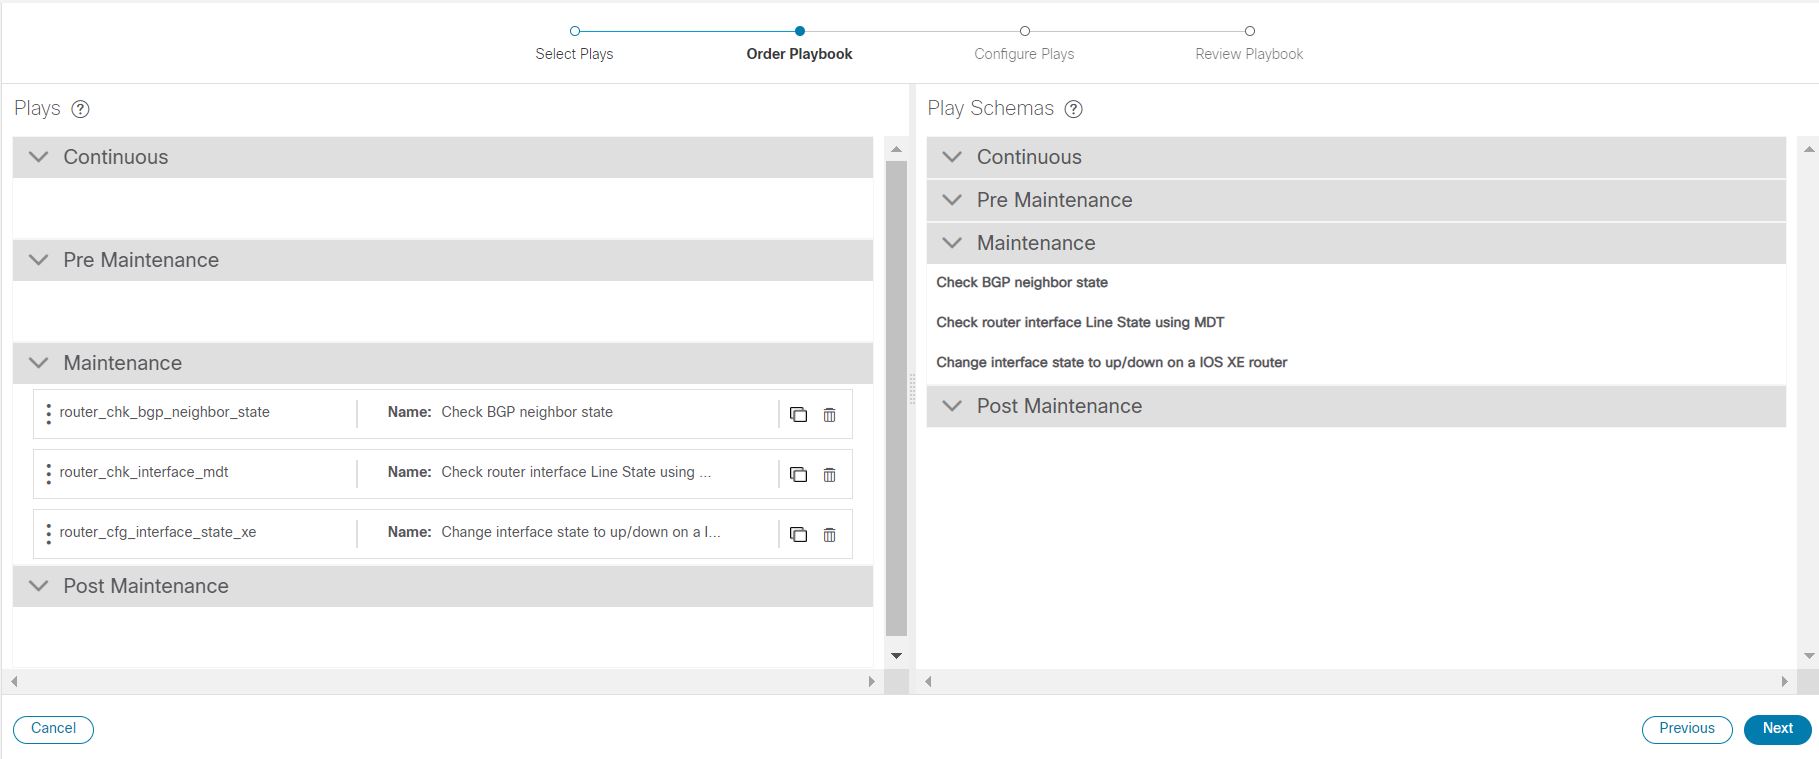
Build Playbook as required:
-
If the required Playbook is available, use it.
-
If the required Playbook is not available, build a new Playbook using the existing plays.
-
If some of the required plays are not available, create new plays and build a new Playbook using the new and existing plays.
-
-
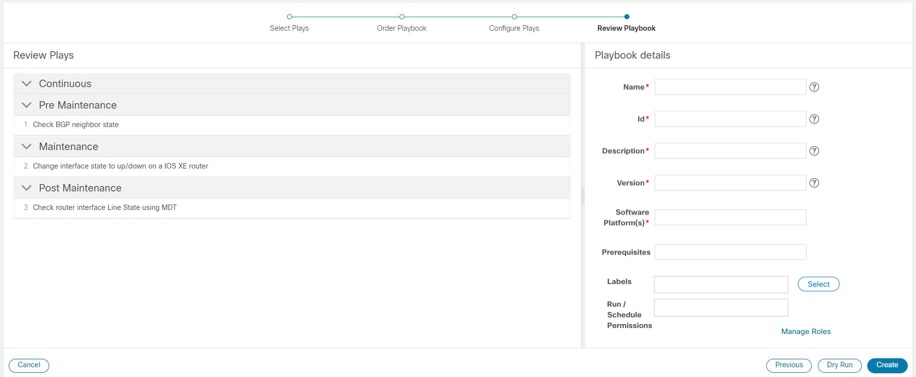
Dry run the Playbook to test if it accomplishes the desired changes in the network.
-
Deploy the Playbook.
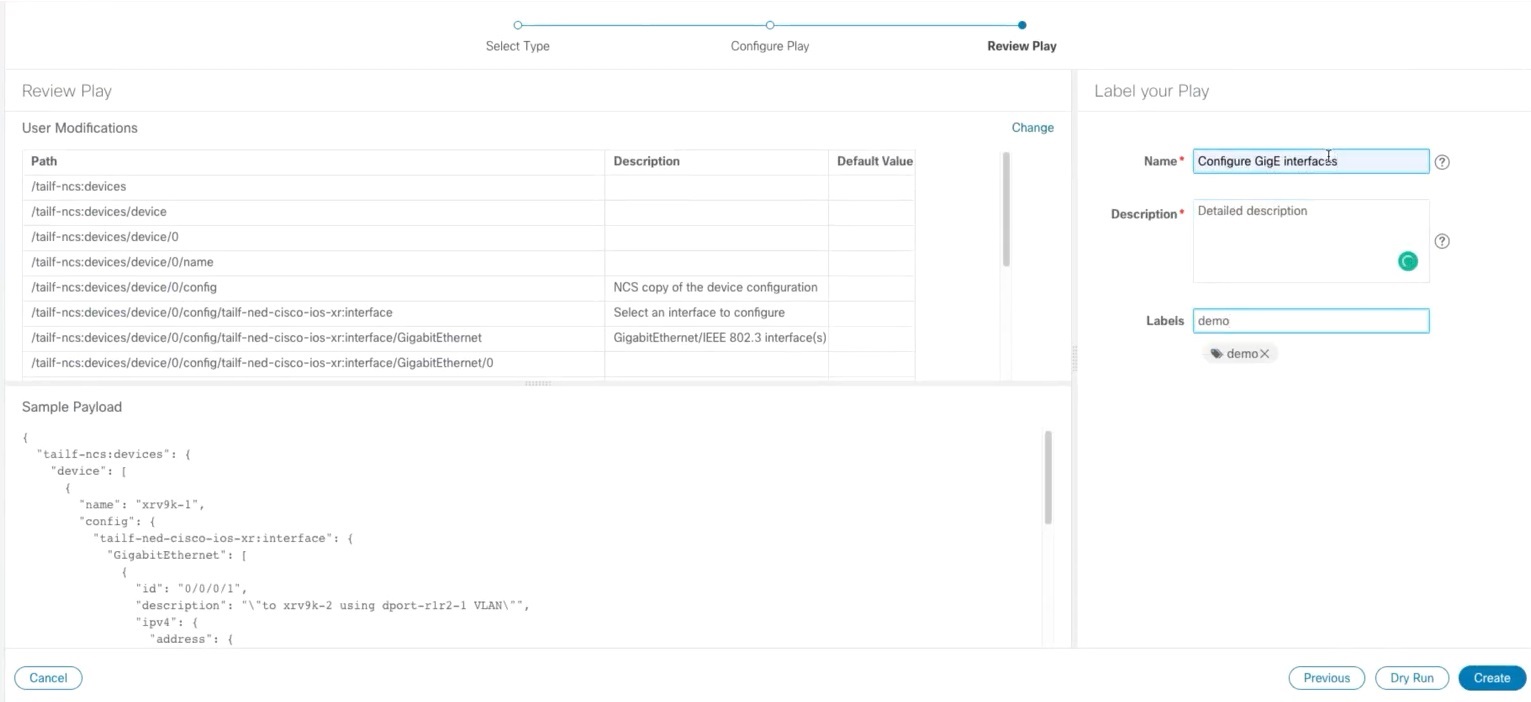
Change Automation allows you to customize and generate plays and Playbooks using its API interface. For more information, see About Custom Plays and About Customizing Playbooks.
Configure Change Automation Settings
Configuring Change Automation settings is a post-installation activity and is the first task to be performed after installing Change Automation. This section explains the initial settings that must be configured before you can start using Change Automation.
Note |
The Change Automation settings can only be configured once. If you want to modify the settings, Change Automation must be re-installed. Before reinstalling, make sure to export the Playbooks, and after reinstalling, import the Playbooks. For more information, see Export Playbooks and Import Playbooks. |
System settings
After Change Automation is installed in your Crosswork platform, you can access Change Automation in the main menu (go to ). The Change Automation window is displayed prompting you to complete the configuration. Click Start Configuration to review the change Automation settings. Alternatively, you can navigate to to view the settings.
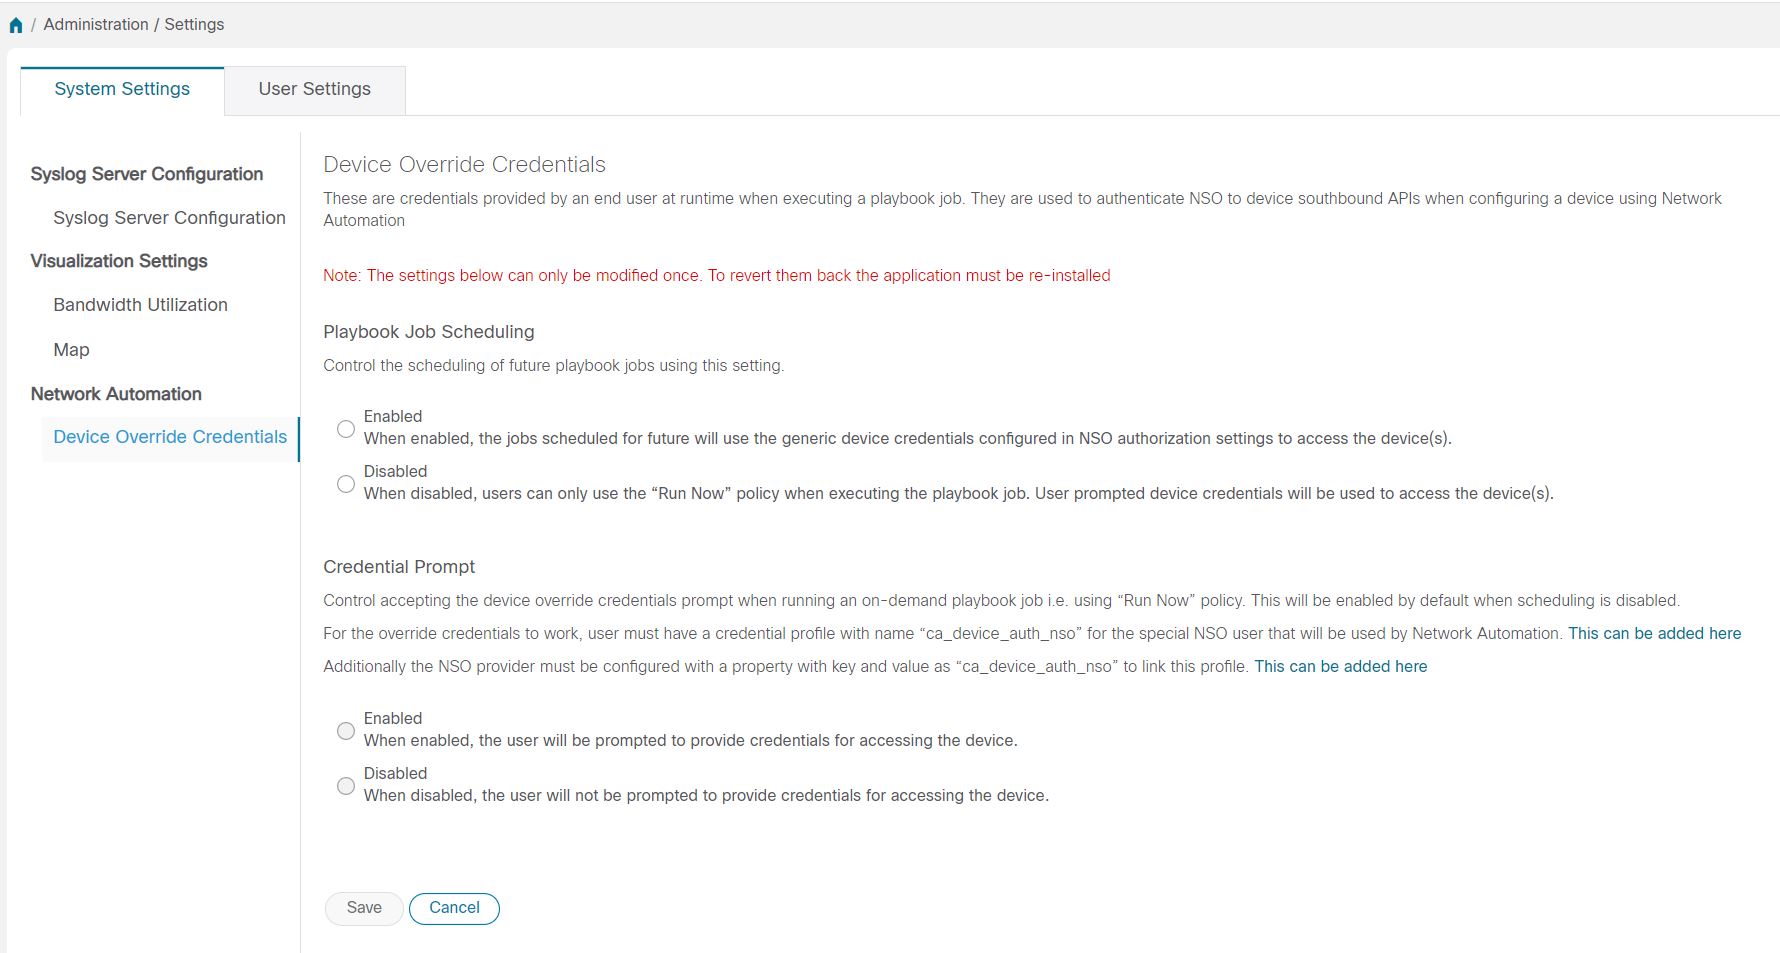
Click Save after you configure the following settings:
-
Playbook Job Scheduling: Enable or disable the ability the schedule the Playbook jobs.
-
Credential Prompt: Device override credentials are an additional level of authentication that can improve change auditing. If enabled, users will be prompted to enter the credentials (device override credentials) before each Playbook execution. If disabled, you must create the relevant credential profile and provider settings for the override credentials to work. Follow the prompts on the window to meet each requirement.
Note |
If Playbook Job Scheduling is disabled, then the Credential Prompt is enabled, by default. You cannot disable the credential prompt in this case. |
Note |
While executing Device Config plays, entering incorrect device override credentials will cause the playbook execution to fail. However, for a Check play or Data Collection play, the device override credentials are not validated and the Playbook will execute successfully irrespective of the accuracy of the override credentials. Device override credentials are only validated while pushing configuration changes. |
Note |
Also, users with write permissions for the Administration APIs under Change Automation (Go to ) can only perform this task. |
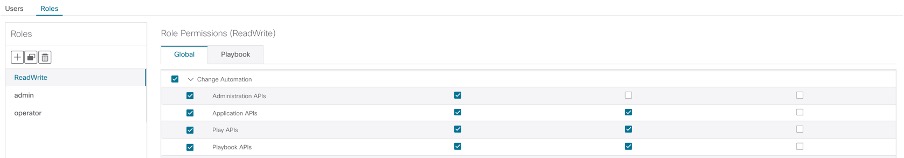
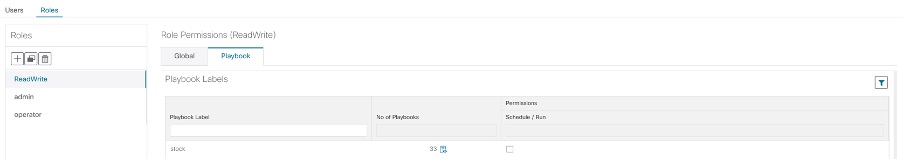
Assign proper level of access to other users
Once the system settings are completed, the admin user must review the user roles to make sure that all the users they have are configured with the proper level of access to run, import, and create Plays and Playbooks. To provide the access, the admin user must:
-
Go to .
-
Under Roles pane, select the role for which you want to grant the access.
-
Under the , enable Read and Write check boxes (as necessary) for Play APIs and Playbook APIs under Change Automation.
Note
Also, the user with write permissions for Administration APIs can only disable or enable run Playbook access and assign labels.
Use the Change Automation Dashboard
The Change Automation application's Dashboard window (shown in the figure below) lets you view all Playbook-related activity and initiate Playbook runs. It displays the total number of Playbooks, the Playbook Jobs Calendar, the most recently run Playbook jobs, and the same network topology map you see when you select Topology from the main menu.
To view the Change Automation Dashboard window, select .
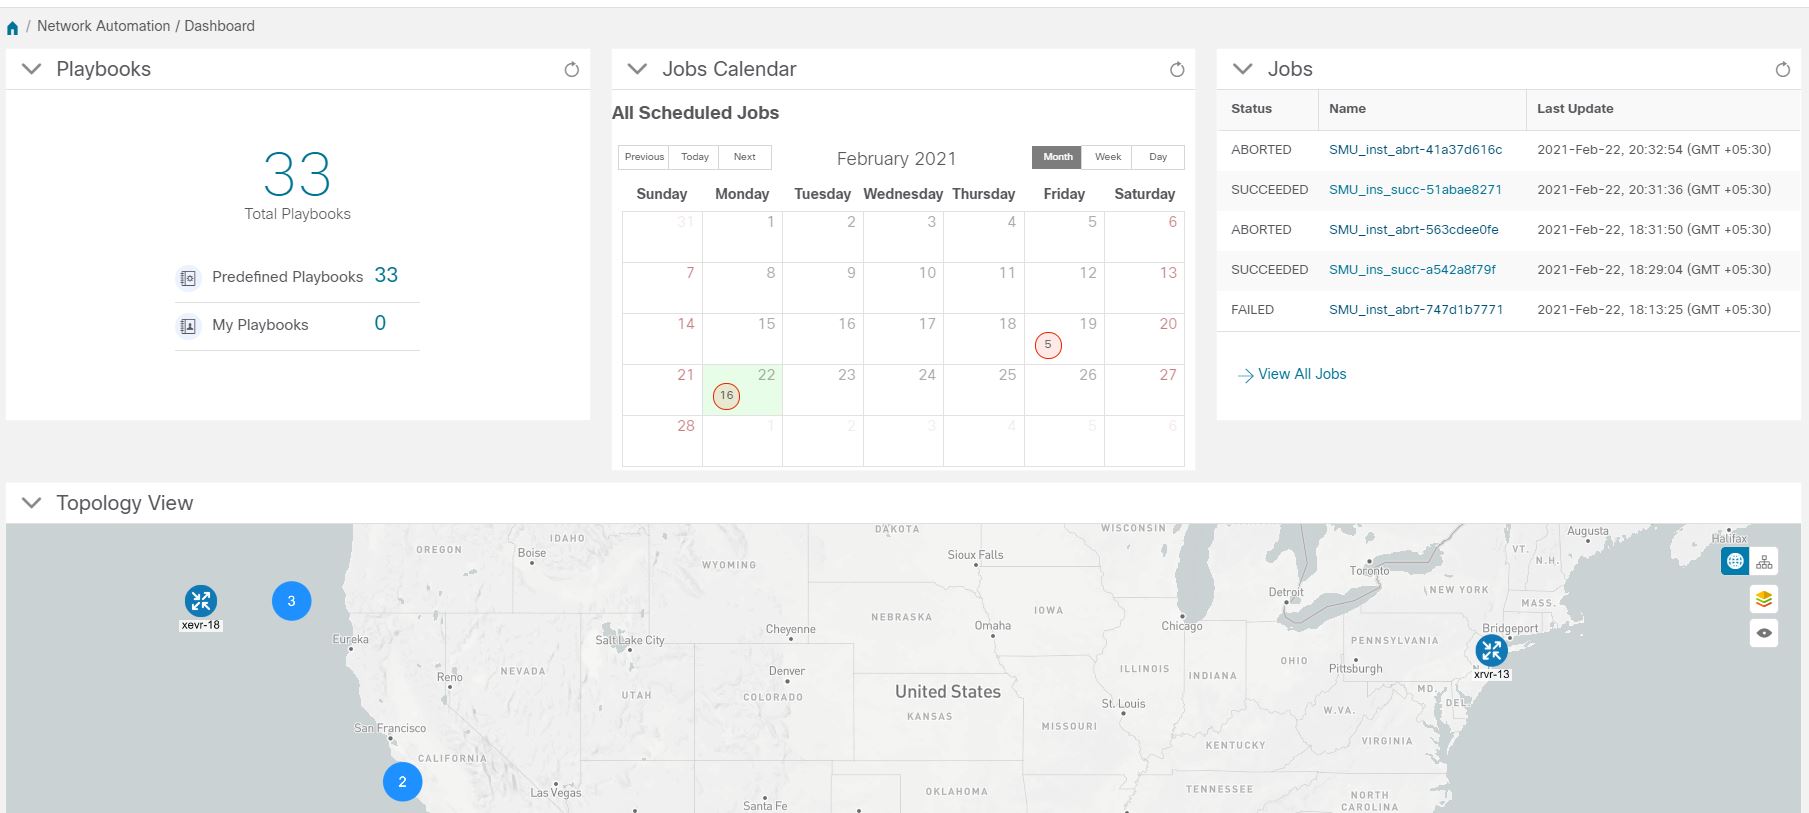
The Playbooks tile displays the total number of Playbooks (pre-defined and custom). Clicking on a specific number displays all the Playbooks that correspond to the selected category.
Note |
Total Playbooks indicate the total number of pre-defined and user created. Playbooks (My Playbooks) that exist in the system. Predefined Playbooks indicate the number of pre-defined Playbooks that exist in the system. My Playbooks indicate the number of custom Playbooks that are created by the current user. Creating Playbooks does not use a license. The license count is incremented only upon the first execution of a Playbook (pre-defined or user created), irrespective of whether the Playbook runs successfully or not. Subsequent execution of the Playbook does not increment the license count. |
The Jobs Calendar tile displays a calendar (month, week, day) with the number of job sets executed on a given day that is marked in a circle against the corresponding date. Clicking on the number displays a dialog box with the names of the Playbook job sets and their execution time. Click the desired job set to view the execution details.
Note |
The color of the circle indicates the overall status of the job sets.
|
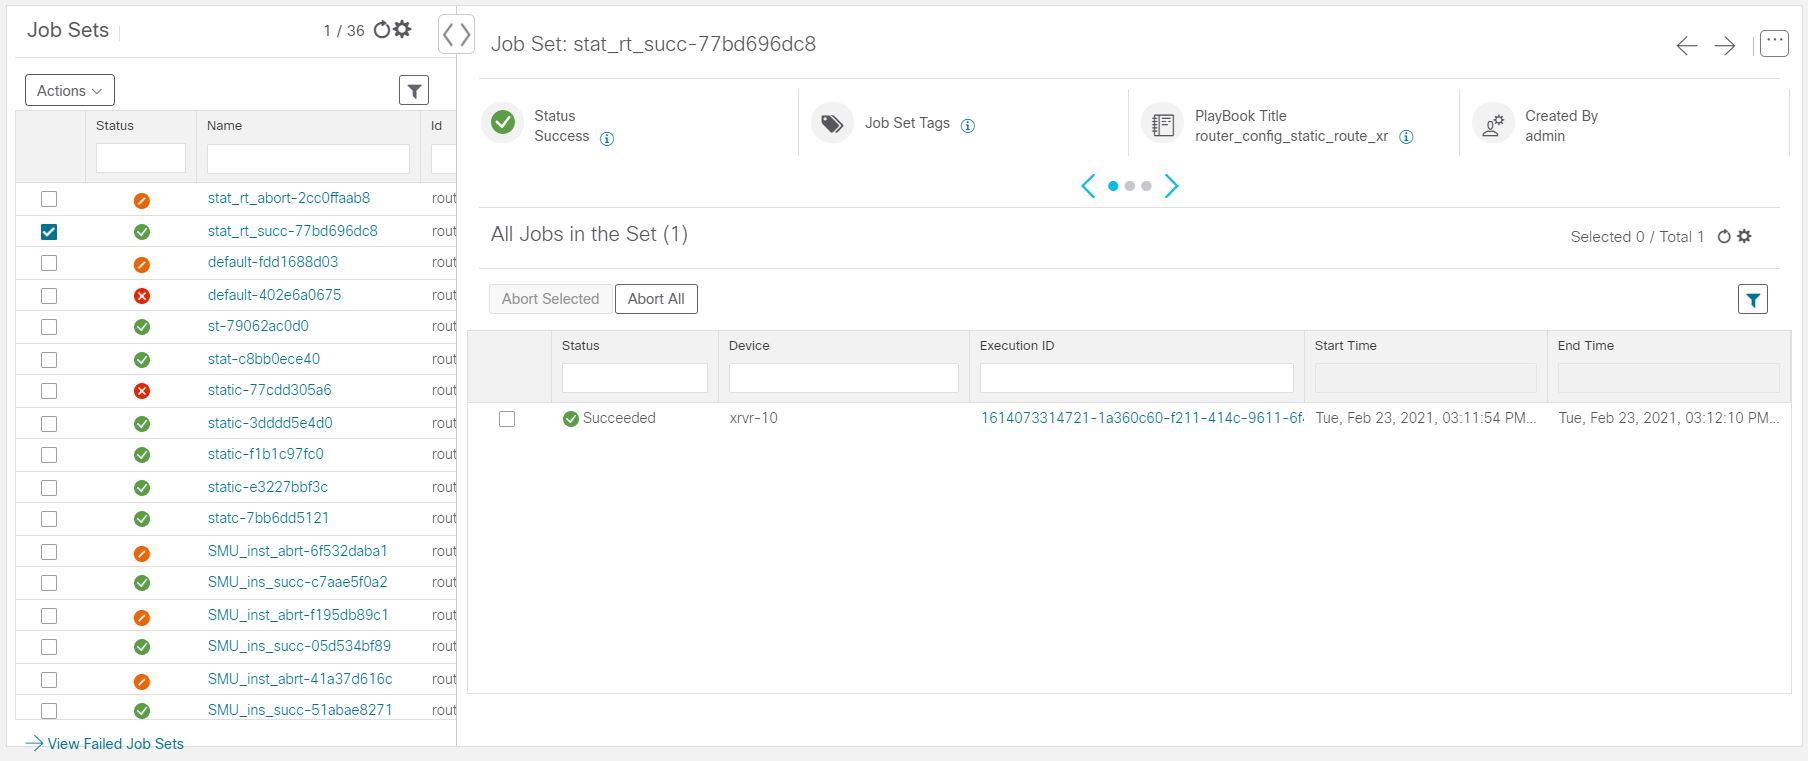
The View All Jobs link on the Jobs tile give you direct access to the Change Automation Automation Job History window.
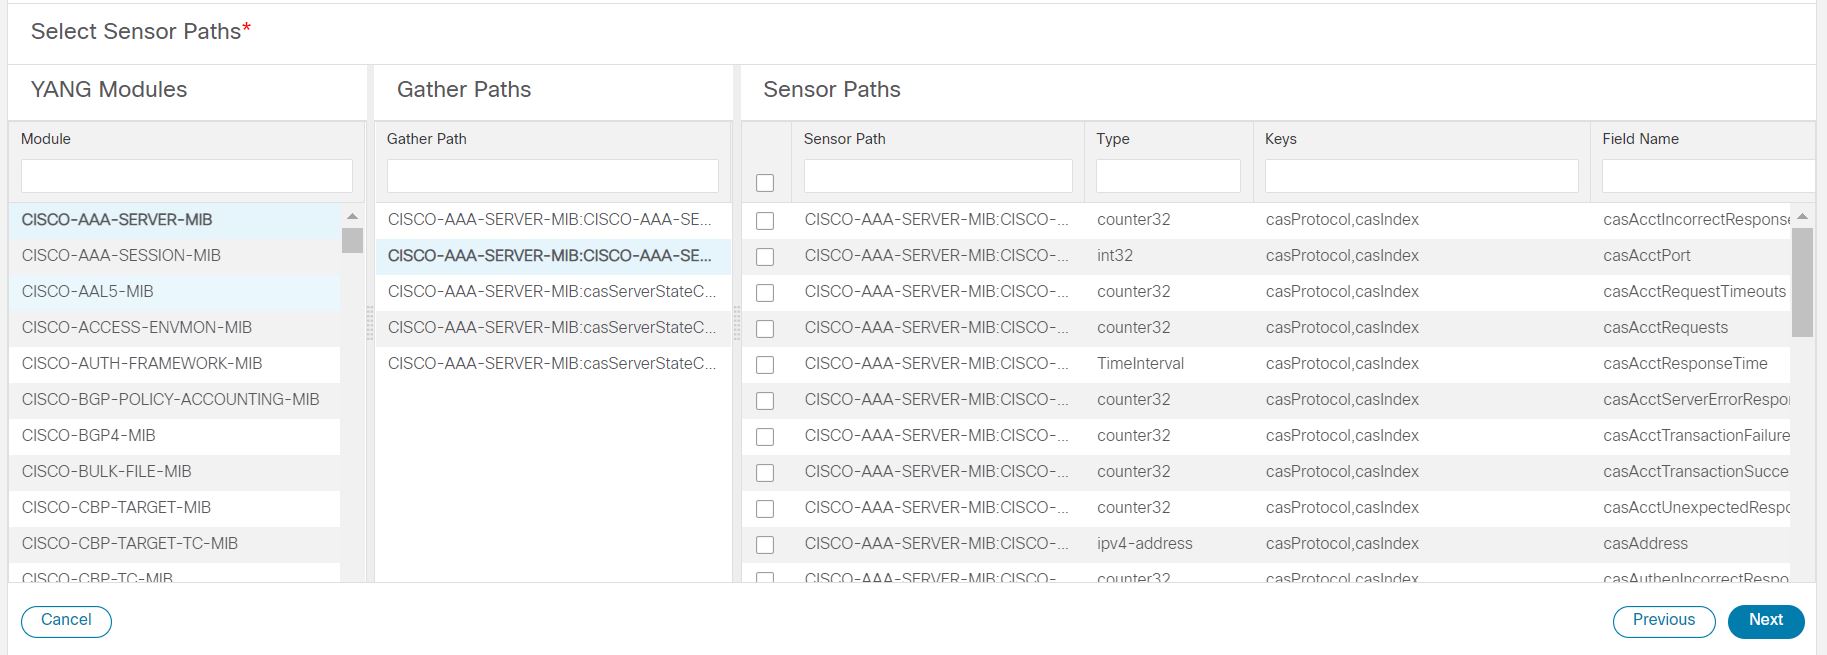
View the Play list
The Play List window of the Change Automation application gives you a consolidated list of all the Plays in the system.
From the main menu, select to view the Play List window.

| Item | Description | |
|---|---|---|
|
1 |
Click |
|
|
Click |
||
|
Click |
||
|
Click |
||
| 2 |
Click |
|
|
3 |
The Type column indicates the type of the Play. You can click the column headings (Name, Description, Type, Labels, and Modified by) to sort the table by that column's data. |
|
|
4 |
Click |
|
|
5 |
Click |
|
|
Click the Clear Filter link to clear any filter criteria you may have set. |
||
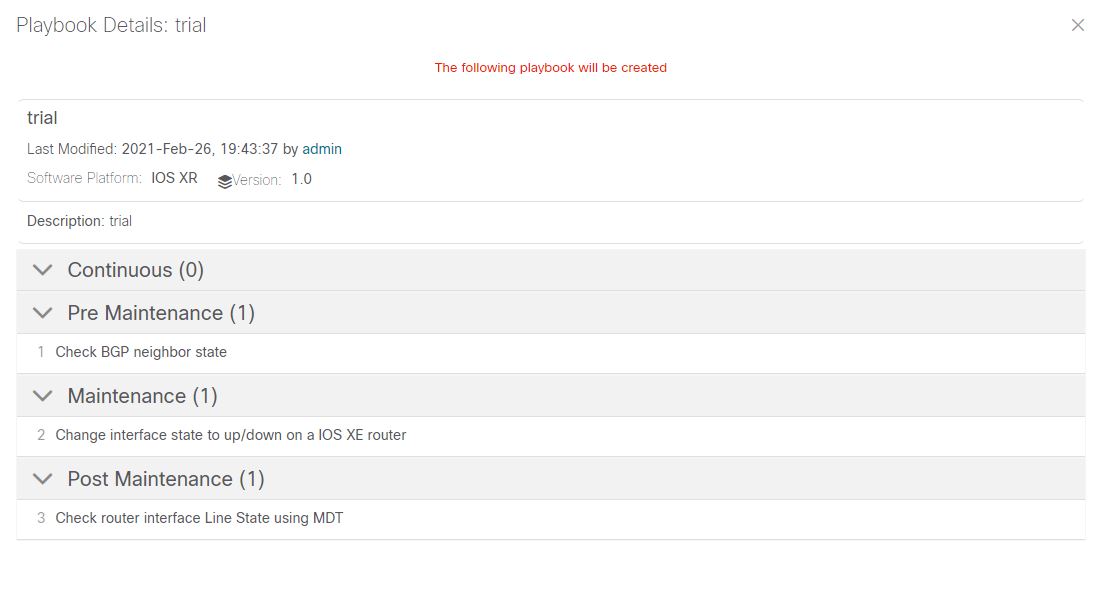
View the Playbook List
The Change Automation application's Playbook List window (in the following figure) gives you a consolidated list of all the Playbooks in the system. To view the Playbook List window, select .
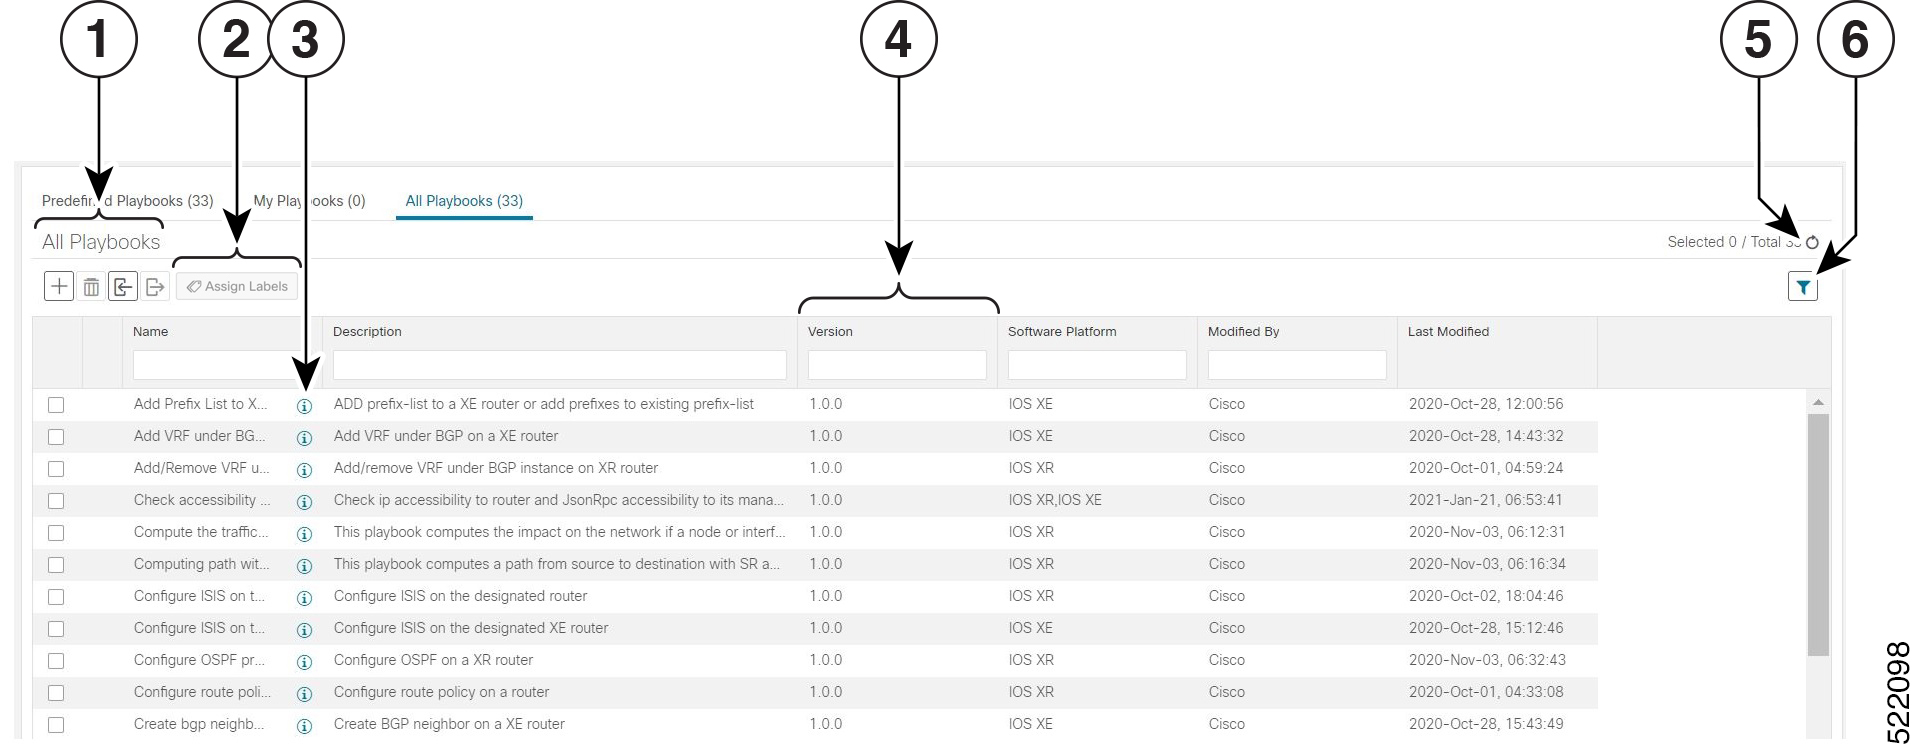
| Item | Description | |
|---|---|---|
|
1 |
Click |
|
|
Click |
||
|
Click |
||
|
Click |
||
| 2 |
Click Assign Labels to assign lable(s) to the Playbook. Assigning label(s) to the Playbooks gives the system administrator the ability to control which Playbooks each user role is allowed to run. |
|
|
3 |
Click |
|
|
3 |
click the Name, Description, Version, Software Platform, and Last Modified column headings in the table to sort the table by that column's data. You can also choose which columns are shown, and set quick or advanced filters on any column. |
|
|
4 |
Click |
|
|
5 |
Click |
|
|
Click the Clear Filter link to clear any filter criteria you may have set. |
||


 . Click the
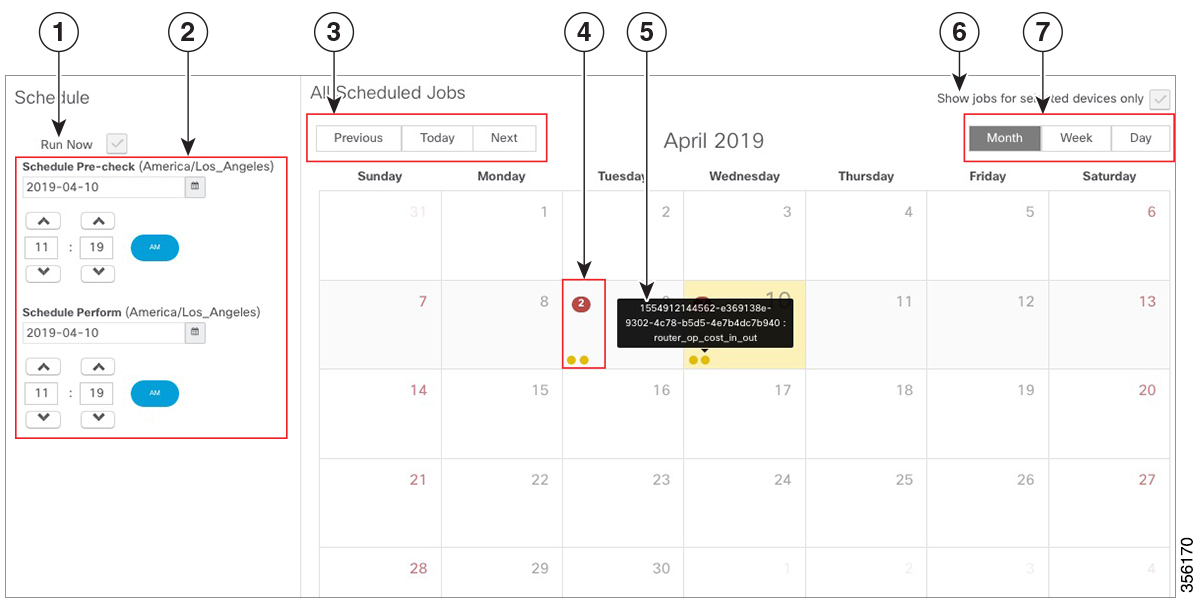
 Feedback