Cisco Cloud Native Broadband Router Diagnosis

The Cisco cnBR provides a suite of in-built tools to diagnose and resolve common issues.

Cable Modem Diagnosis Tool

In a Data-over-Cable Systems Interface Standard (DOCSIS) environment, various elements can affect a modem's ability to maintain a connection and remain online. When a cable modem goes offline, it is difficult to diagnose the cause and identify the issues.

The Cisco cnBR includes a Cable Modem Diagnosis Tool to enable easy diagnosis of such issues. Checkpoints are created periodically for online modems, where information such as system logs, configuration details, and system statistics are saved. When a cable modem goes offline, this system information is analyzed from the saved checkpoints.

The Cable Modem Diagnosis Tool supports the following modes:

  • On-demand mode: System logs related to a modem is collected with a single click, when needed.

  • Background mode: Logs, health metrics and performance metrics are actively analyzed in the background to detect, diagnose, and report modem issues.

The Cable Modem Diagnosis Tool provides the following utilities:

  • Detect malfunctioning modems.

  • Enable debugging for malfunctioning modems and disable debugging when modems are recovered.

  • Supports interactive enabling or disabling of per modem debugging.

  • Display modem logs and telemetry on the Grafana dashboard.

  • Download of modem logs containing modem log messages.

Configure Cable Modem Diagnosis Tool for On-Demand Diagnosis

On-Demand diagnosis allows debugging a cable modem from the Cisco Operations Hub dashboard. On-Demand diagnosis does not require any configuration changes.

Complete the following steps to enable On-Demand Diagnosis:

Procedure


Step 1

Enter the Cisco Operations Hub URL https://{Hostname} in the web browser.

Step 2

On the Cisco Operations Hub, click the Cisco Operations Hub main menu button.

Step 3

Choose Dashboard to open the Dashboard page.

Step 4

Click Find a Dashboard to open the search pane.

Step 5

Enter Cable Modem Verbose in the Search dashboards by name field and click the Cable Modem Verbose row to open the Cable Modem Verbose dashboard.

Step 6

Select the Cisco cnBR name and modem that you want to debug from the cnBR Name and Cable Modem drop-down lists.

Step 7

Click Cable Modem Log From cnBR pane.

Step 8

Click Debug.

Step 9

Click Disable to disable debugging.


Configure Cable Modem Diagnosis Tool for Background Diagnosis

The Background diagnosis utility runs periodically, and detects malfunctioning modems. The utility runs automatically in the background, and is enabled by default.

Using the Background diagnosis method, debug functions that collect modem logs are enabled. Complete the following steps to view the logs:

Procedure


Step 1

Enter the Cisco Operations Hub URL https://{Hostname} in the web browser.

Step 2

On the Cisco Operations Hub, click the Cisco Operations Hub main menu button.

Step 3

Choose Dashboard to open the Dashboard page.

Step 4

Click Find a Dashboard to open the search pane.

Step 5

Enter diagnosis in the Search dashboards by name field and click the Diagnosis row to open the Diagnosis dashboard.

The debugging information is available in the Diagnosis Job Summary, cnBR Debug CMD Control, and Cable Modem Online Anomaly Detection Job tables.

Step 6

To view detailed information about these tables, expand the tables and click the i icon at the top-left corner.


Cable Modem Troubleshooting

The table lists the features, the Cisco cnBR version in which it was introduced, and also gives a short description of the feature.

Table 1. Feature History

Feature Name

Release Information

Feature Description

Cable modem troubleshooting

Cisco cnBR 20.3

The Cisco Operations Hub allows you to collect troubleshooting information for cable modems on-demand. You can also retrieve troubleshooting information that the Cisco Operations Hub automatically collects when it detects L3 ping failure.

Per-CM debugging through a single location

Cisco cnBR 20.4

The Cisco Operations Hub allows you to get more cable modem debug information from Cisco cnBR.

This section describes how to:

  • Collect troubleshooting information for cable modems on-demand.

  • Retrieve troubleshooting information that the Cisco Operations Hub automatically collects when it detects L3 ping failure.

The cnBR Manager gathers troubleshooting information from the Cisco cnBR on-demand and automatically. L3 ping failure detection triggers automatic gathering of troubleshooting information. The troubleshooting information includes a task ID, the cable modem MAC address, and results. Results include troubleshooting information that the cnBR Manager collects from different cnBR services. Troubleshooting information is saved in the debug_info field of the logs. Currently you can receive troubleshooting information for Ranging, Vector Packet Processor (VPP), Baseline Privacy Interface (BPI), Ping, and Data Plane Vector Packet Processor (DP-VPP).

On-Demand Generation of Troubleshooting Information

To generate on-demand troubleshooting information, complete the following steps:

Procedure


Step 1

Enter the Cisco Operations Hub URL https://{Hostname} in the web browser.

Step 2

On the Cisco Operations Hub, click the Cisco Operations Hub main menu button.

Step 3

Choose Dashboard to open the Dashboard page.

Step 4

Click Find a Dashboard to open the search pane.

Step 5

Enter Cable Modem Verbose in the Search dashboards by name field and click the Cable Modem Verbose row to open the Cable Modem Verbose dashboard.

Step 6

Click Troubleshoot.

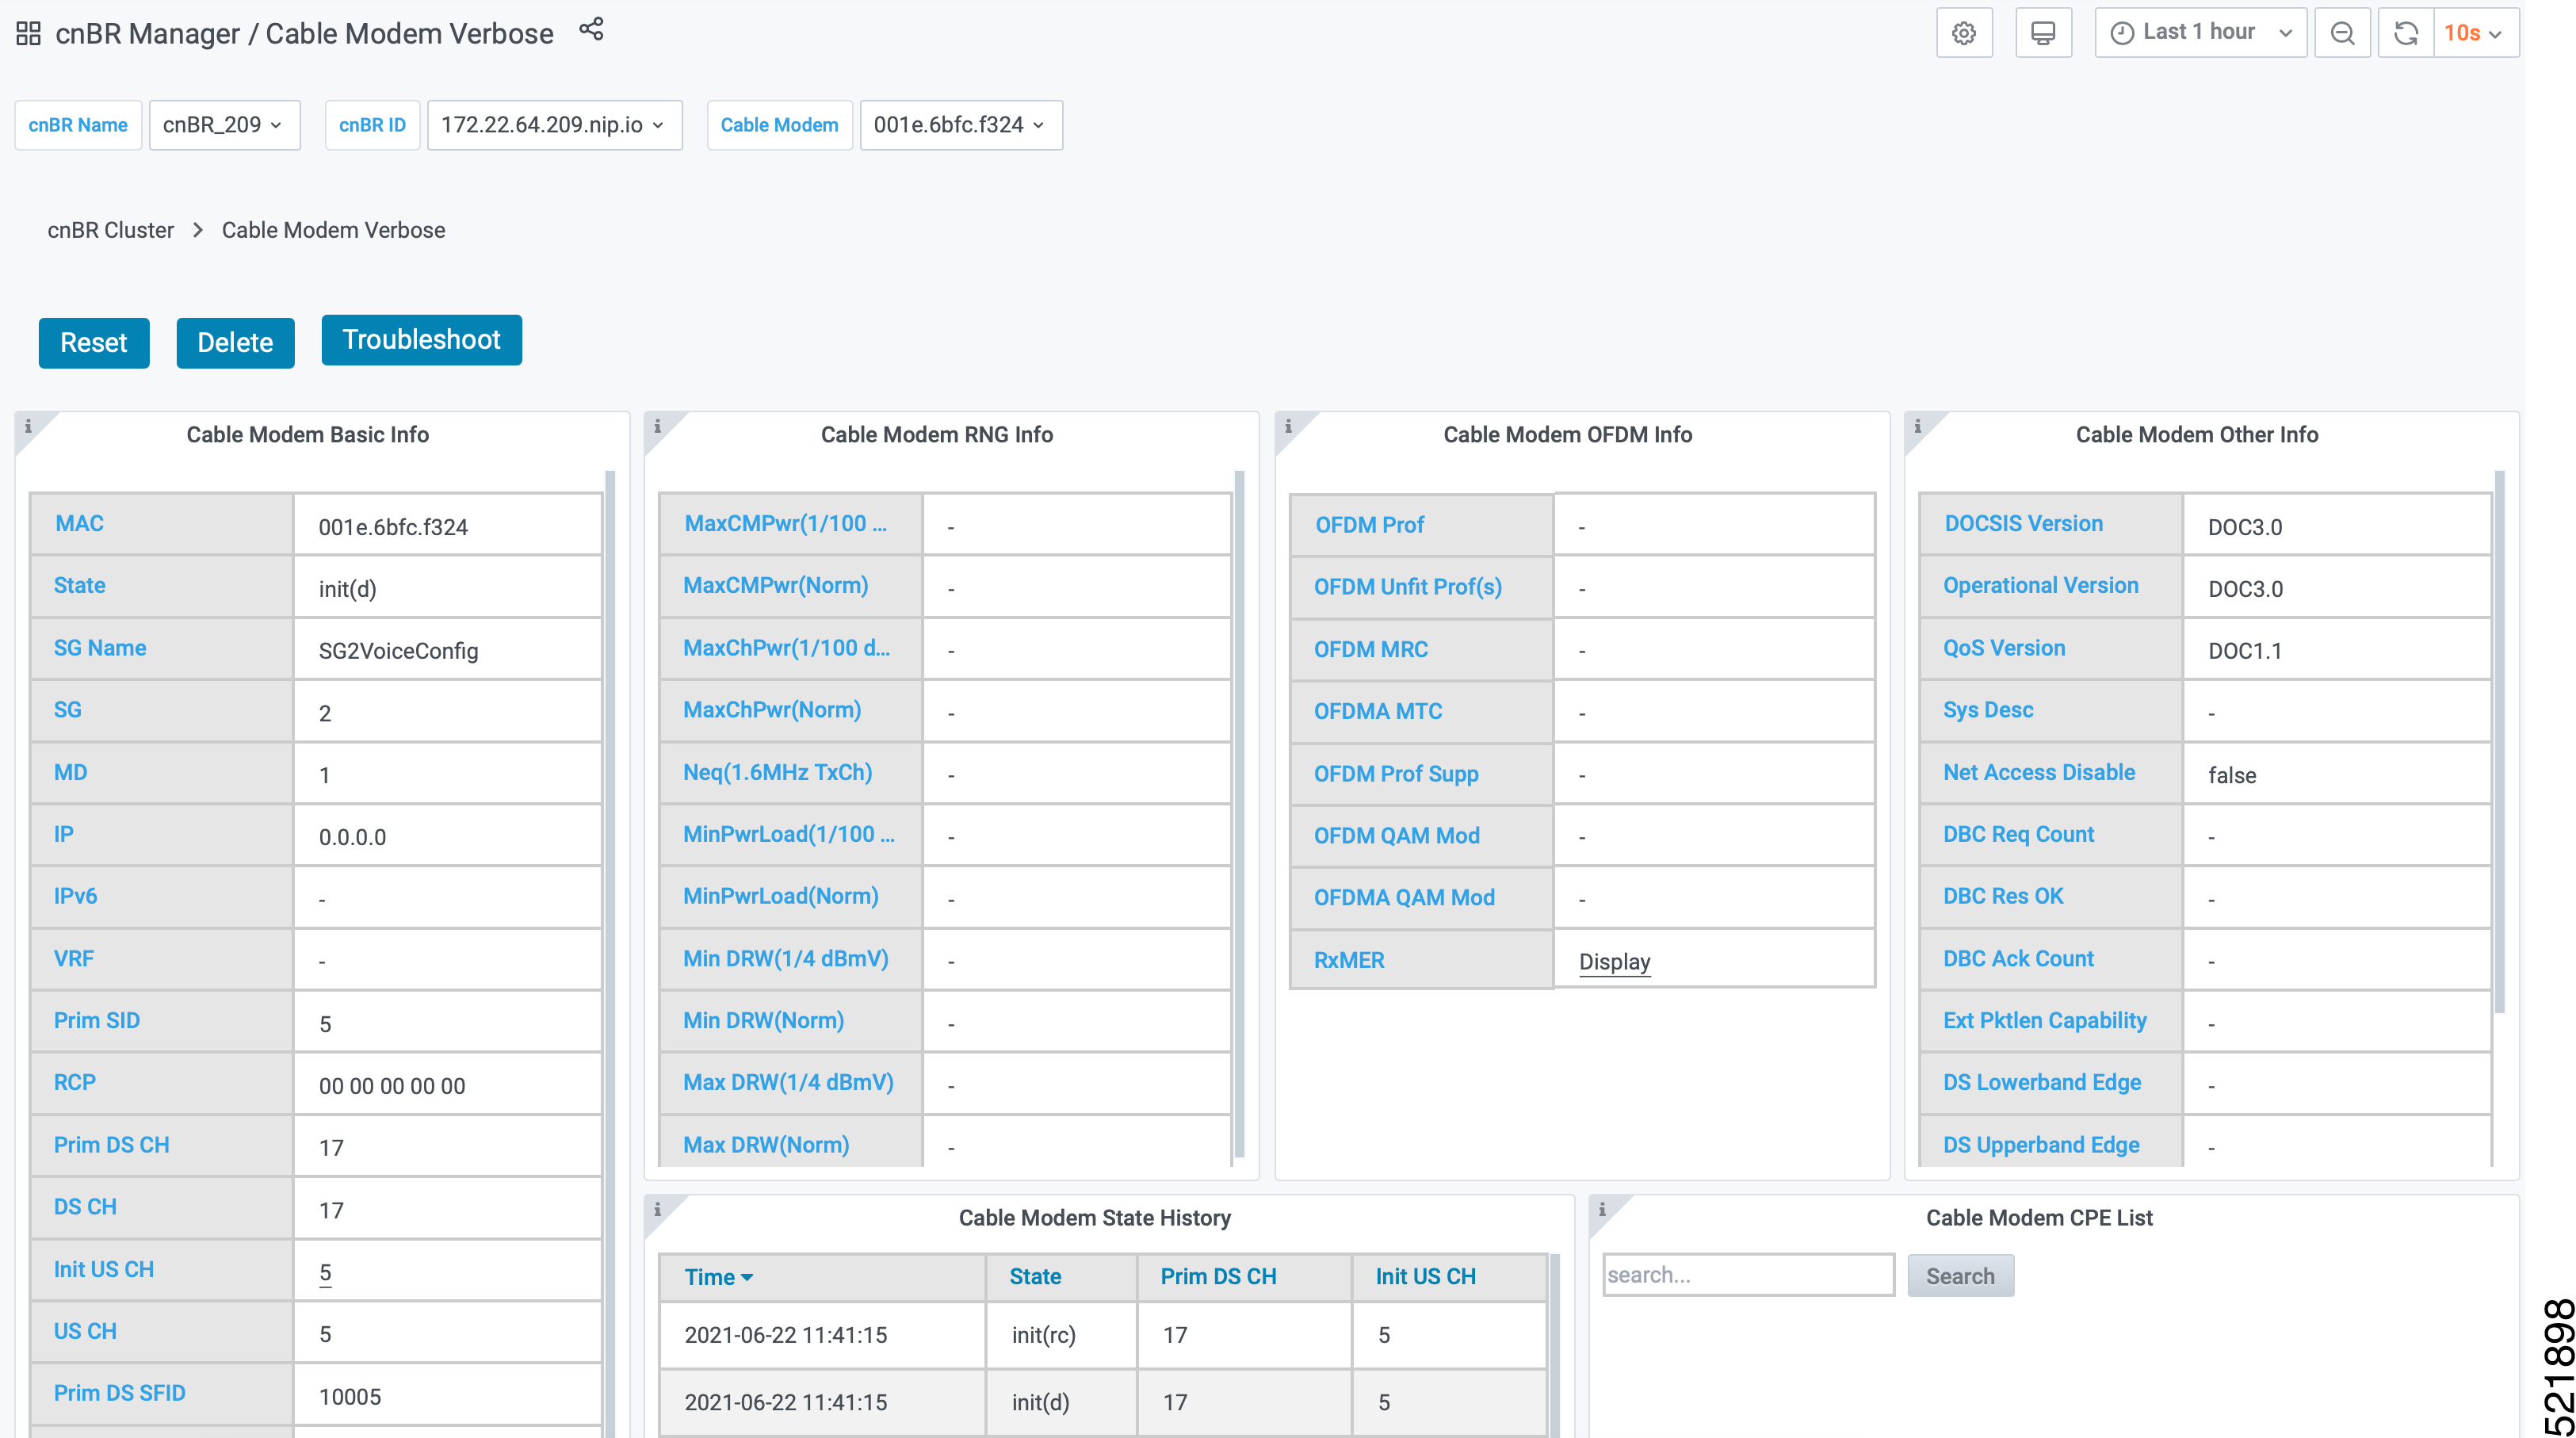
Cable Modem Verbose dashboard

Wait for the Troubleshoot button to turn from In Progress.. to Save.

Step 7

Click Save to save the TroubleshootingLogs-<mac-address>.txt file.

Example:

The following example is a sample output file: troubleshootingLogs-0053.5577.190c.txt

{
        "data": {
            "id": "f5d7fdd6-628b-4da8-917f-2487e3b8a640",
            "cm_mac": "0053.5577.190c",
            "result": {
                "root_cause_analysis": "",
                "details": [
                    {
                        "service_name": "vswitch-vpp",
                        "root_cause": "",
                        "debug_info": {
                            "log": "All interfaces are up"
                        }
                    },
                    {
                        "service_name": "cmts-cp-bpi",
                        "root_cause": "",
                        "debug_info": {
                            "well_known": "{\"MacAddrStr\":\"0053.5577.190c\",\"SvcGrpID\":0,\"MacDomainID\":0,\"PrimSID\":3,\"BpiCurrKeySeq\":1, \"BpiNextKeySeq\":2,
                                            \"BpiOddKey\":\"ZbFZ/JfHIm4Hr+hZuD+j3Q==\",\"BpiOddIV\":\"efW3mAAKUwBBpjYtVC25Pw==\", \"BpiEvenKey\":\"n6IfiC3JLxeV4LF5vOWA4g==\",
                                            \"BpiEvenIV\":\"SqqQOTaXpHVJi2D62Ci0ZQ==\"}"
                        }
                    },
                    {
                        "service_name": "cmts-rt-ranging",
                        "root_cause": "",
                        "debug_info": {
                            "show_cmd": "{\"Ping Results\":[{\"Id\":\"8f30cf6e-39cd-4a3b-a159-2f8816bd8580\",\"Create Time\":\"2020-12-03 00:04:29.751224356
                             +0000 UTC m=+5253.045291365\",\"SG ID\":0,\"MD ID\":0,\"MAC Addr\":\"0053.5577.190c\",\"US Channel ID\":2,\"Repeat\":5,\"Verbose\":true,
                             \"Done\":true,\"Hit\":5,\"Results\":[{\"Result\":\"!\",\"Time Elapsed\":18,\"Timinge Adjust\":1,\"Power Adjust\":0,\"Frequency Adjust\":583},
                             {\"Result\":\"!\",\"Time Elapsed\":14,\"Timinge Adjust\":1,\"Power Adjust\":50,\"Frequency Adjust\":598},{\"Result\":\"!\",\"Time Elapsed\":12,
                             \"Timinge Adjust\":1,\"Power Adjust\":0,\"Frequency Adjust\":561},{\"Result\":\"!\",\"Time Elapsed\":13,\"Timinge Adjust\":1,
                             \"Power Adjust\":0,\"Frequency Adjust\":585},{\"Result\":\"!\",\"Time Elapsed\":46,\"Timinge Adjust\":1,\"Power Adjust\":0,\"Frequency Adjust\"
                             :571}]},{\"Id\":\"47474871-00fb-42fd-ba31-002c52b4ebc6\",\"Create Time\":\"2020-12-03 00:04:29.751182788 +0000 UTC m=+5253.045249807\",
                             \"SG ID\":0,\"MD ID\":0,\"MAC Addr\":\"0053.5577.190c\",\"US Channel ID\":3,\"Repeat\":5,\"Verbose\":true,\"Done\":true,\"Hit\":5,\"Results\"
                             :[{\"Result\":\"!\",\"Time Elapsed\":18,\"Timinge Adjust\":0,\"Power Adjust\":0,\"Frequency Adjust\":-7},{\"Result\":\"!\",\"Time Elapsed\":13,
                             \"Timinge Adjust\":0,\"Power Adjust\":-50,\"Frequency Adjust\":9},{\"Result\":\"!\",\"Time Elapsed\":12,\"Timinge Adjust\":0,
                             \"Power Adjust\":-50,\"Frequency Adjust\":2},{\"Result\":\"!\",\"Time Elapsed\":13,\"Timinge Adjust\":0,\"Power Adjust\":-50,
                             \"Frequency Adjust\":-12},{\"Result\":\"!\",\"Time Elapsed\":46,\"Timinge Adjust\":0,\"Power Adjust\":0,\"Frequency Adjust\":2}]},{\"Id\":
                             \"ddb18370-d5b7-4063-9041-4b943bbcd0ab\",\"Create Time\":\"2020-12-03 00:04:29.751212482 +0000 UTC m=+5253.045279492\",\"SG ID\":0,\"MD ID\":0,
                             \"MAC Addr\":\"0053.5577.190c\\",\"US Channel ID\":1,\"Repeat\":5,\"Verbose\":true,\"Done\":true,\"Hit\":5,\"Results\":[{\"Result\":\"!\",
                             \"Time Elapsed\":18,\"Timinge Adjust\":0,\"Power Adjust\":0,\"Frequency Adjust\":415},{\"Result\":\"!\",\"Time Elapsed\":13,\"Timinge Adjust\":0,
                             \"Power Adjust\":0,\"Frequency Adjust\":419},{\"Result\":\"!\",\"Time Elapsed\":12,\"Timinge Adjust\":0,\"Power Adjust\":0,\"Frequency Adjust\"
                             :424},{\"Result\":\"!\",\"Time Elapsed\":14,\"Timinge Adjust\":0,\"Power Adjust\":0,\"Frequency Adjust\":368},{\"Result\":\"!\",
                             \"Time Elapsed\":47,\"Timinge Adjust\":0,\"Power Adjust\":0,\"Frequency Adjust\":424}]},{\"Id\":\"b5273f03-5d79-4fe6-b8d3-0b054019357f\",
                             \"Create Time\":\"2020-12-03 00:04:29.751218964 +0000 UTC m=+5253.045285972\",\"SG ID\":0,\"MD ID\":0,\"MAC Addr\":\"0053.5577.190c\",
                             \"US Channel ID\":0,\"Repeat\":5,\"Verbose\":true,\"Done\":true,\"Hit\":5,\"Results\":[{\"Result\":\"!\",\"Time Elapsed\":18,
                             \"Timinge Adjust\":0,\"Power Adjust\":0,\"Frequency Adjust\":251},{\"Result\":\"!\",\"Time Elapsed\":14,\"Timinge Adjust\":0,\"Power Adjust\"
                             :0,\"Frequency Adjust\":270},{\"Result\":\"!\",\"Time Elapsed\":11,\"Timinge Adjust\":0,\"Power Adjust\":0,\"Frequency Adjust\":283},
                             {\"Result\":\"!\",\"Time Elapsed\":13,\"Timinge Adjust\":0,\"Power Adjust\":0,\"Frequency Adjust\":275},{\"Result\":\"!\",\"Time Elapsed\"
                             :47,\"Timinge Adjust\":0,\"Power Adjust\":0,\"Frequency Adjust\":234}]}]}",
                            "well_known": "{\"MacAddrIeee\":\"ACUuLXJ+\",\"SvcGrpID\":0,\"MacDomainID\":0,\"PrimSID\":3,\"MacState\":25,\"MD-DS-SG-ID\":1,
                             \"MD-US-SG-ID\":1,\"RngTxchList\":[{\"UsChID\":3,\"RngQueue\":\"STATION_MTN_Q\",\"RngTxchState\":\"TXCH_ST_STA_MTN\",\"RngPwrLevelReported\"
                             :132,\"RngDynPwrWindow\":72,\"RngTxchSNR\":451850,\"RngTxchDataMER\":16777215},{\"UsChID\":1,\"RngQueue\":\"STATION_MTN_Q\",\"RngTxchState\"
                             :\"TXCH_ST_STA_MTN\",\"RngPwrLevelReported\":132,\"RngDynPwrWindow\":72,\"RngTxchSNR\":420410,\"RngTxchDataMER\":16777215},{\"UsChID\":0,
                             \"RngQueue\":\"STATION_MTN_Q\",\"RngTxchState\":\"TXCH_ST_STA_MTN\",\"RngPwrLevelReported\":130,\"RngDynPwrWindow\":74,\"RngTxchSNR\"
                             :420410,\"RngTxchDataMER\":16777215},{\"UsChID\":2,\"RngQueue\":\"STATION_MTN_Q\",\"RngTxchState\":\"TXCH_ST_STA_MTN\",
                             \"RngPwrLevelReported\":129,\"RngDynPwrWindow\":75,\"RngTxchSNR\":420410,\"RngTxchDataMER\":16777215}]}"
                        }
                    },
                    {
                        "service_name": "cmts-ping",
                        "root_cause": "",
                        "debug_info": {
                            "log": "{\"minRtt\":17,\"maxRtt\":65425,\"avgRtt\":289,\"sent\":240,\"received\":240,\"MAC Addr\":\"0053.5577.190c\",
                                    \"CmMacIeee\":\"ACUuLXJ+\",\"SvcGrp\":0,\"MacDomain\":0}",
                            "well_known": "{\"MacAddrStr\":\"0053.5577.190c\",\"MacAddrIeee\":\"ACUuLXJ+\",\"SvcGrpID\":0,\"MacDomainID\":0}"
                        }
                    },
                    {
                        "service_name": "cmts-dp-macl3vpp-global",
                        "root_cause": "",
                        "debug_info": {
                            "show_cmd": "{\"drop_stats\":{\"name\":\"Global Drop Stats\",\"per_cause_drops\":[{\"id\":11,\"cause\":\"icpi_inject__bad_cause\"},
                            {\"id\":27,\"cause\":\"cbl_fld__no_members\"},{\"id\":56,\"cause\":\"dsmac__invalid_sg\"}]},\"usmac_depi_stats\":{\"data_pw_uepi_pkt_cnt\"
                            :298,\"data_pw_uepi_byte_cnt\":42822,\"rng_pw_uepi_pkt_cnt\":56,\"rng_pw_uepi_byte_cnt\":9408,\"uepi_phy_burst_cnt\":354,\
                            "total_ccf_seg_cnt\":298,\"ccf_seg_no_hcserr_cnt\":298,\"pre30_doc_no_hcserr_cnt\":56,\"sm_rng_good_pkt_cnt\":56}}"
                        }
                    },
                    {
                        "service_name": "cmts-dp-macl3vpp-per-cm",
                        "root_cause": "",
                        "debug_info": {
                            "show_cmd": "{\"dtrack_stats\":{\"dtrack_mac_addr\":\"00:25:2e:2d:72:7e\",\"dtrack_time_start\":1606953869,\"dtrack_time_stop\":1606953990,
                            \"dtrack_epoch_in\":3,\"dtrack_epoch_curr\":3,\"dtrack_us_input\":248,\"dtrack_us_xmit\":248,\"dtrack_ds_input\":248,\"dtrack_ds_xmit\":248},
                            \"srv_flow_stats\":[{\"id\":3,\"direction\":\"US\",\"pkts_cnt\":248,\"bytes_cnt\":15792,\"duration_seconds\":120,\"throughput_pps\":1050},
                            {\"id\":10003,\"direction\":\"DS\",\"pkts_cnt\":248,\"bytes_cnt\":15280,\"duration_seconds\":120,\"throughput_pps\":1016}]}"
                        }
                    }
                ]
            }
        },
        "status": 200,
        "config": {
            "method": "GET",
            "transformRequest": [
                null
            ],
            "transformResponse": [
                null
            ],
            "jsonpCallbackParam": "callback",
            "url": "https://opshub1.cisco.com/api/manager/v1/cable-modems/0053.5577.190c/debug",
            "headers": {
                "Accept": "application/json, text/plain, */*"
            }
        },
        "statusText": "OK",
        "xhrStatus": "complete"
    }

Automatic Generation of Troubleshooting Information

When the cnBR Manager detects a cable modem ping failure, the cnBR Manager generates a request to get troubleshooting information from the Cisco cnBR. cnBR Manager stores the troubleshooting information responses that it receives from the Cisco cnBR.

Procedure


Step 1

Enter the Cisco Operations Hub URL https://{Hostname} in the web browser.

Step 2

On the Cisco Operations Hub, click the Cisco Operations Hub main menu button.

Step 3

Choose Dashboard to open the Dashboard page.

Step 4

Click Find a Dashboard to open the search pane.

Step 5

Enter Cable Modem Verbose in the Search dashboards by name field and click the Cable Modem Verbose row to open the Cable Modem Verbose dashboard.

Step 6

In the Cable Modem drop-down list, select the target cable modem MAC address.

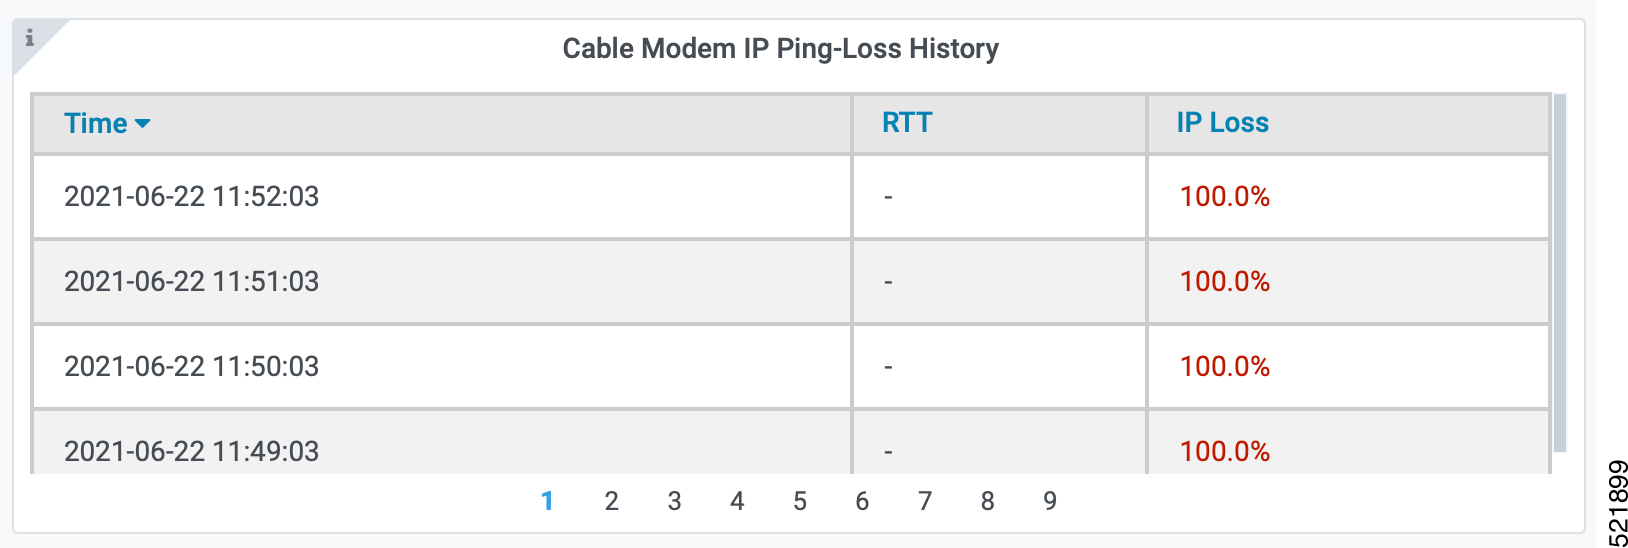
This page lists the occurrences of L3 ping loss with timestamp.

Cable Modem IP Ping-Loss History panel
Note 

You can view the top ten modems with IPv4 ping-loss from the Top 10 IPv4 Ping-Loss Modems panel in the Service Group dashboard.

Step 7

Open the following link in a browser, or use the curl command to send a GET request.

https://<hostname>/opshub-data/api/idocsis/v1/idm/cm-debug/tasks

Find the target cable modem using the MAC address to get the troubleshooting information.

Example:

https://opshub1.cisco.com/opshub-data/api/idocsis/v1/idm/cm-debug/tasks

Or

hostname#curl -k -L -X GET 'https://opshub1.cisco.com/opshub-data/api/idocsis/v1/idm/cm-debug/tasks'

See example in Step 3 for a sample response.

Step 8

Find the target cable modem MAC address, and ping failure timestamp from the information to get troubleshooting information for the ping failure.

Example:

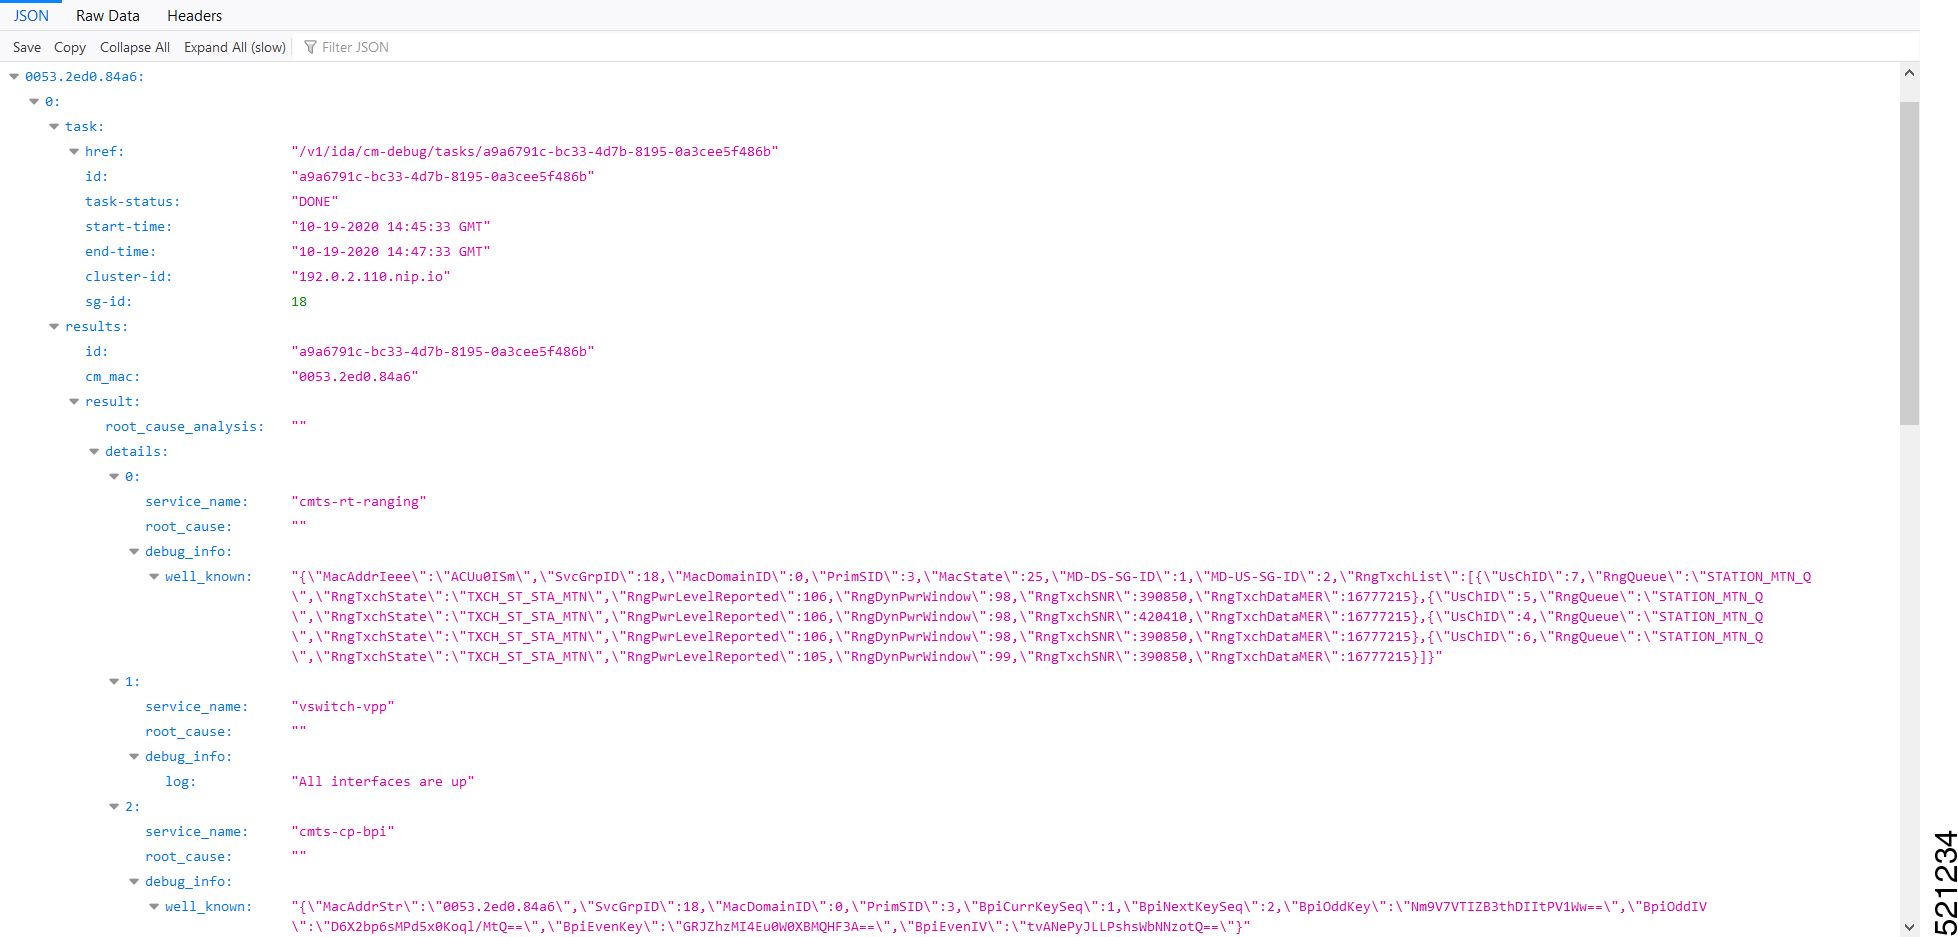
In the following example, we can see the debug result for the cable modem 0053.2ed0.84a6.

Figure 1. JSON Data from a Cisco cnBR Response
JSON data from Cisco cnBR response
Note 

If time zone settings are different, the time that is displayed in the cnBR Manager interface and the time in the Cisco cnBR response are different. The time stamp in the Cisco cnBR response is always in Greenwich Mean Time (GMT).


Cisco cnBR Dashboards

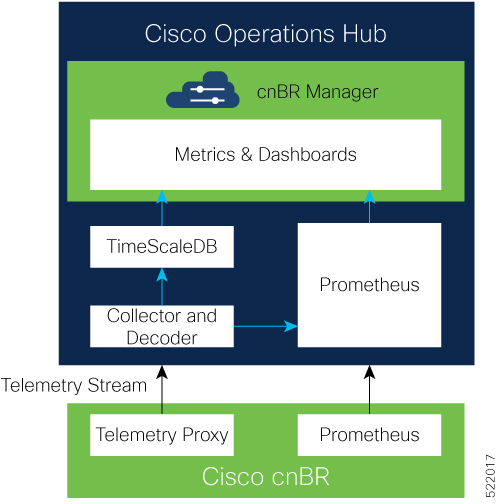
The Dashboards menu in the Cisco Operations Hub allows you to monitor the status of the Cisco cnBR router. Cisco Operations Hub receives metrics and telemetry data from Cisco cnBR. Based on the type of data, the data is saved in the Postgres or Prometheus databases. The dashboards later retrieve and display the data.

The following illustration shows the Dashboards framework.

Cisco Operations HubDashboards framework

Cisco cnBR Dashboards

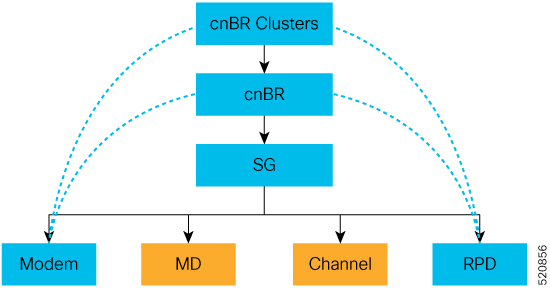
The Grafana dashboard displays metrics and status of the DOCSIS network, DOCSIS devices, and CMTS performance status. The dashboard is based on a hierarchical structure, which matches the Cisco cnBR system deployment exactly.

The following illustration shows the hierarchical layout:

Cisco cnBR deployment architecture

The Dashboard user interface (UI) has the following components:

Breadcrumbs Bar

The breadcrumbs bar is available on each dashboard. It shows the dashboard pages just visited. You click each link in the breadcrumbs and go to that specific dashboard.

Shows breadcrumbs bar

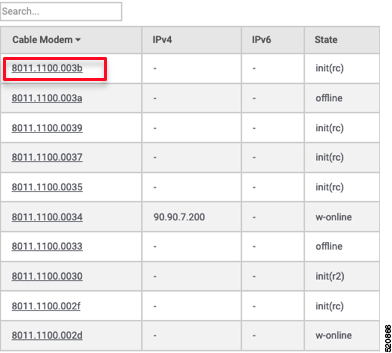
Links

Links are marked using an underline. You click the underlined text and open the related page.

Shows links in the dashboard

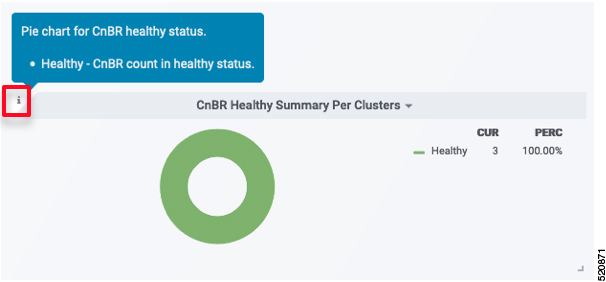
Tooltips

Tooltips are available on the dashboard to display information for each panel on the Grafana dashboard. To view a tooltip, hover your mouse over the i on the top-left corner of the panel.

Shows tooltips in the dashboard

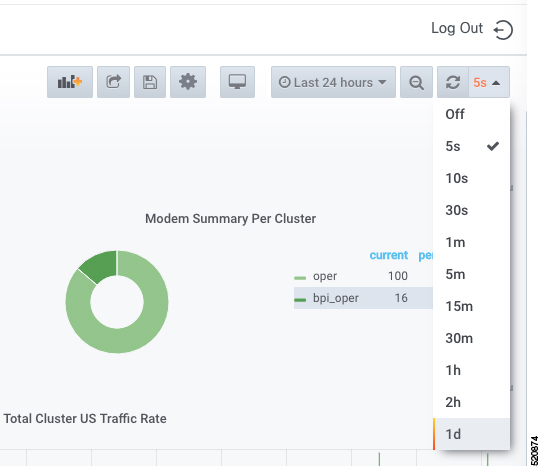
Dashboard Refresh and Time Range

To set the refresh time for each dashboard, choose the time from the drop-down list on the top-right corner of the dashboard. The default refresh-time for the dashboard is 10 seconds.

Shows the option to choose the dashboard refresh-time

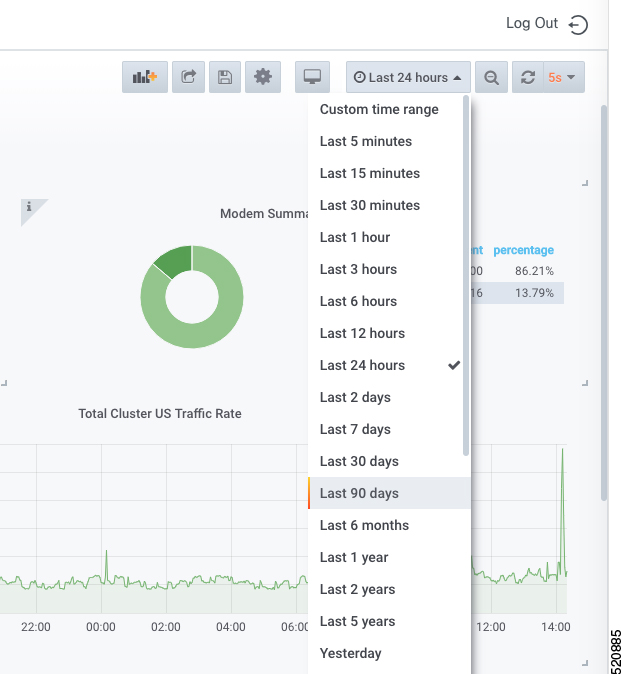
If data is retrieved from the Prometheus database, choose the required value from the Custom time range drop-down list as shown in the following image.

Custom time range drop-down list

Data Display on Dashboard

The table lists the features, the Cisco cnBR version in which it was introduced, and also gives a short description of the feature.

Table 2. Feature History

Feature Name

Release Information

Feature Description

Downstream and upstream channel utilization live graphs

Cisco cnBR 21.2

Downstream and upstream channel utilization live graphs are added in the traffic throughput section of the service group dashboard. You can view the utilization of the downstream and upstream channels under the service group in these live graphs.

Modem type column

Cisco cnBR 21.2

A modem type column is added in the Cable Modem List table of the Cable Modem List dashboard. It shows the DOCSIS version of the cable modem.

The Dashboard panel provides a list of commonly used dashboards. The dashboard includes the cnBR Manager Overview, cnBR Summary, RPD List Summary, Service Group Summary, Service Groups List, Cable Modem Table List, and other recently used dashboards.

To access the Dashboard, click Cisco Operations Hub > Dashbboard.

You can alternatively search for dashboards by clicking Find a Dashboard.

For all dashboards available in the Cisco cnBR Manager application, data is represented using pie charts, tables, and live graphs.

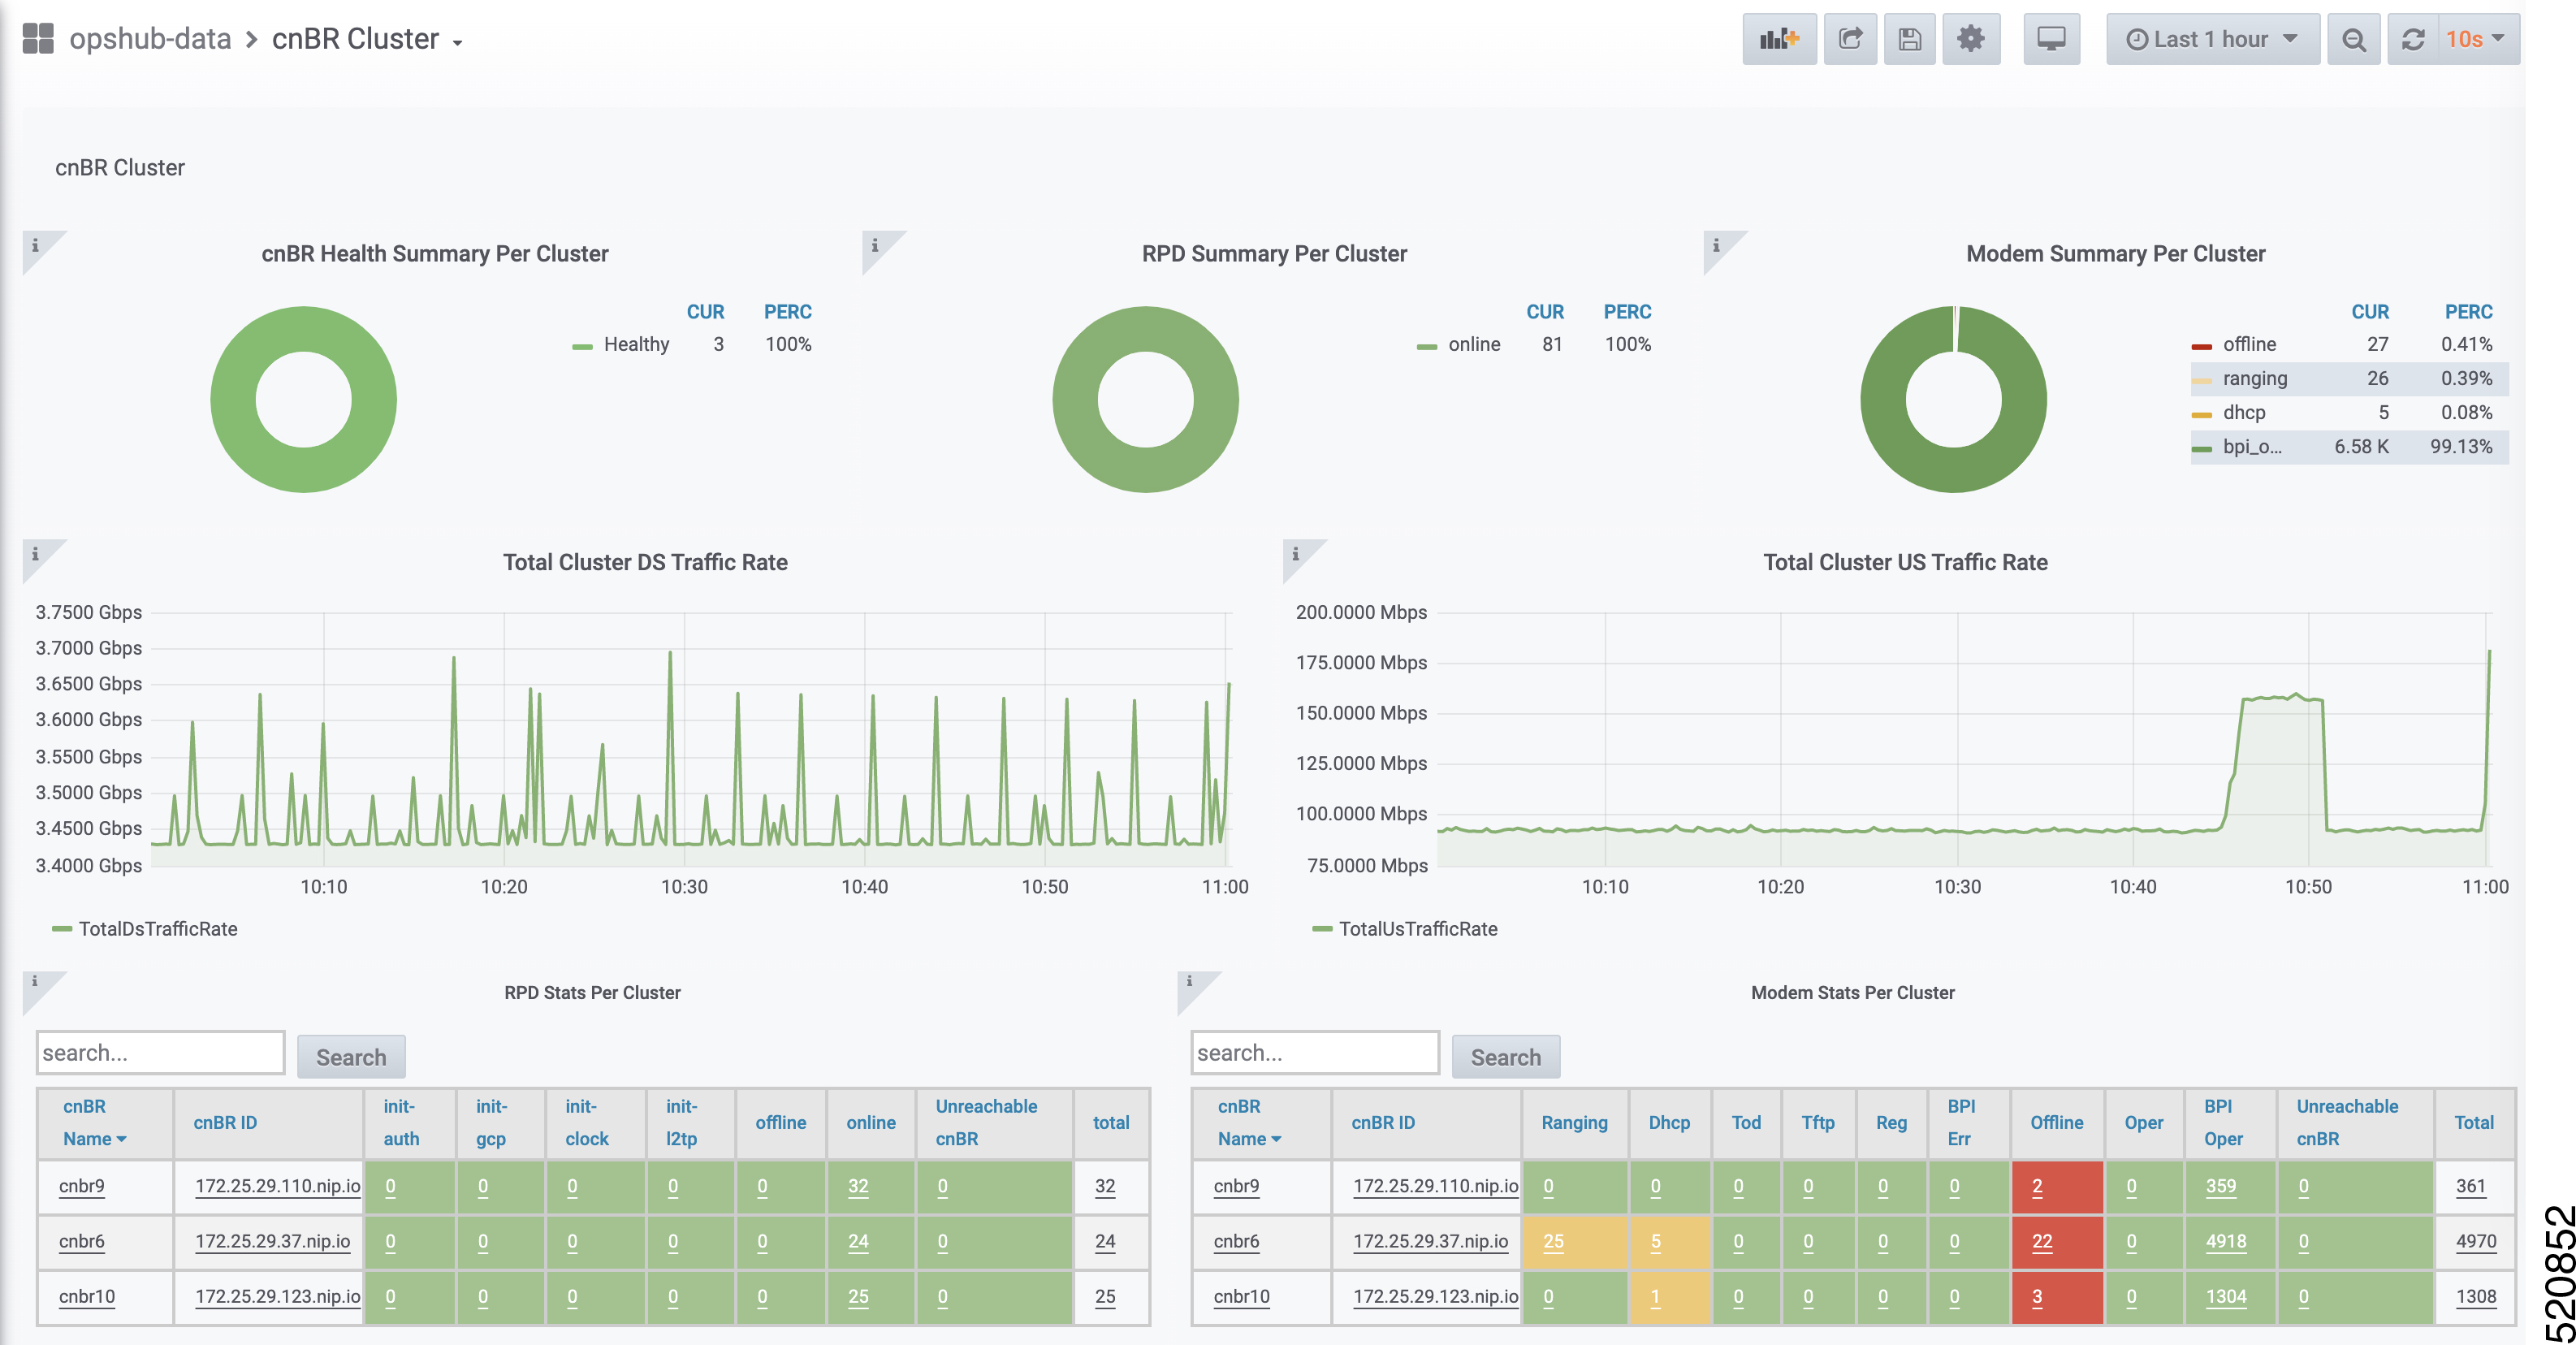
cnBR Cluster

This Dashboard displays the following information:

Describes each panel in the cnBR Cluster dashboard

Panel Name

Description

cnBR health status

The pie chart shows Cisco cnBR performance status for each Cisco cnBR cluster.

Remote-PHY device (RPD) status

The pie chart shows the status of RPDs in each Cisco cnBR cluster.

Cable Modem status

The pie chart shows the status of cable modems in the Cisco cnBR cluster.

Summary of downstream traffic rate for all cnBR clusters

The graph shows how much download happened in the set time.

Summary of upstream traffic rate for all cnBR clusters

The graph shows how much upstream traffic happened in the set time.

Summary of RPDs in different states per cnBR cluster

The table shows how many RPDs are offline or online, and the following details:

  • cnBR Name: Name of the cluster

  • cnBR ID: The IP address to reach the Cisco cnBR router.

  • init-auth: Authorization status of the RPD

  • init-gcp: GCP provision status

  • init-clock: Clock synchronization status

  • init-l2tp: L2VPN provisioning status

  • total: Total number of RPDs in the cluster

Summary of modems in different states per cnBR cluster

The table shows a summary of the status of cable modems in the cluster, including the following details:

  • Ranging: Number of ranging requests received.

  • DHCP: Number of DHCP requests received.

  • ToD: Time-of-Day (ToD) requests received.

  • TFTP: Number of TFTP requests received.

  • Reg: Number of registration requests (REG-REQ) or multipart registration request (REG-REQ-MP) received.

  • BPI Err: Number of Baseline Privacy Interface (BPI) errors even if the cable modem is registered.

  • Offline: Number of modems which are offline.

  • Oper: Number of cable modems which are registered without enabling BPI.

  • BPI Oper: Number of cable modems with BPI.

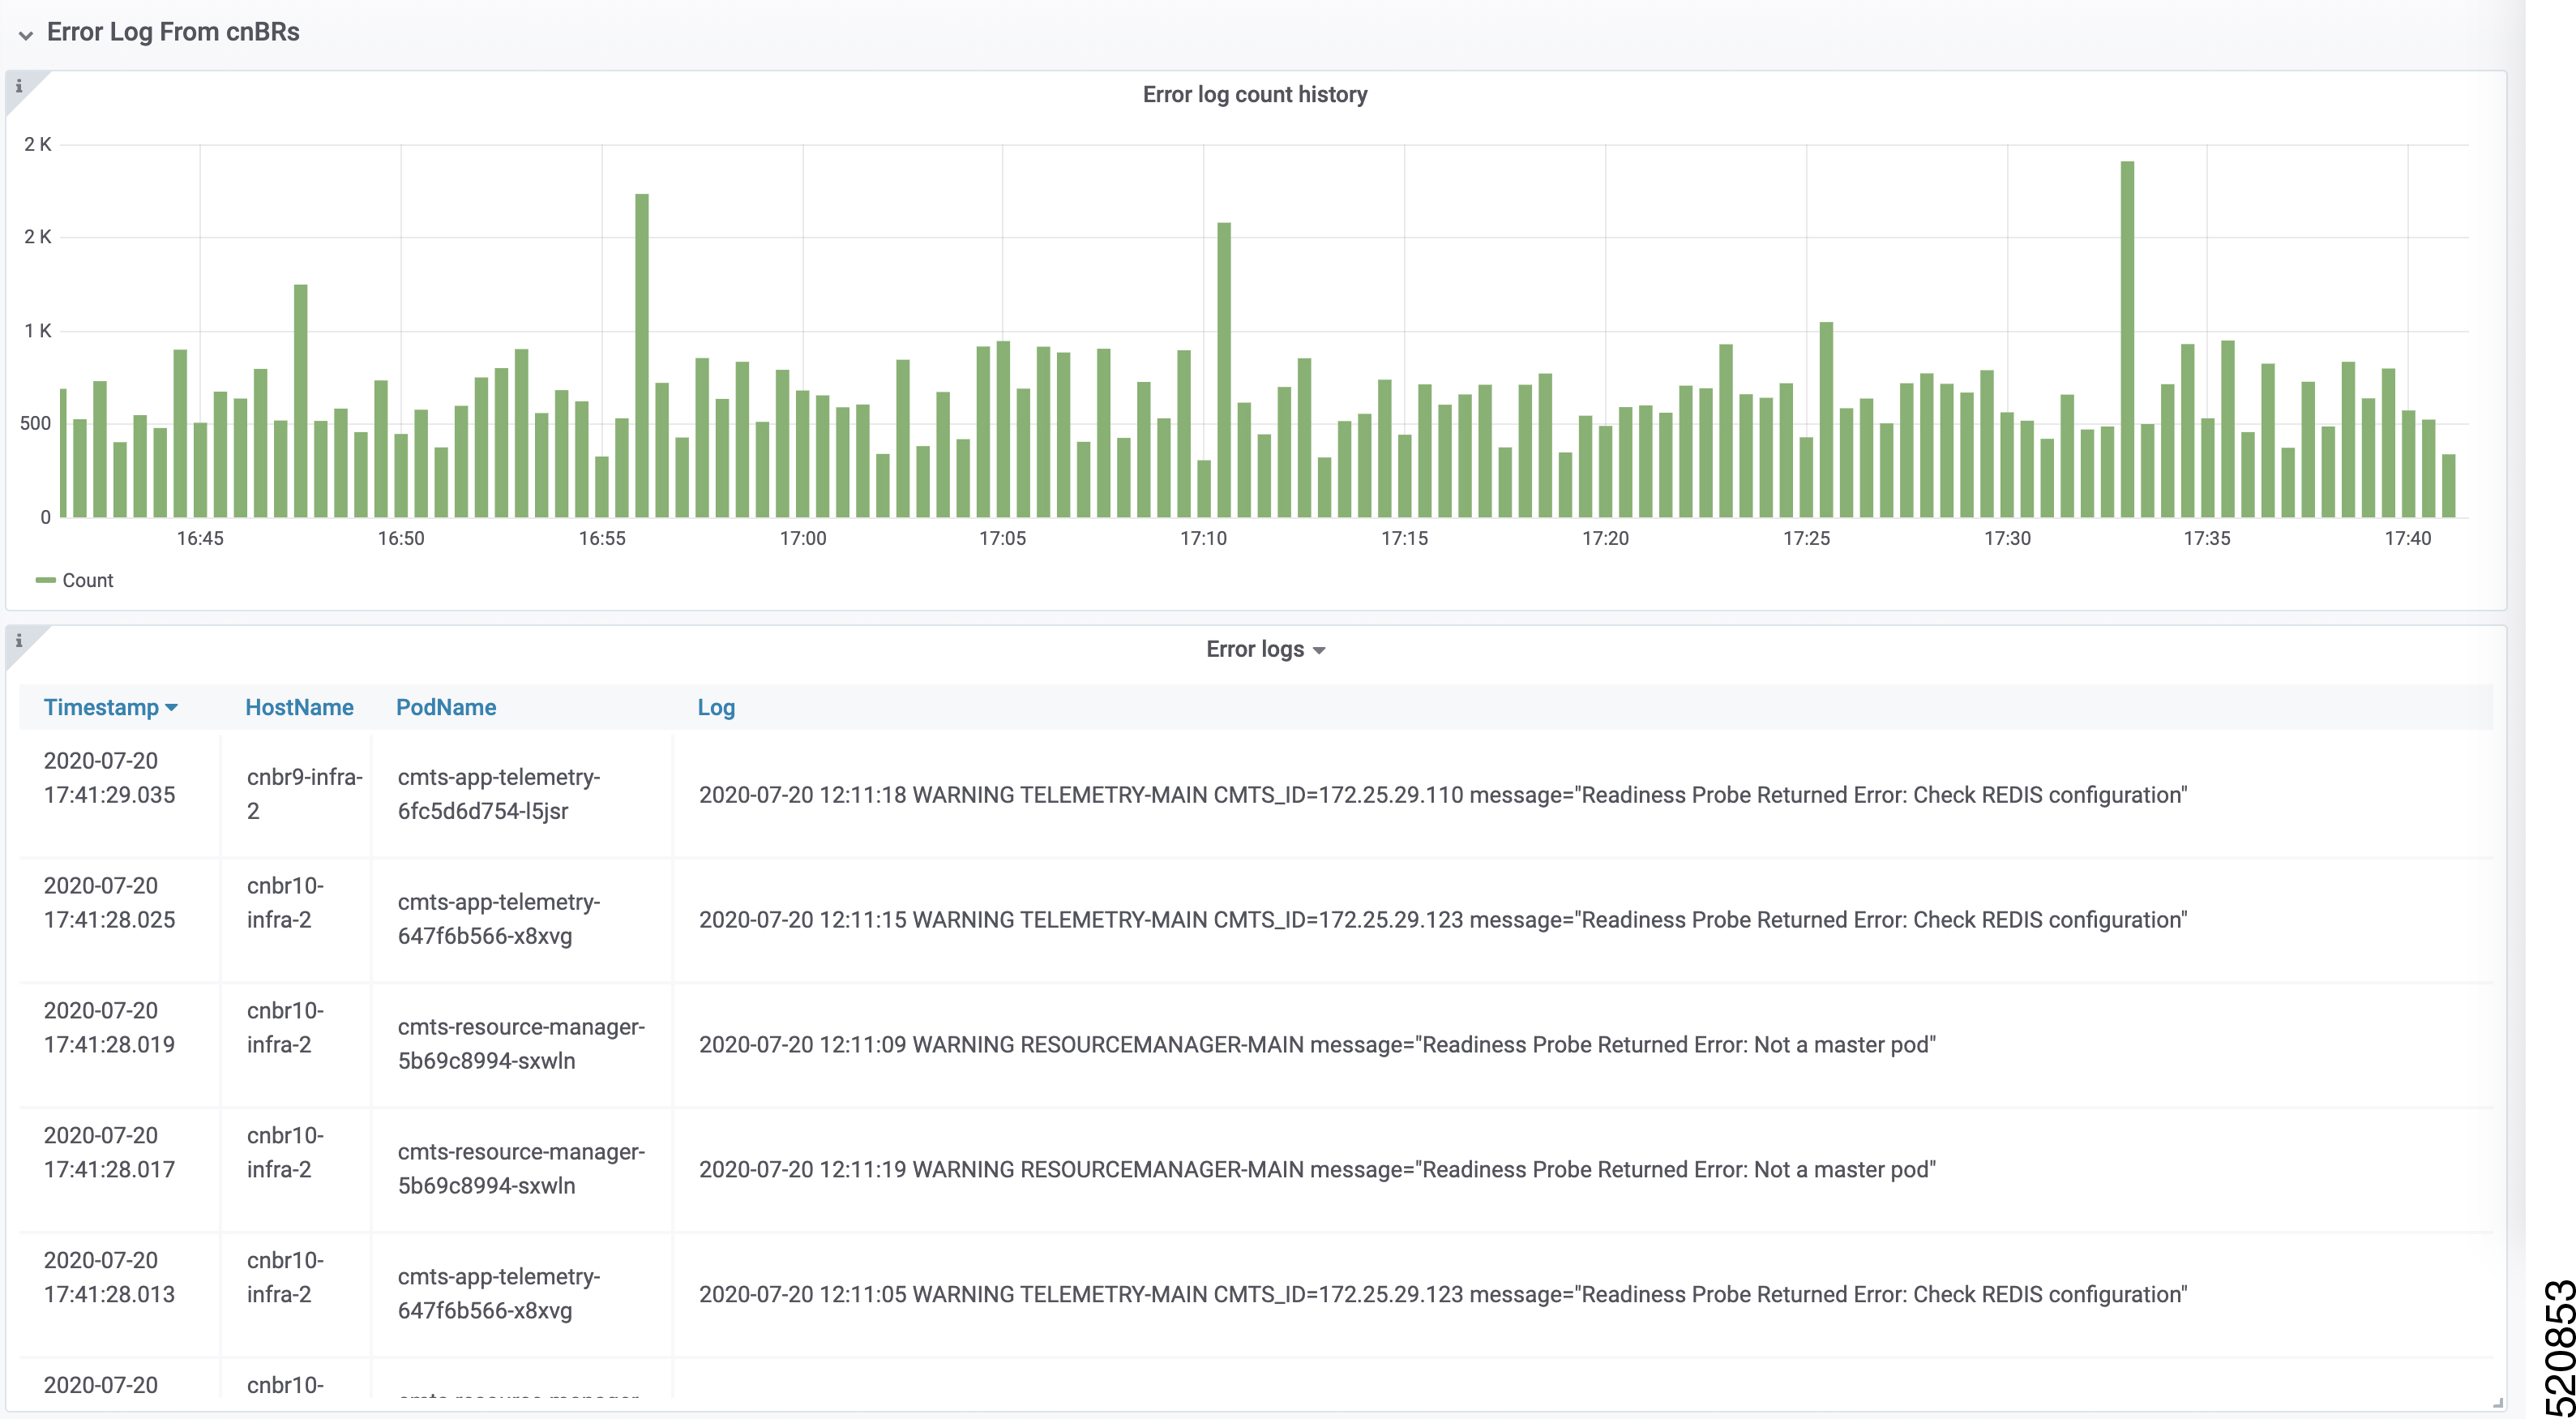
Error log count history for all cnBR clusters

The live graph shows the history of the number of error logs generated for all Cisco cnBR clusters.

Error logs from all cnBR clusters

The live graph shows the error logs generated for all Cisco cnBR clusters.

cnBR Cluster dashboard Error Log panes in the cnBR Cluster dashboard

cnBR Summary

The Dashboard displays the following information:

Describes each panel in the cnBR Summary dashboard

Panel Name

Description

RPD state summary per cnBR

The pie chart shows a summary of RPDs in different states under the current Cisco cnBR cluster:

  • online: Online state

  • init(l2tp): Layer Two Tunneling Protocol (L2TP) provision

  • init(clksync): Clock sync

  • init(gcp): GCP provision

  • init(auth): Authorization

  • offline: Offline state

Modem state summary per cnBR

The pie chart shows a summary of modems in different states under the current Cisco cnBR cluster:

  • oper: Modem that is registered without BPI enabled

  • bpi_oper: Modem that is registered with BPI enabled

  • bpi_error: Modem that is registered but BPI error

  • reg: REG-REQ or REG-REQ-MP was received

  • tod: TOD request received

  • tftp: Trivial File Transfer Protocol (TFTP) request received

  • dhcp: DHCP request received

  • ranging: Ranging request received

  • offline: Offline state

RPD state count per SG

The table provides a summary of RPDs in different states per service group:

  • SG_ID: Service group id

  • auth: init(auth) state, authorization

  • gcp: init(gcp) state, GCP provision

  • clock: init(clksync) state, clock sync

  • l2tp: init (L2TP) state, L2TP provision

  • offline: offline state

  • online: online state

Modem state count per SG

Summary of modems in different states per service group:

  • SG_ID: Service group ID

  • ranging: Ranging request received

  • tod: TOD request received

  • dhcp: DHCP request received

  • tftp: TFTP request received

  • reg: REG-REQ or REG-REQ-MP was received

  • bpi_err: Modem that is registered but BPI error

  • offline: Offline state

  • oper: Modem that is registered without BPI enabled

  • bpi_oper: Modem that is registered with BPI enabled

Traffic statistics for all service Groups

Shows traffic statistics for the following:

  • DS Service Group Traffic Rate

  • US Service Group Traffic Rate

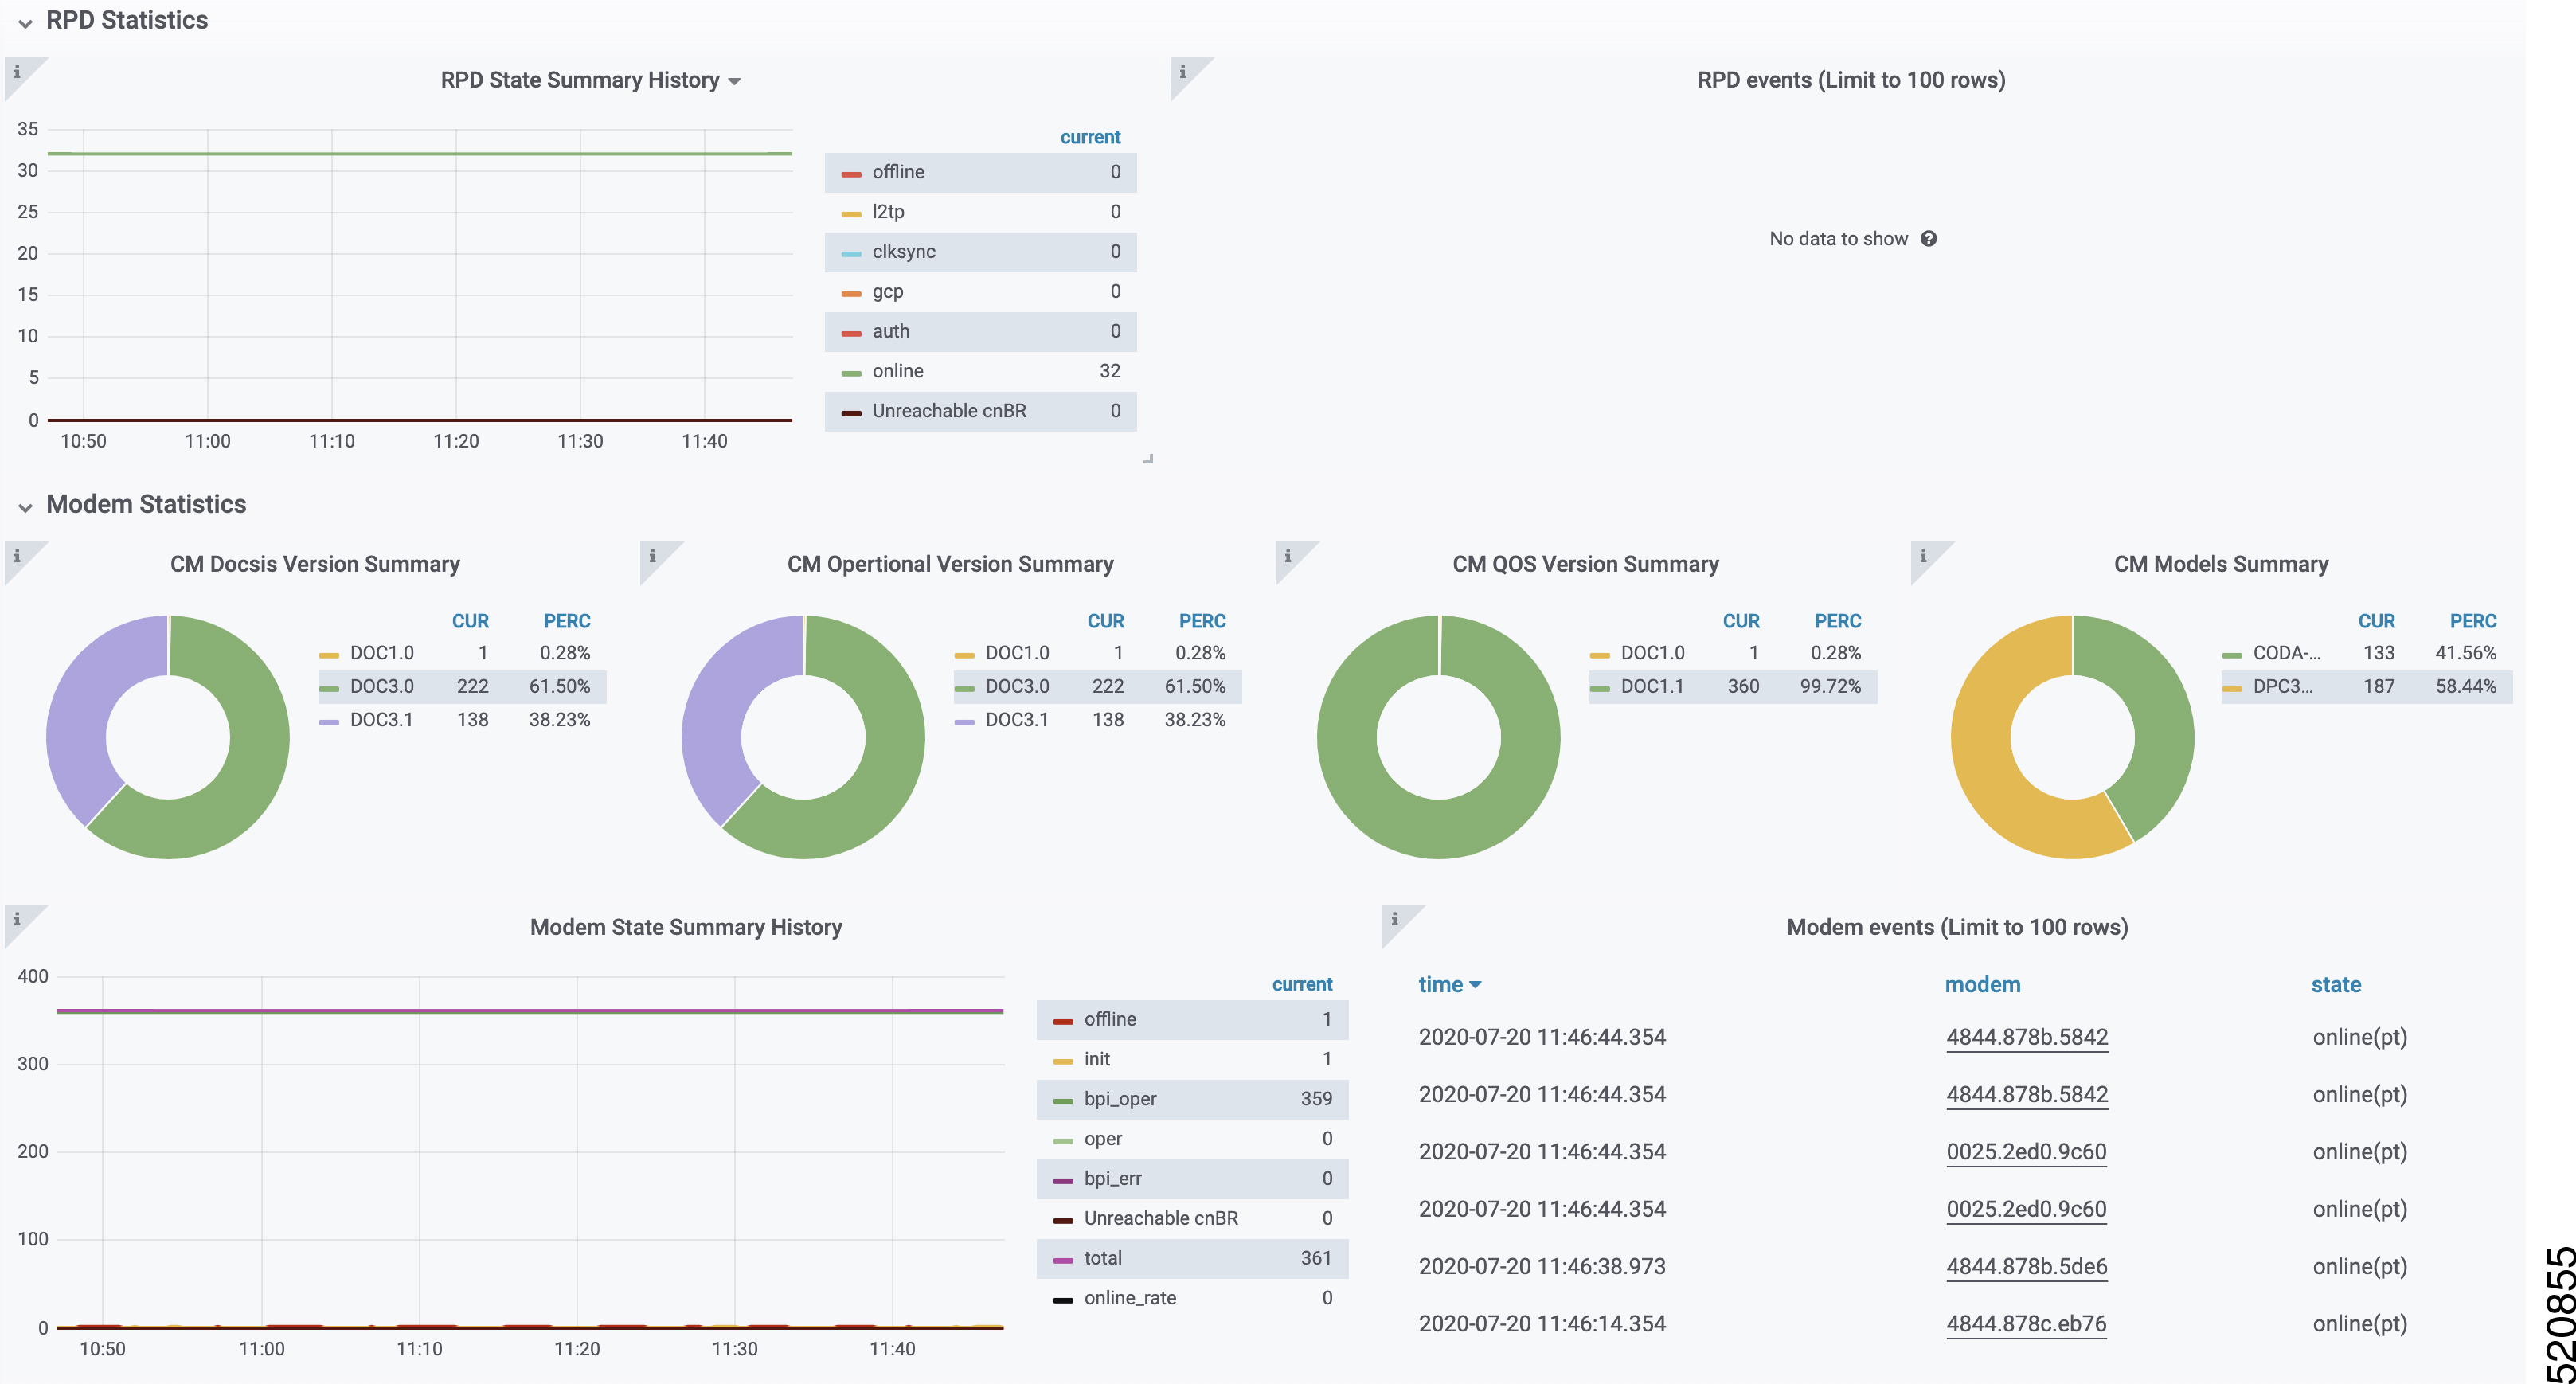
RPD statistics

History summary of RPDs in different stats

RPD events

Latest 100 RPD state change events

Modem statistics

  • CM DOCSIS version summary

  • CM Operational version summary

  • CM QoS version summary

  • CM models summary

Modem state summary history

Summary history of modems in different states

Modem events

Latest 100 modem state change events

Modem list

A detailed modem state information list. Use the Search text box to filter modems by the MAC address, IPv4 address, or IPv6 address. The number of rows in the Modem List table is limited to 256. The total is the total number of modems that are filtered by clusterIp and the search text.

  • Cable Modem: MAC address of the cable modem

  • IPv4: IPv4 address of the cable modem

  • IPv6: IPv6 address of the cable modem

  • State: State of the cable modem

  • SG: Service group ID of the cable modem

  • MD: MAC domain ID of the cable modem

  • Online Time: Last time when the cable modem transitioned to online

  • Offline Time: Last time when the cable modem transitioned to offline

  • Last Update: Last time when the entry was updated.


Note

Use the Actions drop-down option in this dashlet to reset or delete all offline cable modems for the selected Cisco cnBR cluster.


cnBR Summary dashboard

Service Group

The Dashboard displays the following information:

Describes each panel in the Service Group dashboard

Panel Name

Description

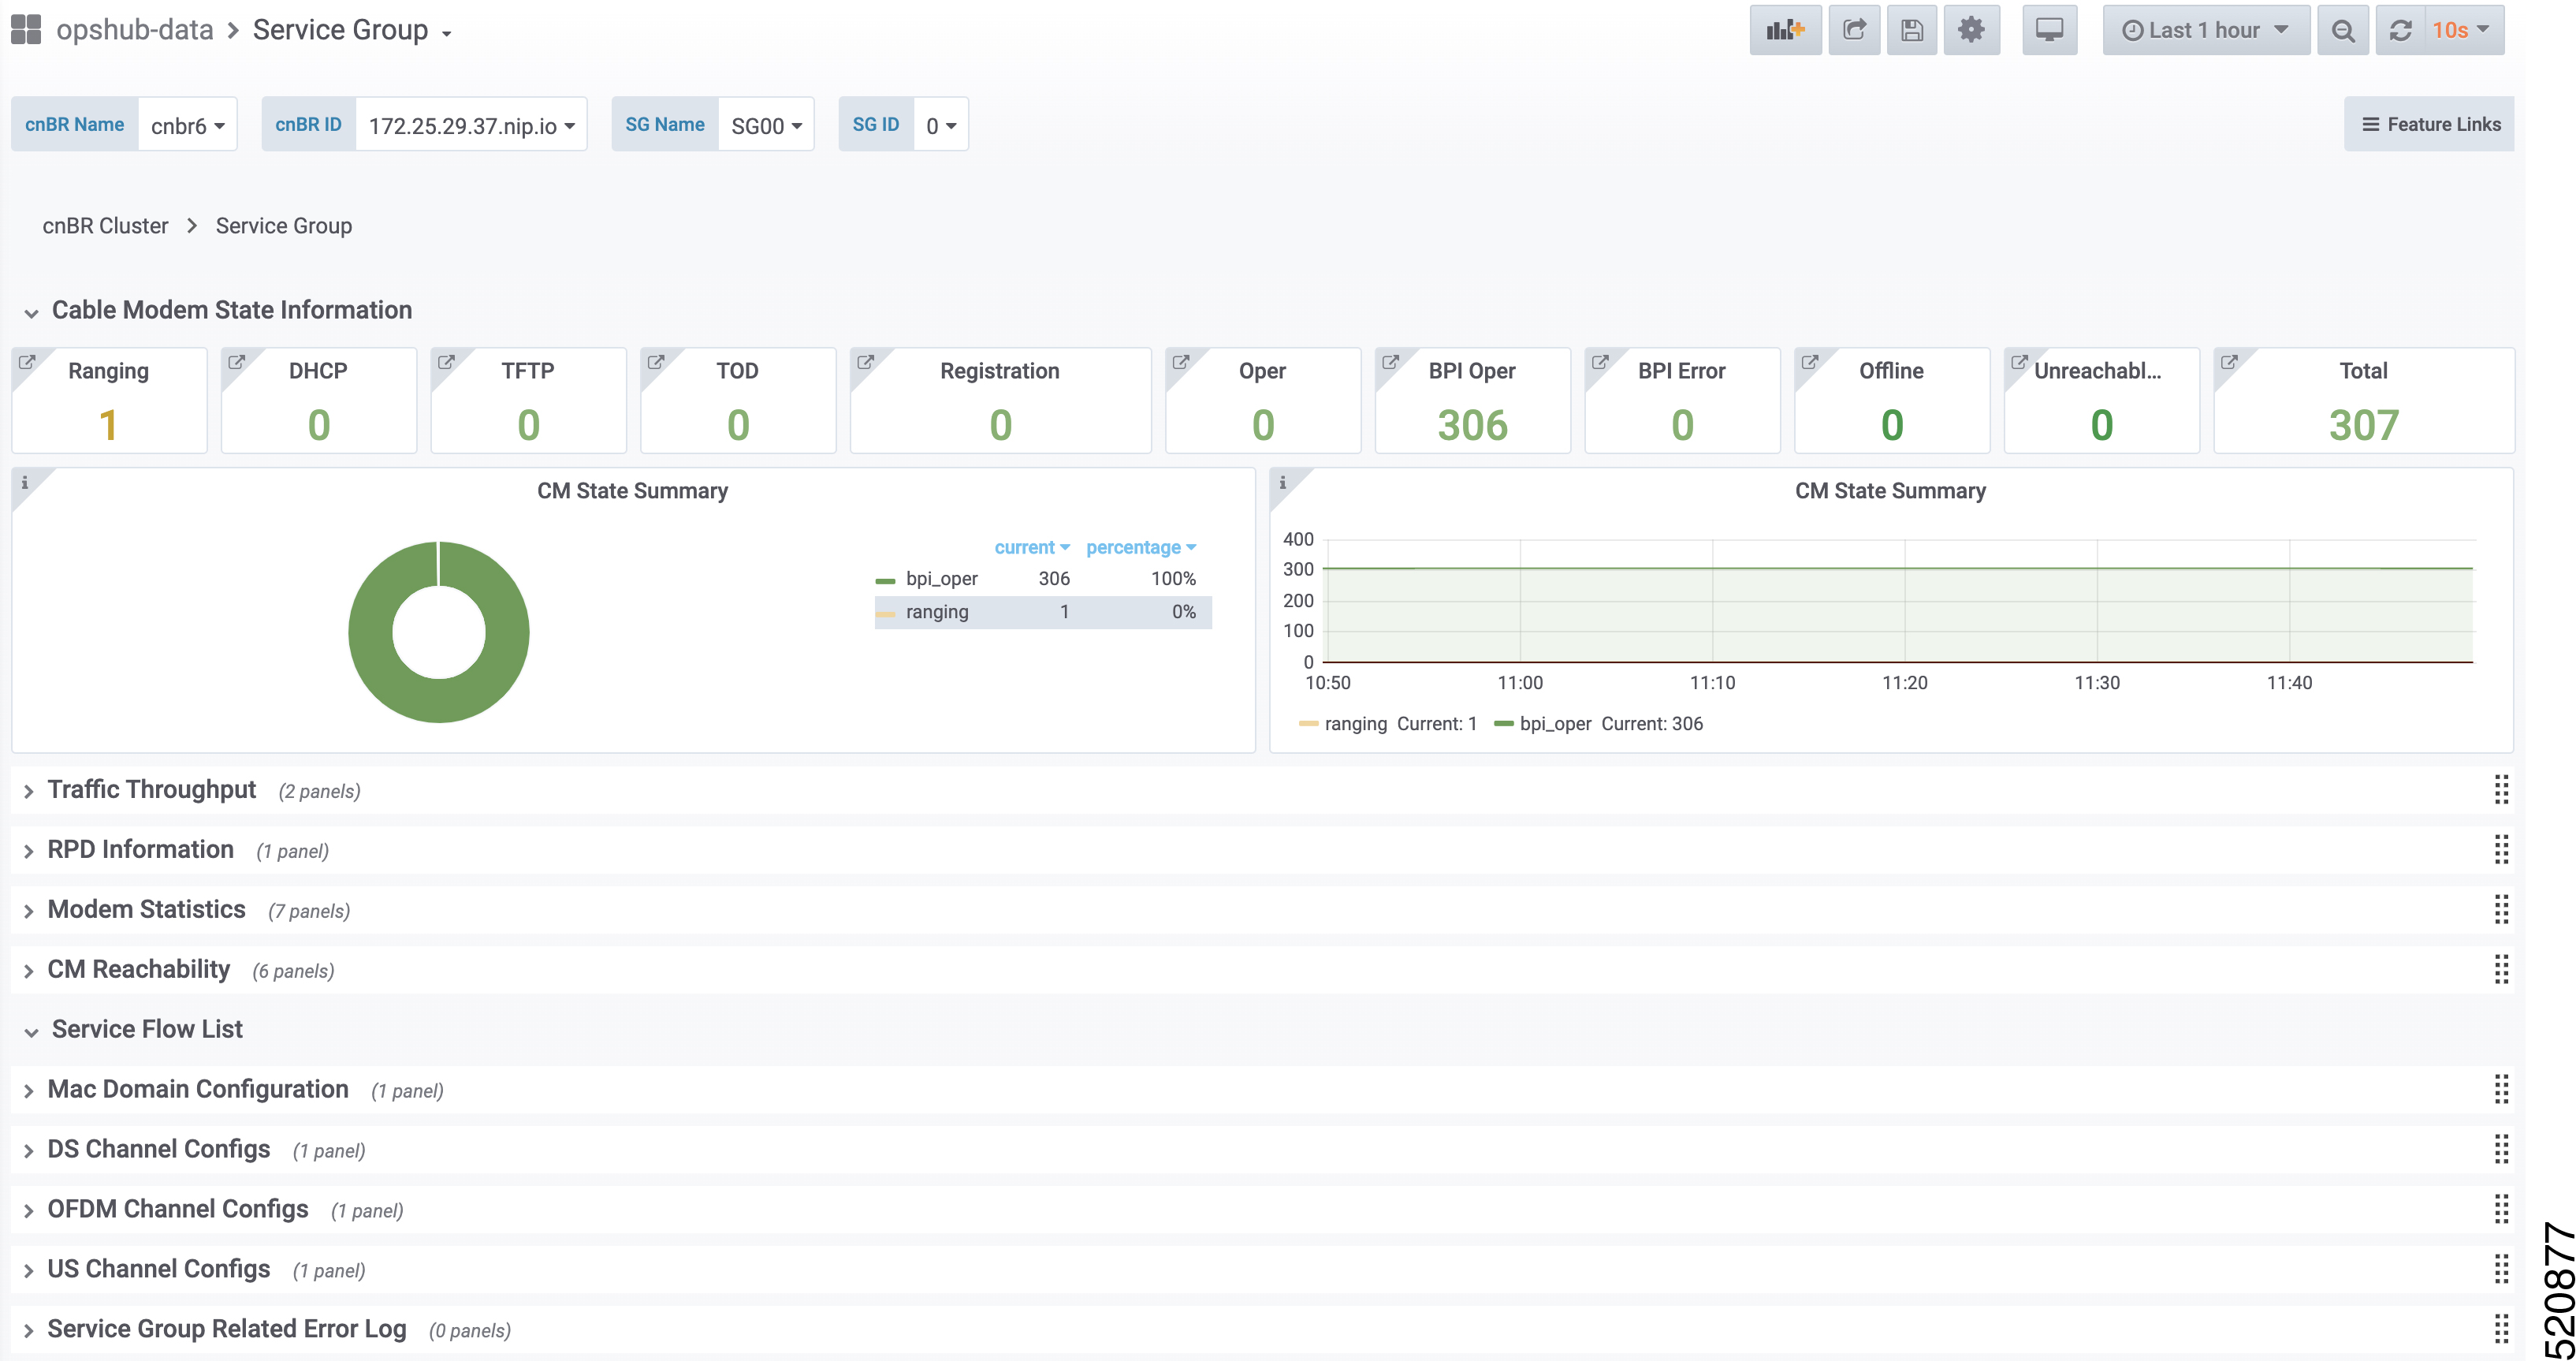
Cable modem status information

This section shows a summary of the status of cable modems in the specified service group by using a pie chart, a live graph, and the number of modems available with each service:

  • Ranging: Number of ranging requests received

  • DHCP: Number of DHCP requests received

  • TFTP: Number of TFTP requests received

  • ToD: Time-of-Day (ToD) requests received

  • Registration: Number of registration requests (REG-REQ) or multipart registration request (REG-REQ-MP) received

  • Oper: Number of cable modems that are registered without enabling BPI

  • BPI Oper: Number of cable modems with BPI

  • BPI Error: Number of Baseline Privacy Interface (BPI) errors even if cable modem is registered

  • Offline: Number of modems that are offline

  • Unreachable: Number of modems that are unreachable

Traffic throughput

Shows the traffic throughput for a selected service group. Provides following live graphs:

  • DS Traffic Throughput

  • DS Channel Frequency & Utilization

  • US Traffic Throughput

  • US Channel Frequency & Utilization.

RPD information

The table shows a list of RPDs of this service group.

  • MAC Address: MAC address of the RPD, link to RPD Verbose page.

  • Name: Name of the RPD.

  • SG Name: Service group name of the RPD.

  • Service Group: Service group ID of the RPD.

  • IPv4 Address: IPv4 address of the RPD.

  • IPv6 Address: IPv6 address of the RPD.

  • State: State of the RPD.

    • online

    • offline

  • Role: Role of the RPD.

    • principal

    • auxiliary

  • cnBR ID: cnBR cluster ID of the RPD.

  • Online Timestamp: Timestamp when the RPD is online.

Modem Statistics

This section contains pie charts for the following summaries:

  • CM DOCSIS version summary

  • CM QoS version summary

  • CM OperVer summary

  • CM models summary

  • Online CM Summary on Primary DS Chan

  • Online CM Summary per TCS and US Chan

Cable Modem Table

Cable modem table for selected service group.

  • Cable Modem: MAC address of the cable modem.

  • IPv4: IPv4 address of the cable modem.

  • IPv6: IPv6 address of the cable modem.

  • State: State of the cable modem.

  • SG: Service group of the cable modem.

  • MD: MAC domain of the cable modem.

  • SID: Service ID of the cable modem.

  • DS Count: Downstream channel count of the cable modem.

  • US Count: Upstream channel count of the cable modem

  • CPE Count: CPE count of the cable modem

  • Online Time: Timestamp when the modem online

  • Offline Time: Timestamp when the cable modem offline.

You can do the following operations on cable modems for a selected Cisco cnBR and the service group from the Actions drop-down option.
  • Reset All Offline Modems

  • Reset All Searched Modems

  • Delete All Offline Modems

  • Delete All Searched Modems

CM Reachability

Displays a graph and a table for the cable modems which are not reachable.

Service Flow List

The Downstream Service Flow List and Upstream Service Flow List tables provide the following details:

  • SF ID: Service Flow ID.

  • CableModem: MAC address of the modem.

  • Stage: Stage of service flow:

    • PRE_REGISTRATION: Service flow is provisioned before REGISTRATION.

    • REGISTRATION: Service flow is provisioned in REGISTRATION.

  • Frame Type:

    • PRE_D30: Pre-3.0 DOCSIS concatenation and fragmentation.

    • CCF_ON: Continous Concatenation and Fragmentation is enabled.

    • CCF_OFF: Continous Concatenation and Fragmentation is disabled.

  • State: State of service flow

    • Prov: Service flow is in provision.

    • Adm: Service flow is in admit.

    • Active: Service flow is active.

    • Type: Primary, Secondary

    • MdID: MAC Domain ID of the modem.

    • SgId: Service group ID of the modem.

MAC domain configuration

MAC domain configuration.

  • MAC Domain: MAC domain ID. The link opens the CMTS Mac Domain page.

  • cnBR: cnBR cluster.

  • Service Group ID: Service group ID.

  • Primary DS channels: Primary downstream channels for this MAC domain.

  • US channels: Upstream channels for this MAC domain.

DS channel configs

Downstream channel configuration.

  • downstream channel ID: Downstream channel ID

  • annex: Annex of the downstream channel

    • AnnexA

    • AnnexB

  • frequency: Frequency of the downstream channel

  • modulation: Modulation of this downstream channel

    • qam64

    • qam256

  • interlevel: Interlever of the downstream channel

  • poweradjust: Power adjustment of the downstream channel.

OFDM channel configs

OFDM channel configuration.

  • ofdm chan id: OFDM channel ID

  • startfrequency: Start frequency

  • width: Width of the OFDM channel

  • plc: PHY Link Channel.

  • rolloff: Rolloff of the OFDM channel

  • profilencp: Profile Next Codeword Pointer

  • cyclicprefix: Cyclicprefix of the OFDM channel.

  • pilotScaling: Pilot Scaling

  • profiilecontrol: Profile control

  • interleaverdepth: Interlever depth

  • subcarrierspacing: Subcarrier Spacing

  • profiles: Link to OFDM Channel Profile Data page.

US channel configs

Upstream channel configuration.

  • upstream channel id: Upstream channel ID

  • slotsize: Minislot size

  • frequency: Frequency

  • docsismode: DOCSIS Mode

  • modulation: Modulation profile

  • powerlevel: Power level

  • channelwidth: Channel width

  • sgid: Service group ID

Service Group dashboard

CMTS MAC Domain

The Dashboard displays the following information:

Describes each panel in the CMTS MAC Domain dashboard

Panel Name

Description

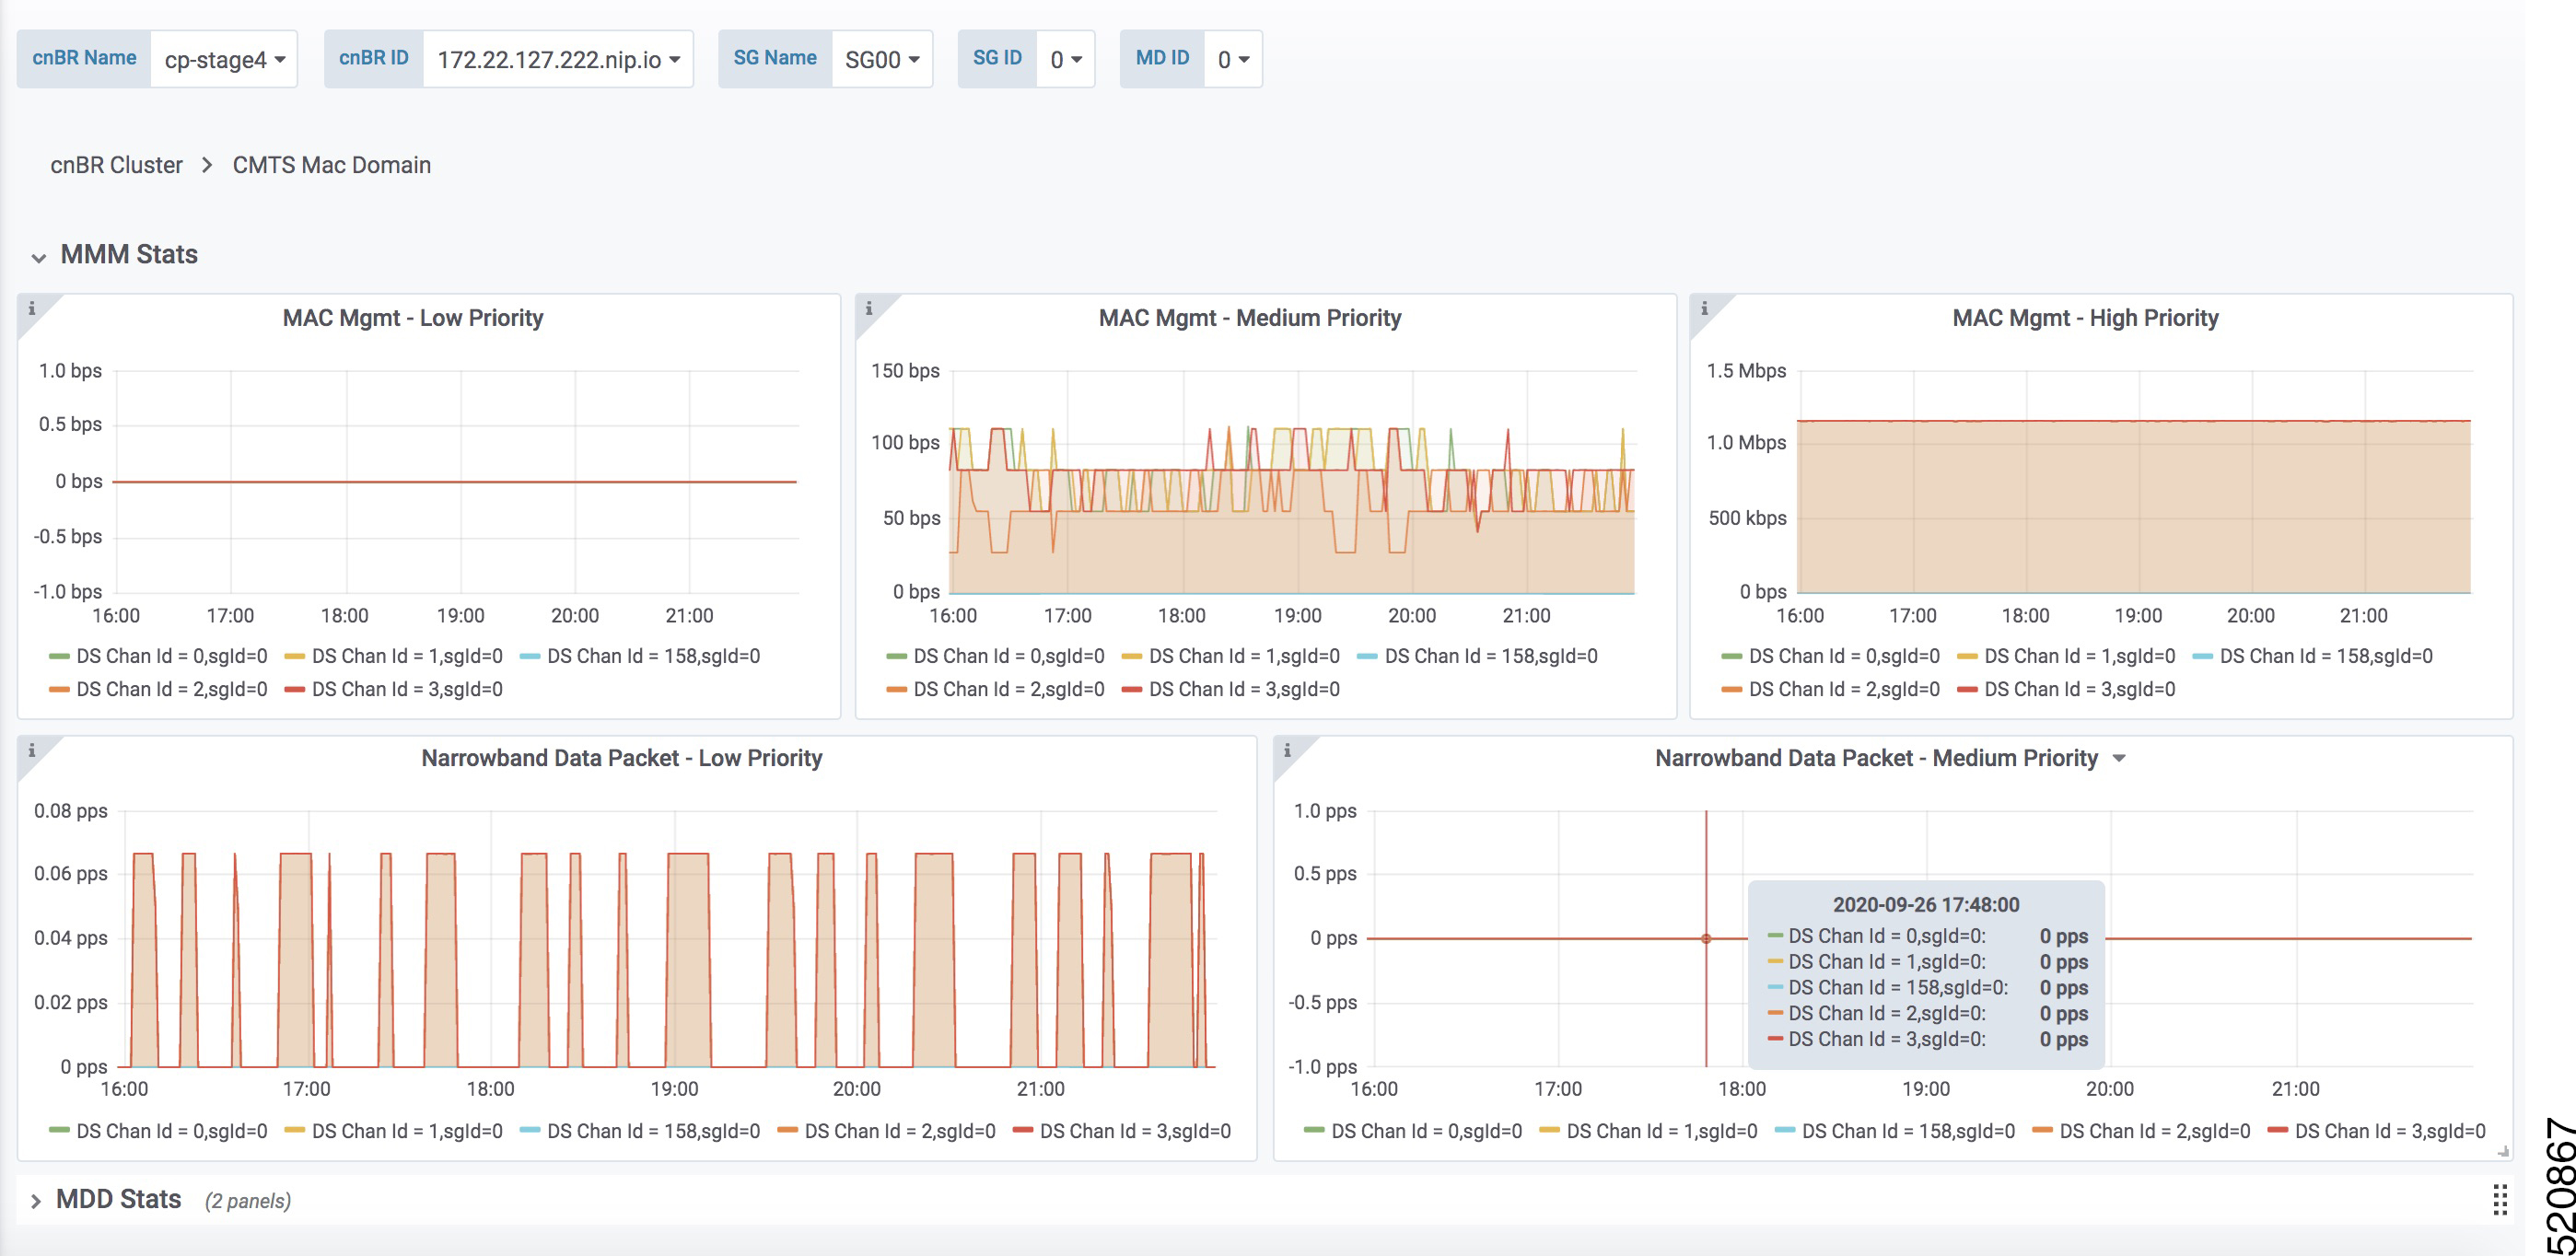
MMM stats

Rate history of MAC management messages.

MDD stats

Rate history of MDD.

CMTS MAC Domain dashboard

DS Channel

The Downstream (DS) Channel dashboard displays the following information:

Describes each panel in the DS Channel dashboard

Panel Name

Description

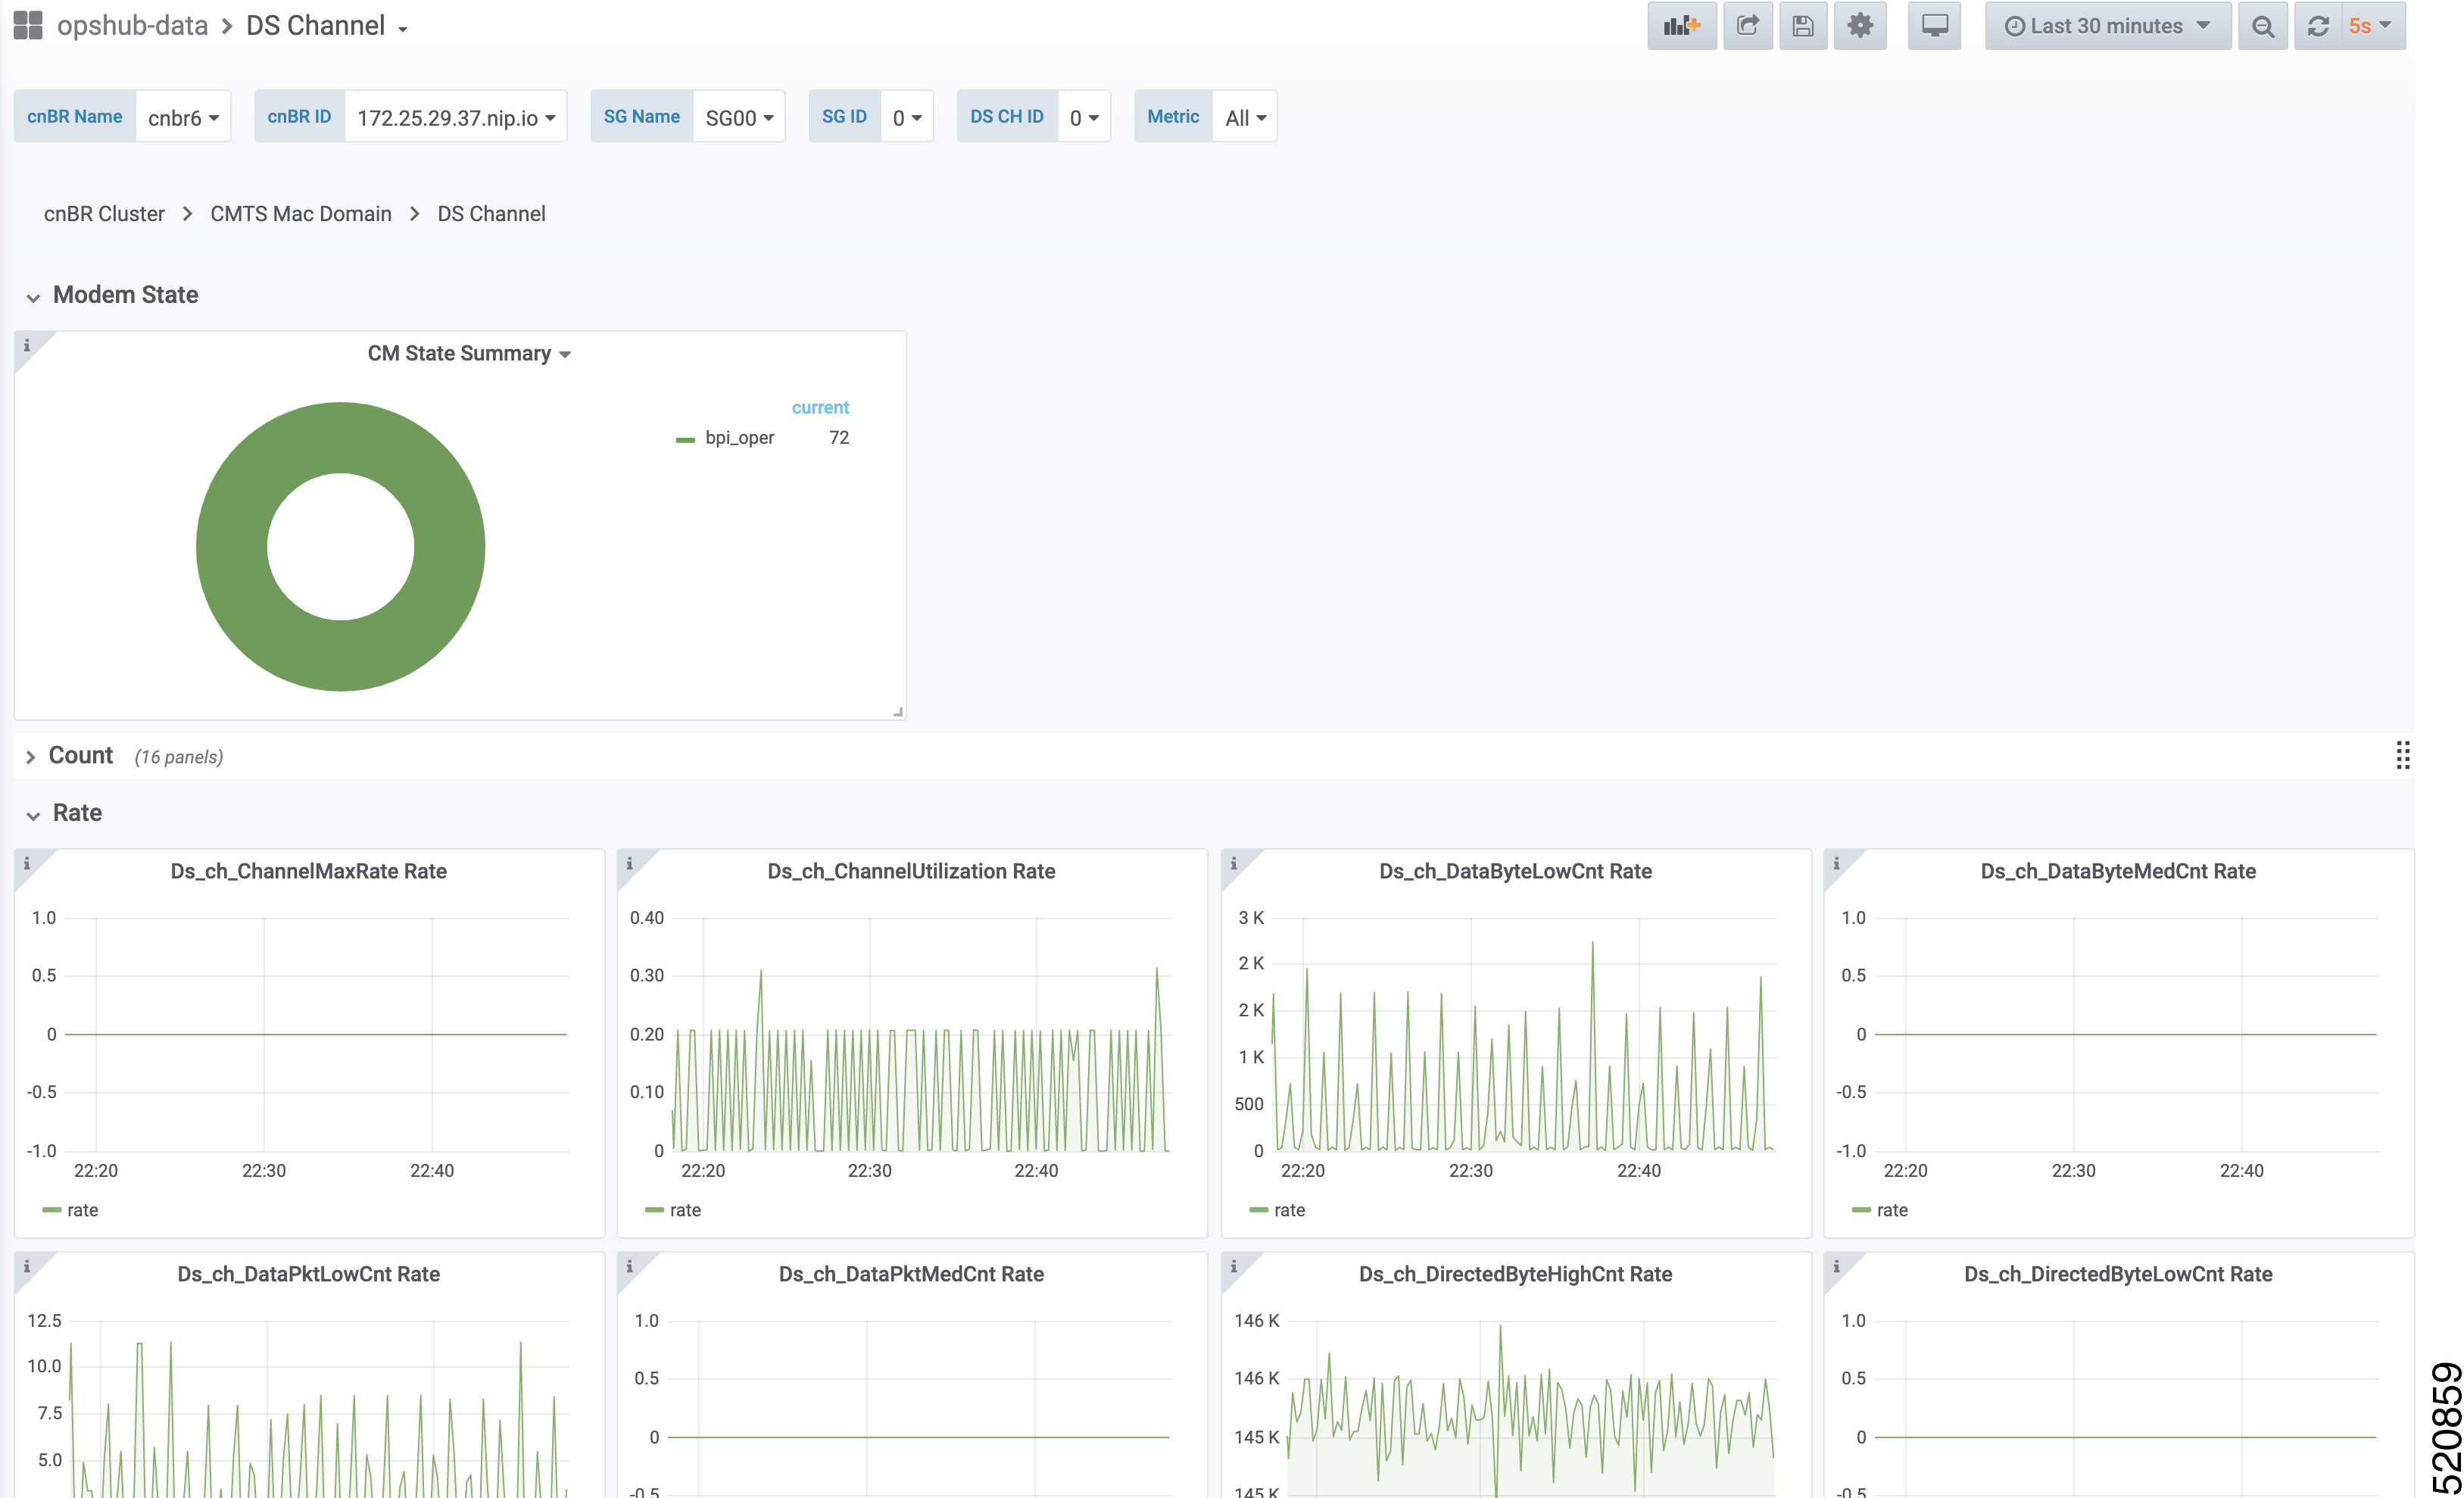
Modem state

Summary of modems in different states for the specific Cisco cnBR cluster.

Count

Downstream channel count of the cable modem.

Rate

Downstream traffic rate for the Cisco cnBR cluster.

DS Channel dashboard

Modem US Channel

The Dashboard displays the following information:

Describes each panel in the Modem US Channel dashboard

Panel Name

Description

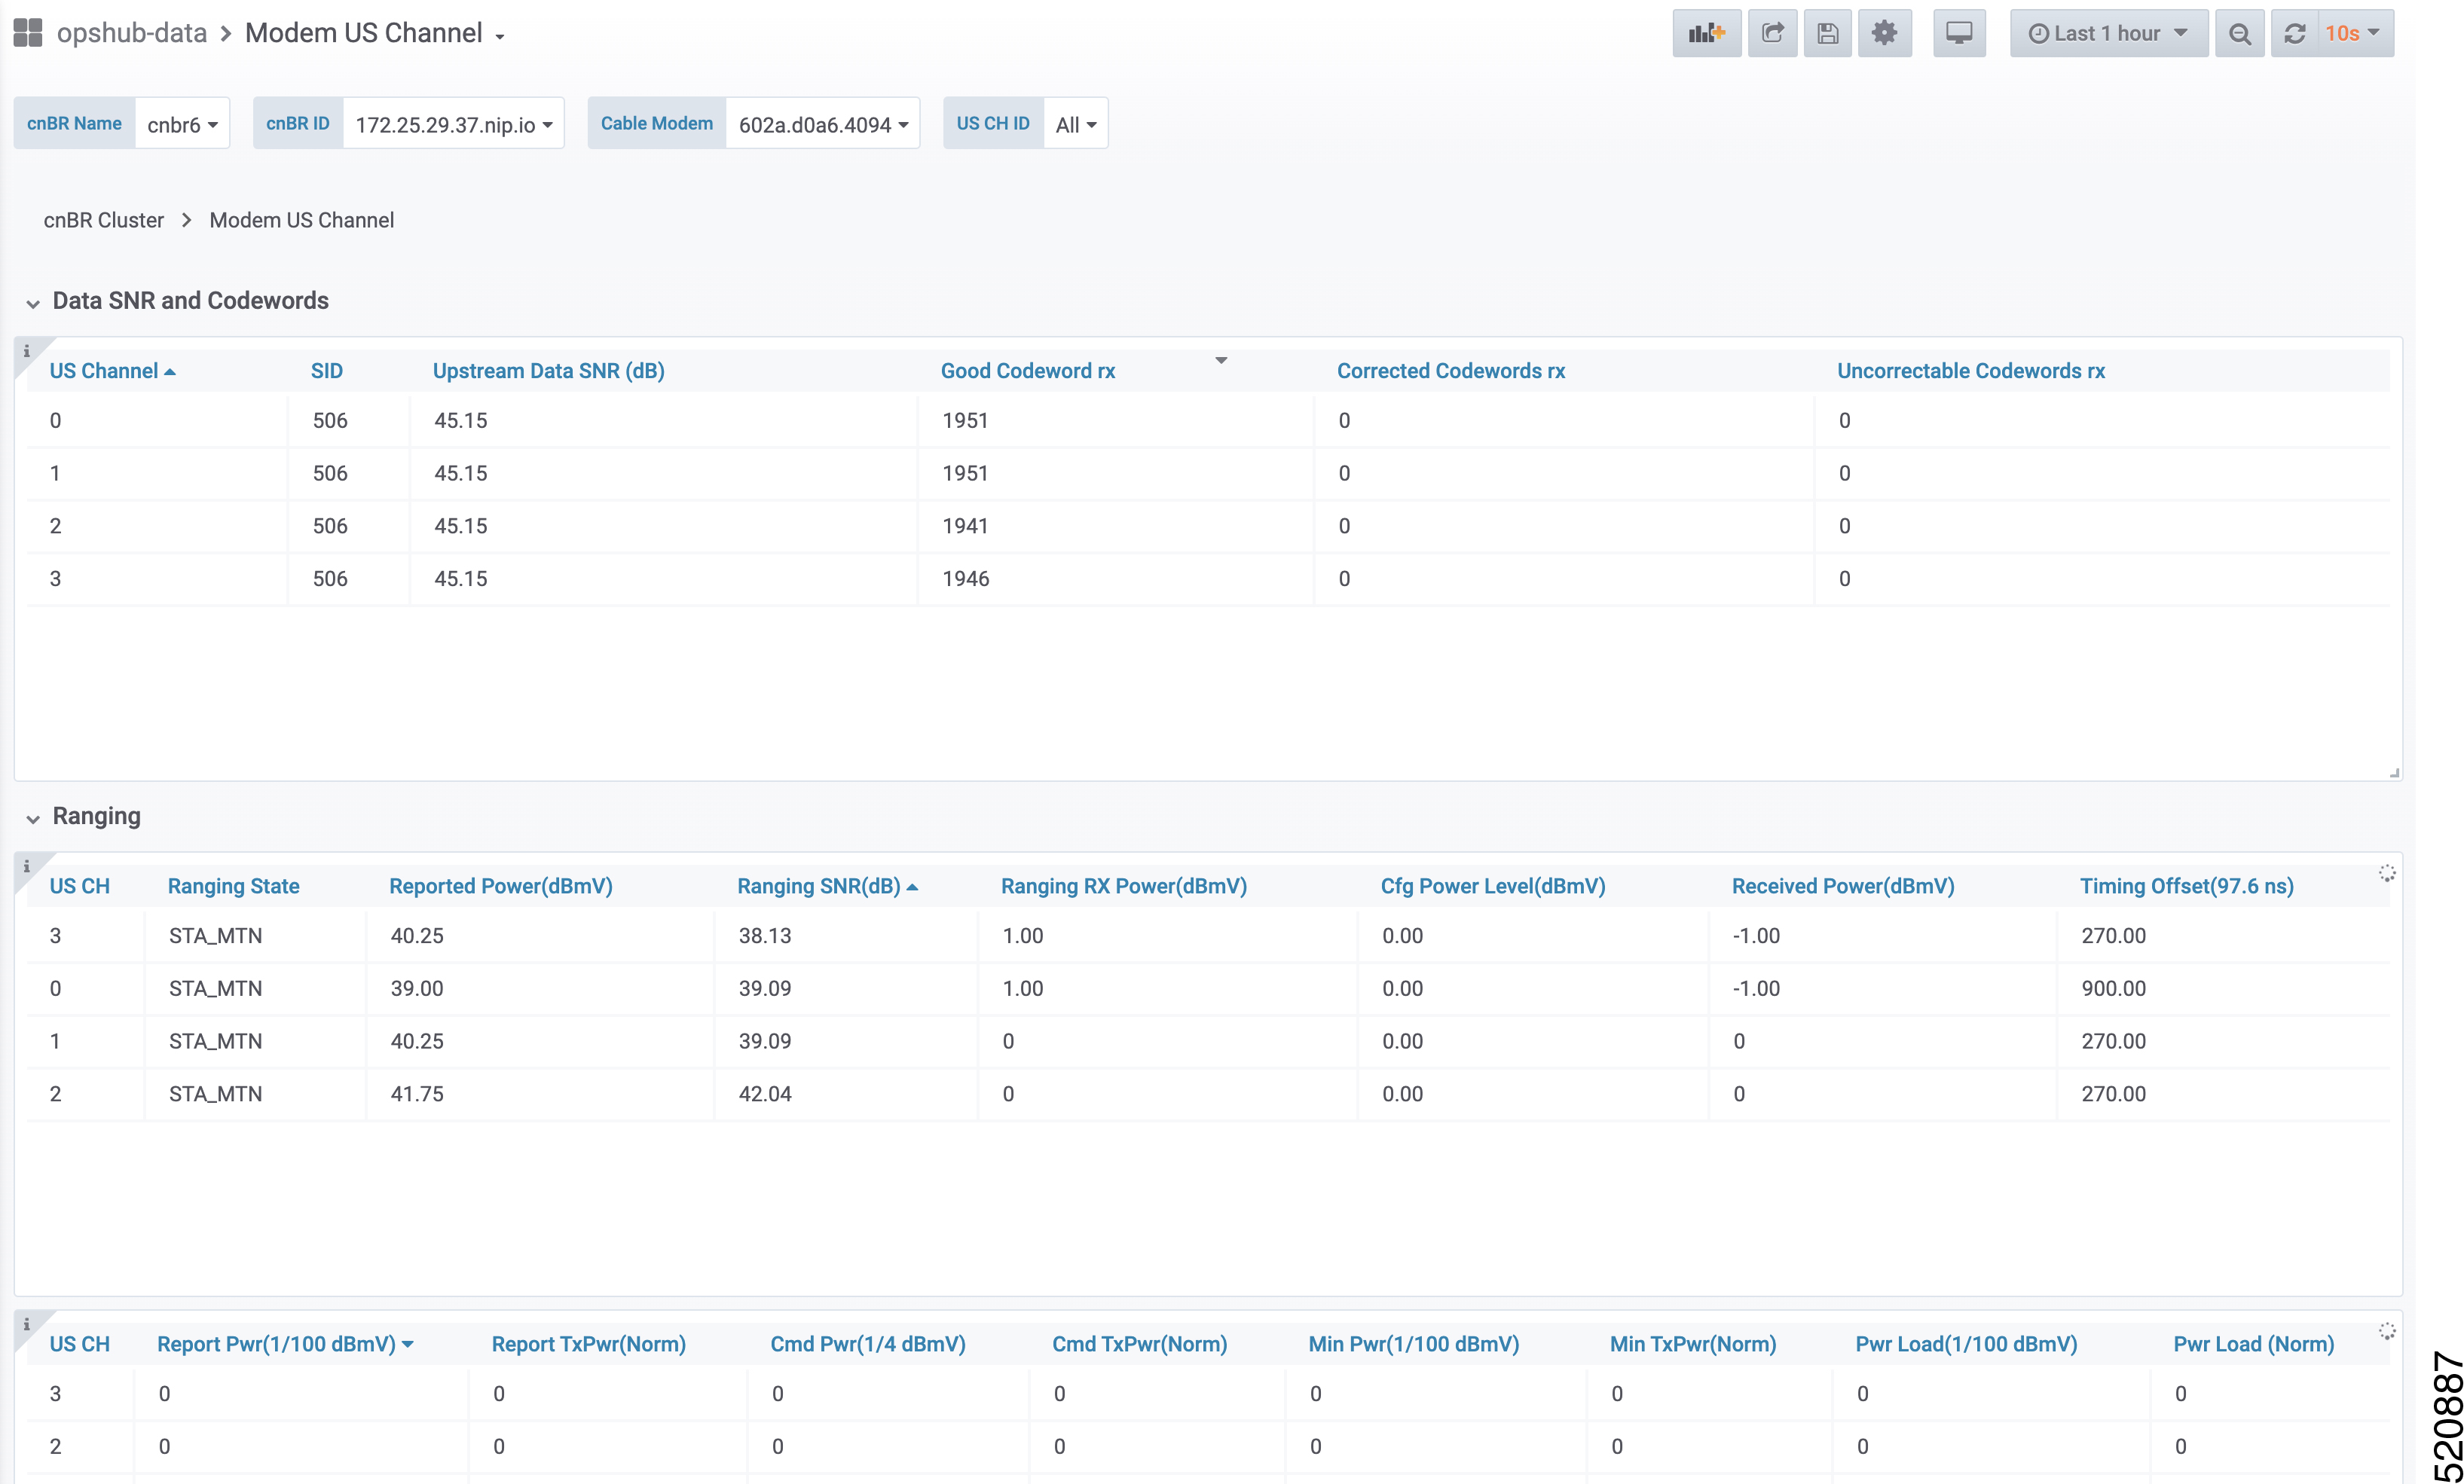
Data SNR and Codewords

SNR and Codeword information of the upstream channel for the cable modem.

Ranging

Ranging information of cable modems.

Modem US Channel dashboard Modem US Channel dashboard

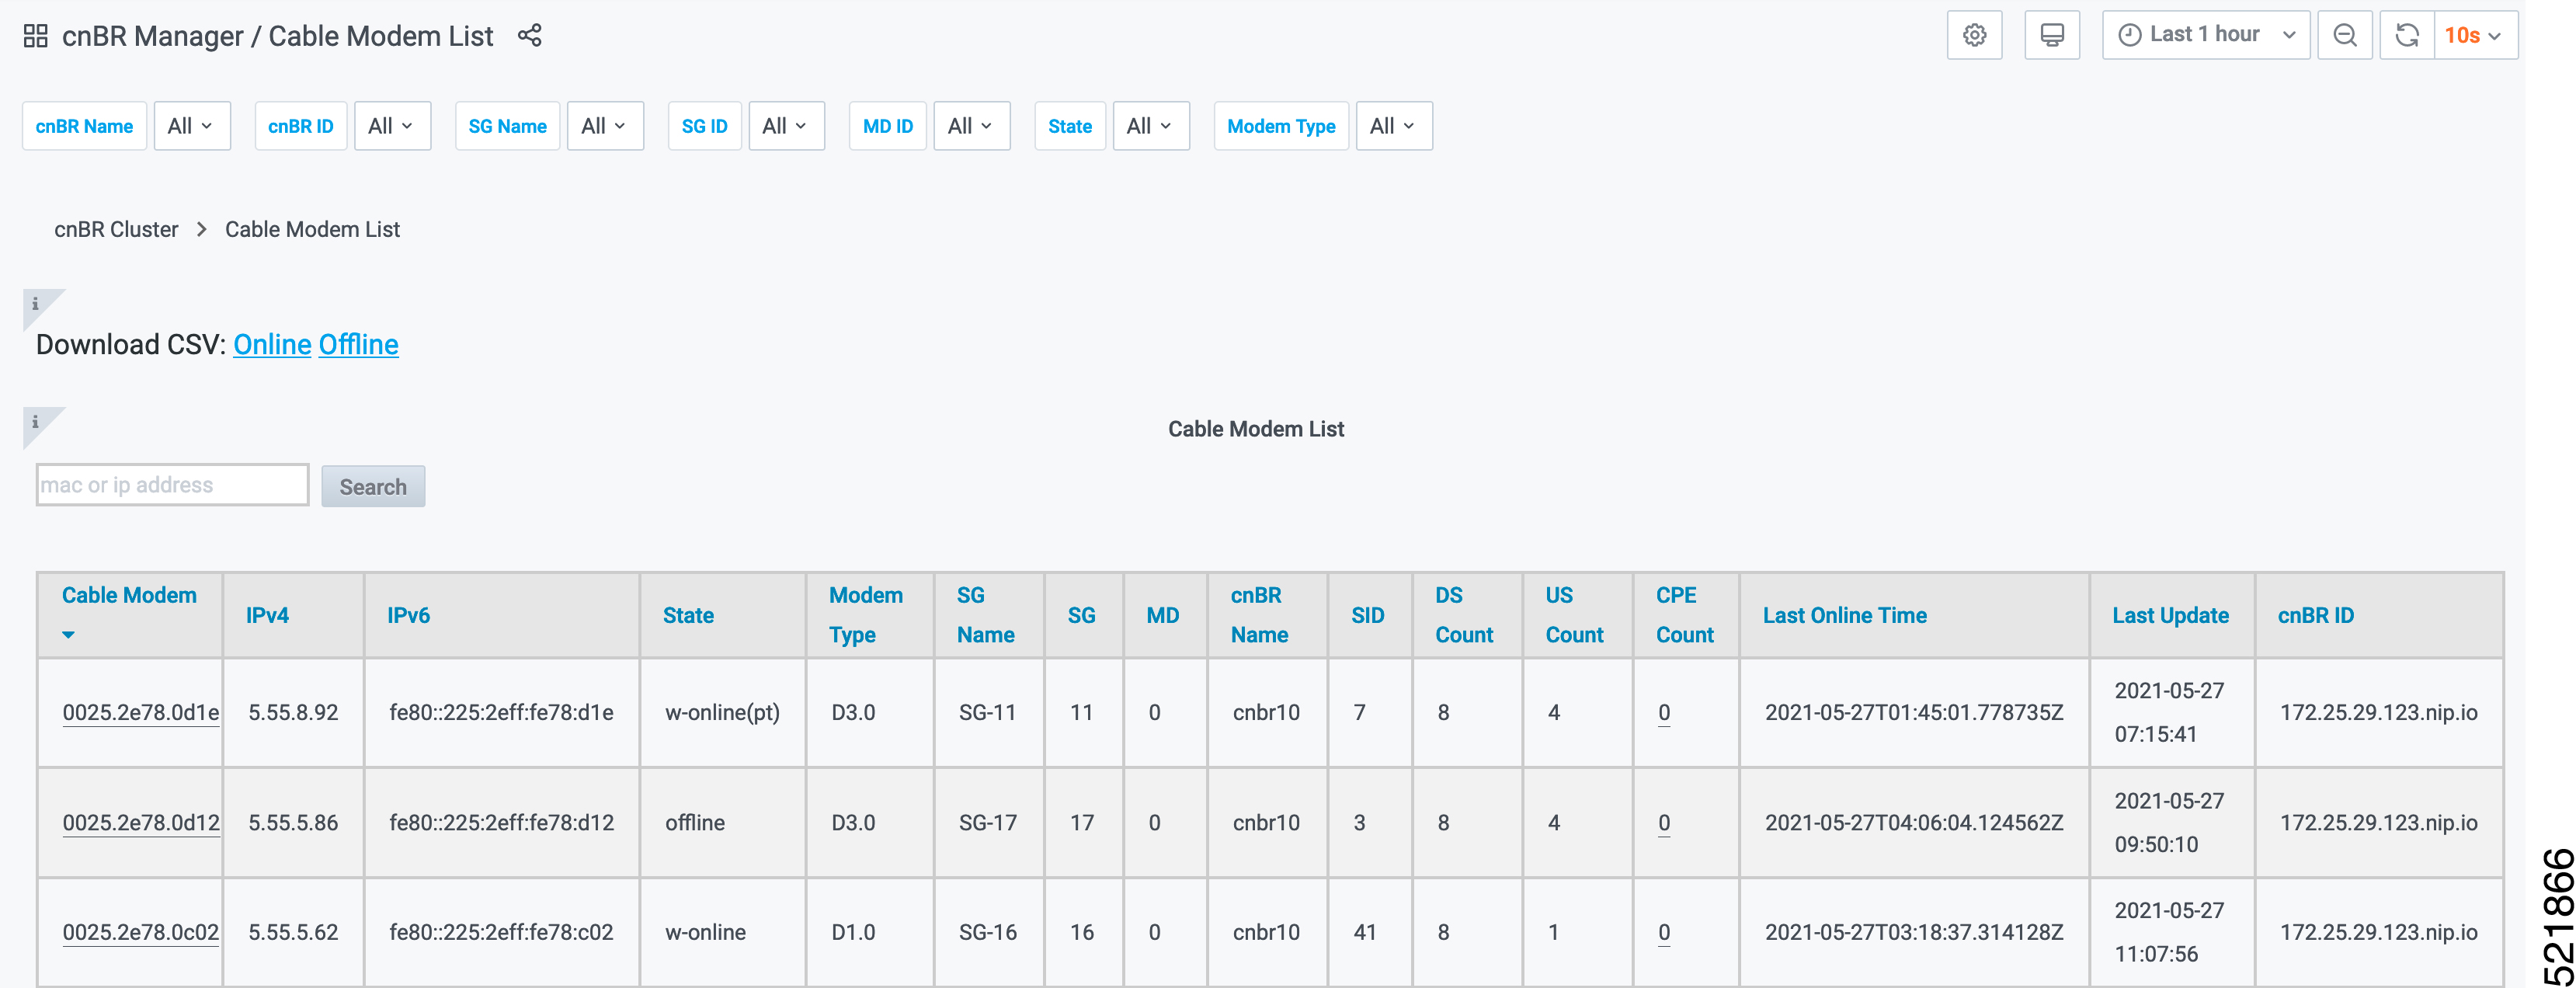
Cable Modem List

The Dashboard displays all Cable Modems in a list, based on the cluster, Service Group, Mac Domain, CM state and CM type.

Describes each panel in the Cable Modem List dashboard.

Panel Name

Description

Modem List

Detailed modem state information list. Use the search text box to filter modems by MAC address, IPv4 address, or IPv6 address. The number of rows in the Modem List table is limited to 256. The parameter Total denotes the total number of modems that are filtered by clusterIp and the search text.

  • Cable Modem: MAC address of the cable modem

  • IPv4: IPv4 address of the cable modem

  • IPv6: IPv6 address of the cable modem

  • State: State of the cable modem

  • Modem Type: DOCSIS version of cable modem, that is D3.1, D2.0, D1.0

  • SG Name: Service group name of the cable modem

  • SG: Service group ID of the cable modem

  • MD: MAC domain ID of the cable modem

  • cnBR ID: cnBR Identifier

  • SID: Service ID of the cable modem

  • DS Count: Downstream channel count of the cable modem

  • US Count: Upstream channel count of the cable modem

  • CPE Count: CPE count of the cable modem

  • Online Time: Time stamp when the modem became online

  • Offline Time: Time stamp when the cable modem became offline

  • Last Update: Time stamp of the last entry

The Download CSV option allows you to download information for online and offline cable modems. However, the download option is limited to one Cisco cnBR cluster at a time. You can use the Cable Modem State History dashboard for historical information.

Cable Modem List dashbboard

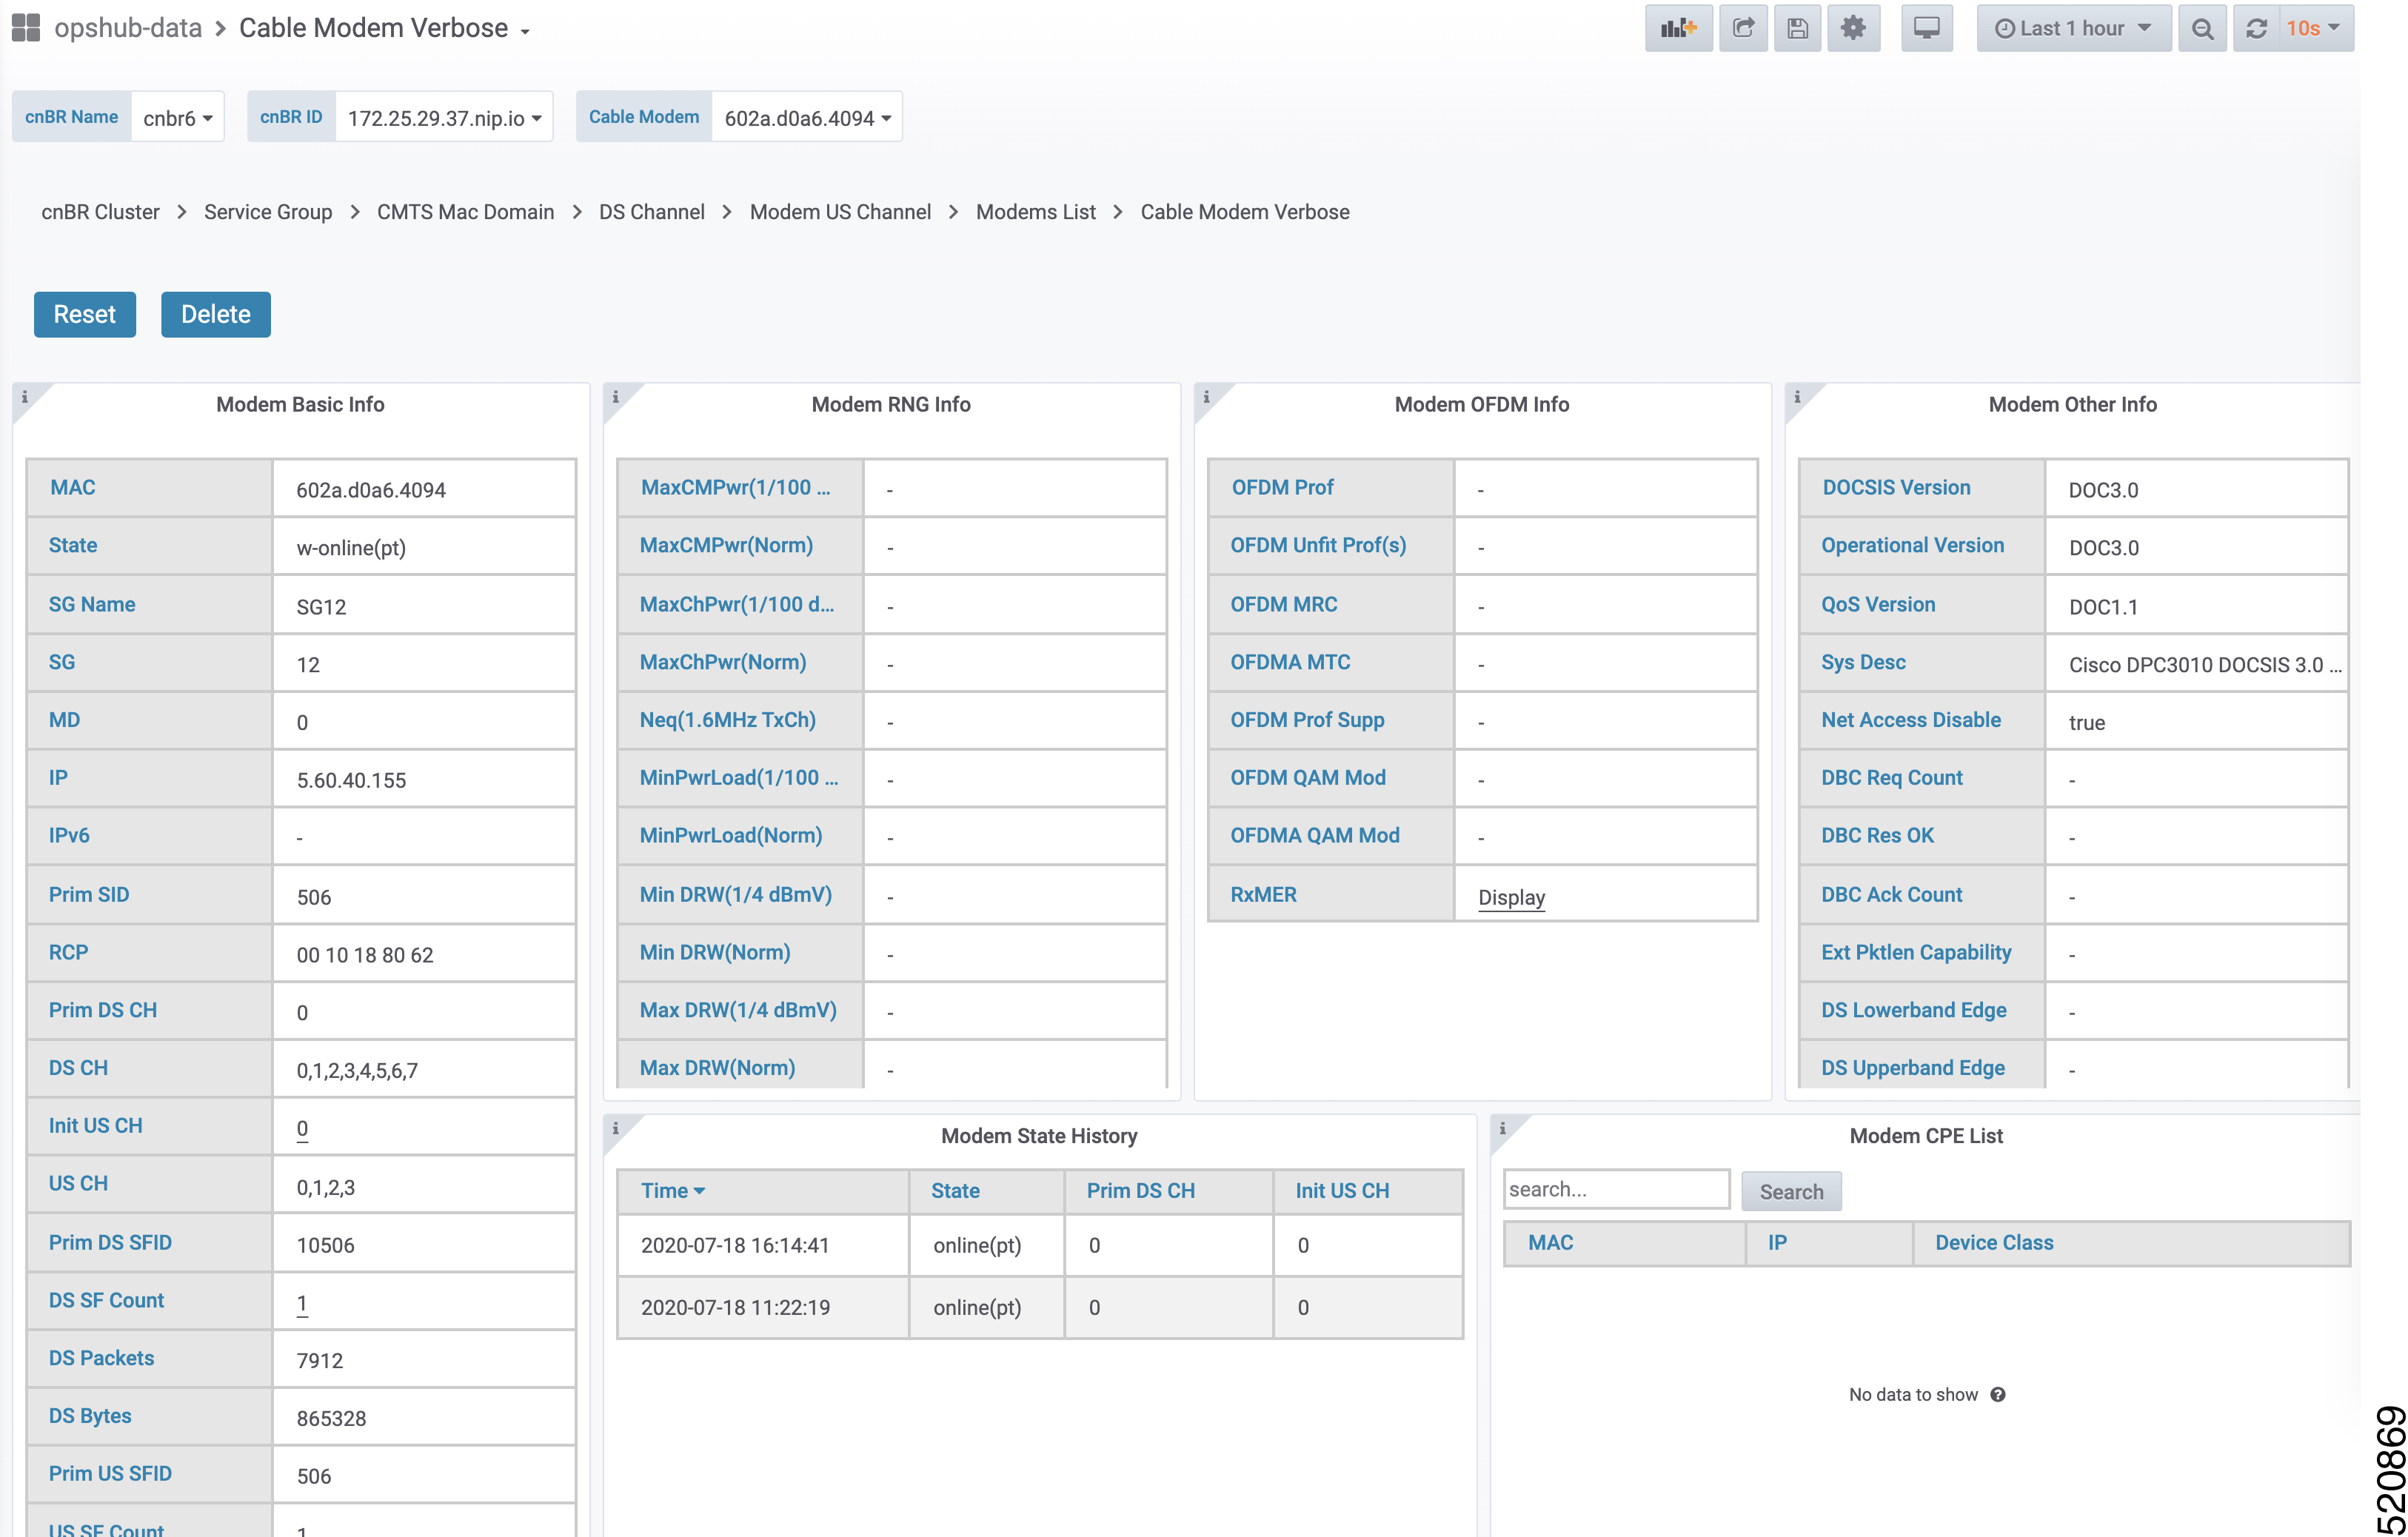
Cable Modem Verbose

The Dashboard displays the following information:

Describes each panel in the Cable Modem Verbose dashboard.

Panel Name

Description

Modem Basic Info

Basic information about the cable modem.

Modem RNG Info

Ranging information of the cable modem.

Modem OFDM Info

OFDM information of the cable modem.

Modem Other Info

Additional information of the cable modem:

  • DOCSIS Version: DOC1.0, DOC1.1, DOC2.0, DOC3.0, DOC3.1

  • Operational Version: DOC1.0, DOC1.1, DOC2.0, DOC3.0, DOC3.1

  • QoS Version: DOC1.0, DOC1.1

  • Sys Desc: System description

  • DBC Req Count: Count of DBC(Dynamic Bonding Change) request

  • DBC Res OK: Count of DBC response with OK

  • DBC Ack Count: Count of DBC ack

  • Ext Pktlen Capability: External packet length capability

  • DS Lowerband Edge: Downstream lower band edge

  • DS Upperband Edge: Downstream upper band edge

  • US Upperband Edge: Upstream upper band edge

  • DTP Mode: DOCSIS time protocol mode

  • DTP Performance: DOCSIS time protocol performance

Modem State History

History of the cable modem status.

Modem CPE List

CPE list of cable modem.

  • MAC: CPE MAC address

  • IP: IP address of the modem

  • Device Class: CPE device class

CPE device class:

  • EROUTER

  • EMTA

  • SMTA

  • ESTB

  • EDVA

  • ECM

  • EPS

Modem Ping Stats

History of cable modem IP pings.

Service Flow Stats

Shows the details of upstream and downstream service flows.

Channel Stats

You can view the following details:

  • US CH RNG SNR History: History of upstream channel ranging SNR(Signal Noise Ratio).

  • US CH RNG RX Power History: History of upstream channel ranging RX power(dBm).

  • DS CH (RxPwr&SNR) History: History of downstream channel RX power and SNR by remote query.

  • US CH (TxPwr&TxTimingOffset) History: History of upstream channel TX power and timing offset by remote query.

  • Modem Timing Offset History: History of upstream channel timing offset of Cisco cnBR side.

  • Modem Ranging State History: History of upstream channel ranging state.

DBC Event

Shows the details of the Dynamic bonding change (DBC) events.

Resiliency Event

History of upstream resiliency state.

Cable Modem Verbose dashboard Cable Modem Verbose dashboard

Cable System Description Summary

The dashboard displays the Cable Modem versions and system summary. The following table lists the panel names and their descriptions.

The table contains information about the dashboard, and displays the Cable Modem versions and system summary.

Panel Name

Description

Vendor

The pie chart shows Cable Modem Vendor distribution.

HW Version

The pie chart shows Cable Modem Hardware Version distribution.

SW Version

The pie chart shows Cable Modem Software Version distribution.

Cable system Description

The table shows Cable Modem system information along with Power level and SNR

The Cisco cnBR Manager periodically queries Cable Modems to retrieve Cable Modem system information using SNMP. The default polling interval for a query is 15 minutes, and the default SNMP read-only community string is public. You can change the default polling interval and community string by using Kubernetes ConfigMap APIs.

ConfigMap Name: cmts-hm-conf
NameSpace: cnbrmanager-data
Key:
  remote_query:
      interval: 900
      snmp:
          community : public

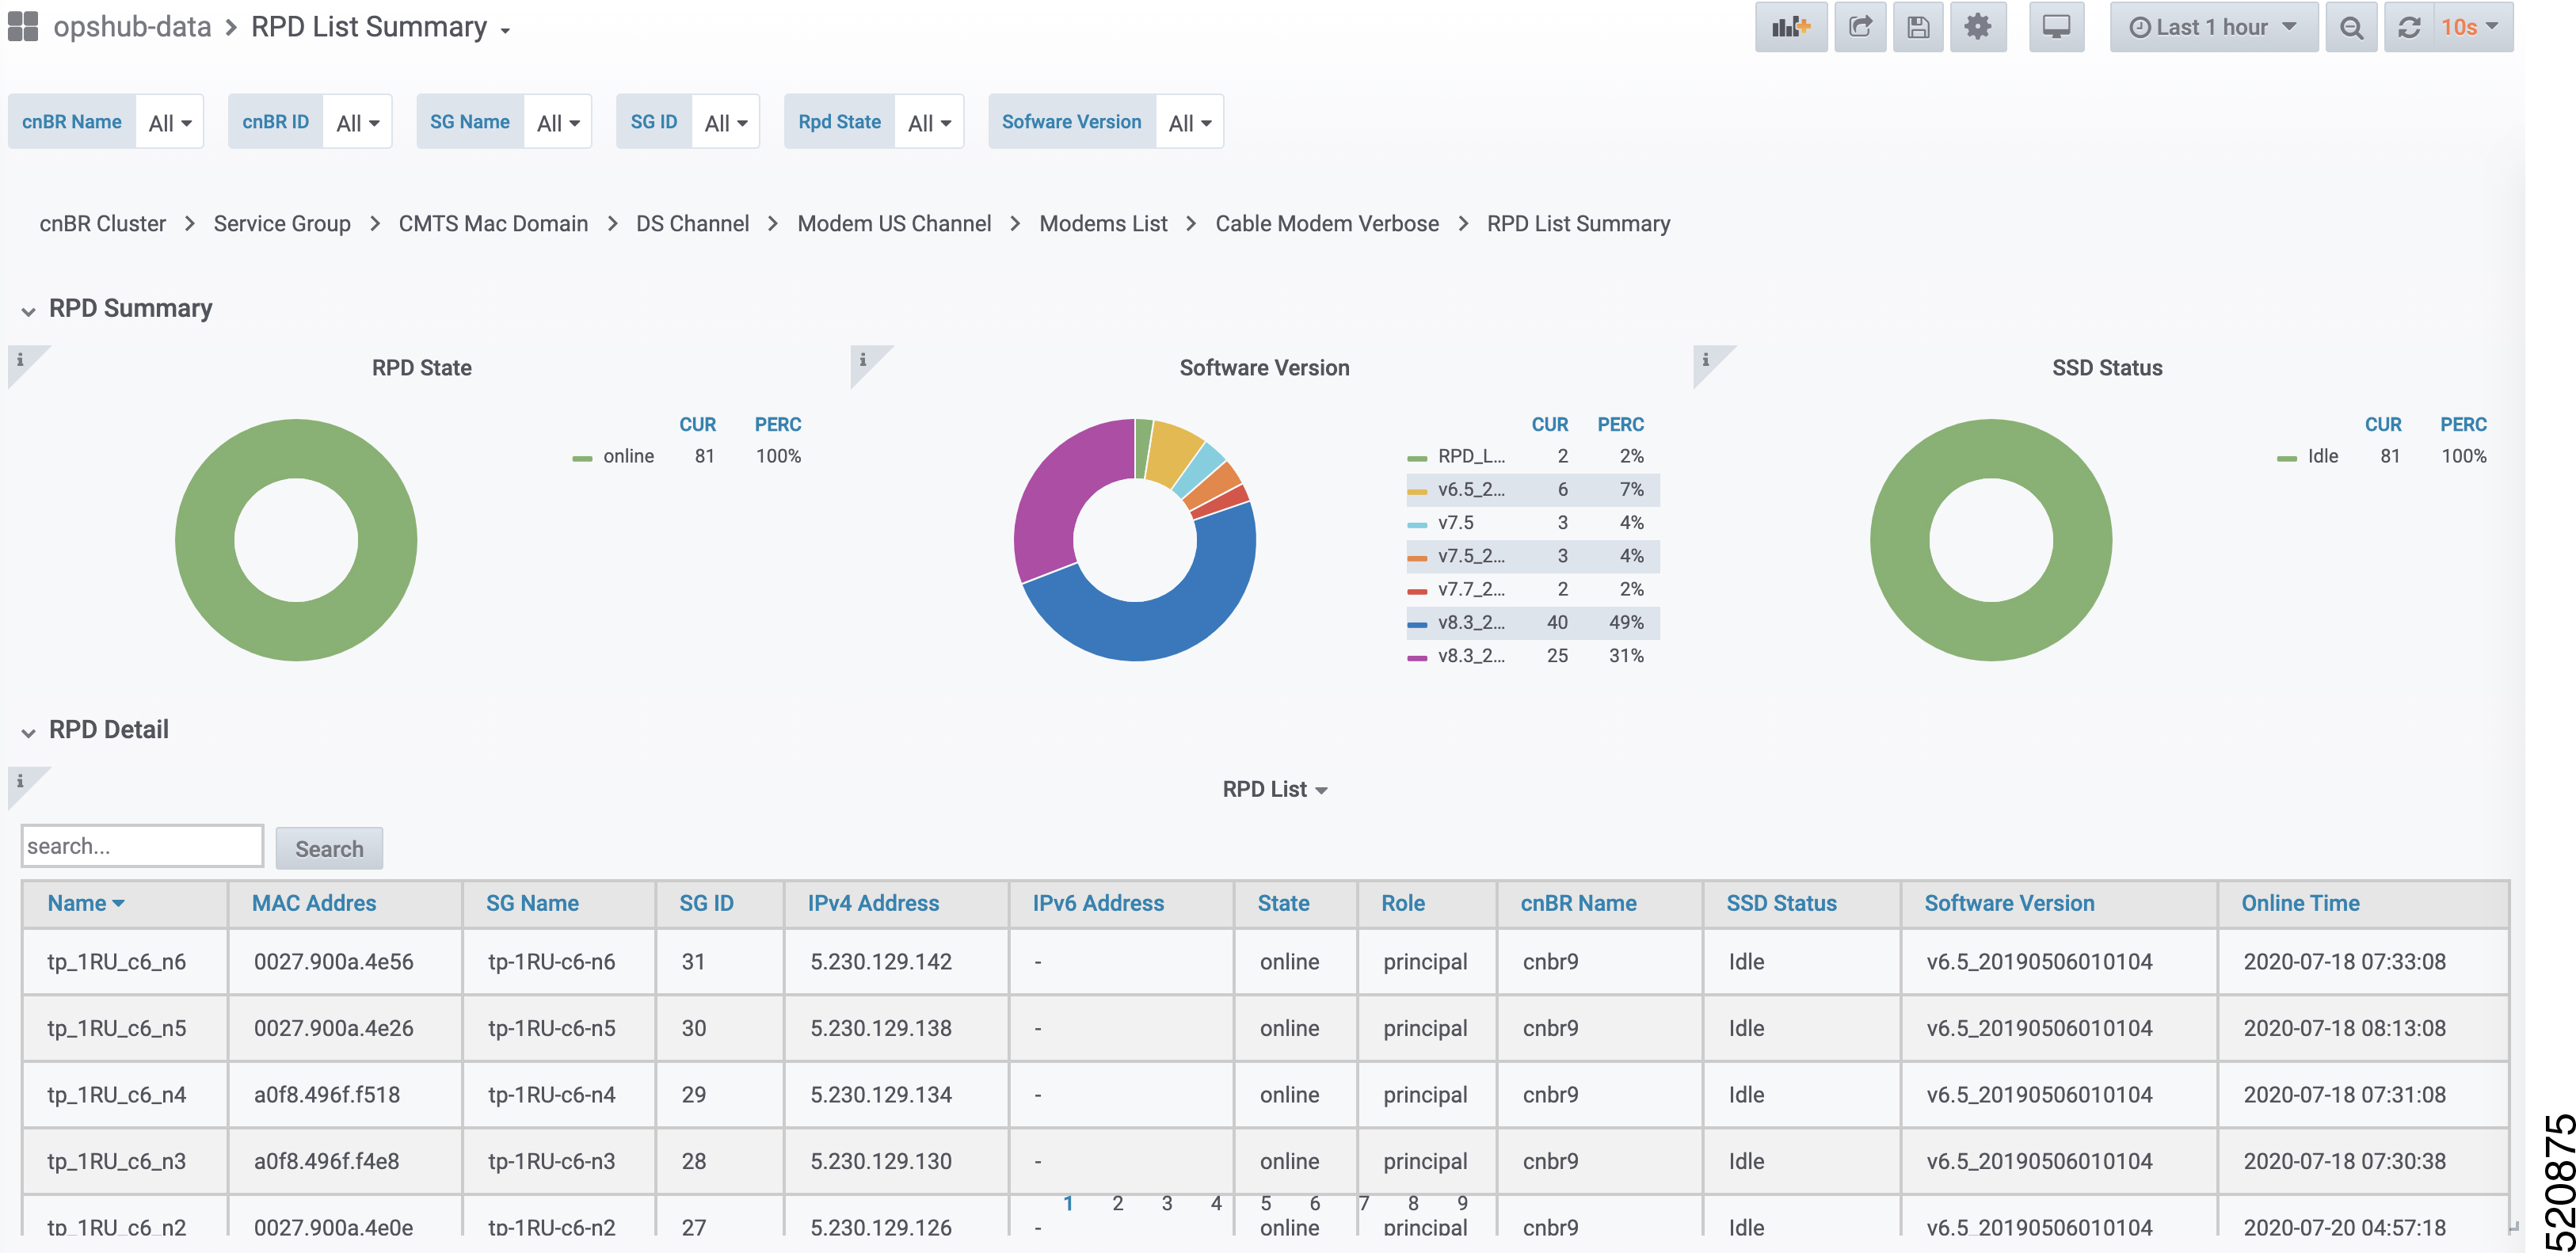
RPD List Summary

The Dashboard displays the following information:

Describes each panel in the RPD List Summary dashboard.

Panel Name

Description

RPD Summary

Shows the following details using pie charts:

  • RPD state: States of the RPDs in the Cisco cnBR cluster

  • Software version: Software version running on the RPDs

  • SSD state: RPD secure software download status

RPD Detail

The table shows details of the RPDs:

  • Name: Name of the RPD

  • MAC: MAC address of the RPD

  • SG: Service group

  • SG Name: Service group name of the RPD.

  • SG ID: Service group ID of the RPD.

  • IPv4 Address: IPv4 address of the RPD.

  • IPv6 Address: IPv6 address of the RPD.

  • State: State of the RPD.

    • online

    • offline

  • Role: Role of the RPD.

    • principal

    • auxiliary

  • cnBR Name: Name of the cluster

  • SSD state: RPD secure software download status

  • Software version: Software version running on the RPDs

  • Online Time: RPD online timestamp

RPD List Summary dasbboard

RPD Verbose

The Dashboard displays the following information:

Describes each panel in the RPD Verbose dashboard.

Panel Name

Description

Basic information

Shows basic information about the RPD.

  • MAC: MAC address of the RPD

  • Name: Name of the RPD

  • SG: Service group

  • IPv4: IPv4 address

  • IPv6: IPv6 address

  • State: init(auth), init(gcp), init(clksync), init(l2tp), online, offline

  • GCP State: Generic control plane state

  • Role: principle, auxiliary

  • cnBR ID: Cloud CMTS ID

  • Last State: The previous status of RPD

  • Last GCP State: The previous generic control plane state

  • Auth Time: RPD authentication timestamp

  • Online Time: RPD online timestamp

RPD identification

Shows the basic RPD identification detials.

  • RPD ID: RPD MAC address

  • Vendor Name: Vendor name

  • Vendor ID: Vendor ID

  • Model Number: Model number of the RPD

  • Sw Version: Current software version running on the RPD

  • Boot ROM Sw Version: Boot read-only memory software version

  • Device Description: Device description

  • Device Alias: Device alias

  • Serial Number: Serial number

  • Rcp Protocol Ver: R-PHY control protocol version

  • Rpd Rcp Protocol Ver: R-PHY control protocol version

  • Rpd Rcp Schema Version: R-PHY control protocol schema version

  • Hw Revision: Hardware revision

  • Asset Id: Asset ID of the RPD

  • Vsp Selector: Vendor-Specific Preconfiguration.

  • Us Burst Receiver Vendor Id: Upstream burst receiver vendor ID

  • Us Burst Receiver Driver Version: Upstream burst receiver driver version

RPD Capability

Shows the basic capabilities.

  • RPD ID: RPD MAC address

  • Bidirection RF Ports: bidirectional radio frequency ports

  • DS RF Ports: Downstream radio frequency ports

  • US RF Ports: Upstream radio frequency ports

  • 10G Eth Ports: 10-Gigabit Ethernet port number

  • 1G Eth Ports: 1-Gigabit Ethernet port number

  • DS SC-QAM Channels Per Port: Downstream single carrier quadrature amplitude modulation (QAM) channels per port

  • DS OFDM Channels Per Port: Downstream orthogonal frequency division multiplexing (OFDM) channels per port

  • US SC-QAM Channels Per Port: Upstream single carrier QAM channels per port

  • US OFDMA Channels Per Port: Upstream OFDM channels per port

  • DS SCTE-55-1 Channels Per Port: Downstream SCTE-55-1 channels per port

  • US SCTE-55-1 Channels Per Port: Upstream SCTE-55-1 channels per port

  • SCTE-55-2 Modules: SCTE-55-2 Modules

  • US SCTE-55-2 Demodulator Num: Upstream SCTE-55-2 demodulator numbers

  • NDF Channels Per Port: Remote-PHY narrowband digital forward channels per port

  • NDR Channels Per Port: Remote-PHY narrowband digital return channels per port

  • UDP Encapsulation On L2TPv3: User datagram protocol (UDP) encapsulation on Layer 2 Tunneling Protocol version 3

  • DS Distinct PSP Flows: Downstream distinct packet streaming (DPS) protocol flows

  • US Distinct PSP Flows: Upstream DPS protocol flows

  • Asyn MPEG Video Channels Per Port: Asynchronous MPEG video channels per port

  • Flow Tags support capability: Shows whether flow tags support is available or not.

  • Freq Tilt support: Shows whether frequency tilt is supported on the RPD

  • Range of tilt setting: Range of tilt setting

  • ucd processing time: RPD upstream channel descriptor processing time

  • ucd change null grant time: RPD upstream channel descriptor change null grant time

  • Buffer depth monitor alert support: Buffer depth monitor alert support

  • Buffer depth config support: Buffer depth monitor configuration support

  • Multi section timing mer reporting support: Multiple section timings mer reporting support

  • Max DS Psp Seg Count: Max Downstream packet streaming protocol seg count

  • Direct DS Flow Queue Mapping: Direct downstream flow queue mapping

  • DS scheduler PhbId list: Downstream scheduler per hop behavior ID list

  • Pending EvRep Queue Size: RPD pending event report queue size

  • Local Event Log Size: RPD local event log size

  • Supported Optical Node RF: Shows whether optical node radio frequency is supported on the RPD

  • MAX DS Freq: RPD maximum downstream frequency

  • MIN DS Freq: RPD minimum downstream frequency

  • MAX Base Power: RPD maximum base power

  • MIN Tilt Value: RPD minimum tilt value

  • MIN Power Adjust for ScQam Chan: RPD minimum power adjust for single carrier quadrature amplitude modulation channels

  • MAX Power Adjust for ScQam Chan: RPD maximum power adjust for single carrier quadrature amplitude modulation channels

  • MIN Power Adjust for OFDM Chan: RPD minimum power adjust for orthogonal frequency division multiplexing channels

  • MAX Power Adjust for OFDM Chan: RPD maximum power adjust for orthogonal frequency division multiplexing channels

Update history

Update history of the previous 50 RPDs.

  • MAC Address: MAC address of the RPD

  • State: Shows in which state the RPD is functioning:

    • init(auth)

    • init(gcp)

    • init(clksync)

    • init(l2tp)

    • online

    • offline

  • GCP State: offline, c1, c2 ready

  • TimeStamp: time stamp

show cable modem

The table provides basic details of the cable modem.

  • Cable Modem: Cable modem MAC address

  • IPv4: IPv4 address of the modem

  • IPv6: IPv6 address of the modem

  • State: Shows in which state the modem is functioning:

    • init(auth)

    • init(gcp)

    • init(clksync)

    • init(l2tp)

    • online

    • offline

  • SG: Service group

  • MD: MAC domain

  • cnBR ID: Cloud CMTS ID

  • Online Time: RPD online time

  • Offline Time: RPD offline time

  • Last Update: Last update time

RPD configuration

The table shows the basic configuration of RPD.

  • Ds Channel: Downstream channel configuration

  • DsChan Base Power: Base power of downstream channel

  • DsChan Admin State: Admin state

  • Us Channel: Upstream channel configuration

  • Fiber Node: Fiber node configuration

RPD Verbose dashboard

You can use the Reset RPD button to reboot all operations on the RPD.


Note

Resetting the RPD would affect all existing services.


Search for Dashboards

Follow this procedure to search for dashboards:

Procedure


Step 1

Click Cisco Operations Hub > Dashboards.

Step 2

On the navigation panel, click Find a Dashboard.

Step 3

Enter the dashboard name in the Search dashboards by name field and select the target dashboard.

Alternatively, you can also click Infrastructure, cnBR Manager, or Operations Hub folders and browse for a specific dashboard.


Customize Dashboards

This table lists the features and the releases in which the feature was introduced and gives a small description of the feature.

Table 3. Feature History
Feature Name

Release Information

Feature Description

Customize Dashboards

Cisco cnBR 21.2

You can customize Cisco cnBR and Cisco Operations Hub dashboards to analyze and visualize your data the way you want to. You can use the real-time data or the historical data for this purpose.

Cisco Operations Hub and Cisco cnBR Manager include numerous prebuilt data-visualization dashboards.

Dashboards in cnBR Manager show information about the Cisco cnBR and the RPDs they serve. The dashboards provide the following information:

  • A real-time look at the health and metrics (updated every 10 sec)

  • Historical data for visualizing trends over longer intervals

Cisco Operations Hub dashboards show information on the infrastructure and cloud software that powers Cisco cnBR and the Operations Hub.

The prebuilt dashboards are designed to meet the needs of most cable service providers. However, according to your requirement, you may customize the existing dashboards or create new dashboards. This section explains how to customize and create new dashboards.

Plan and Organize New Dashboards

You can create or customize dashboards based on your familiarity with Grafana and its data sources.

  • If you are new to Grafana, you can create new dashboards using existing dashboards.

  • If you are familiar with Grafana, you can create dashboards from scratch or export existing dashboards, modify them, and import them back into the Cisco Operations Hub.

Before customizing or creating new dashboards, you must do the following:

  • Identify data sources

  • Identify visualization panels

  • Plan the layout

Create a New Dashboard

Procedure

Step 1

From the Cisco Operations Hub main menu, click Dashboards.

Step 2

Click Advanced > Manage in the left navigation menu of the Dashboards page.

Step 3

Click the New Dashboard button under the Manage tab.

Step 4

Click Add new panel.

Step 5

Configure the panel with the required data sources and visualization type.

Step 6

Click Save.

You can rearrange the panel location within the dashboard by dragging the panel header to the correct location. You can also resize the panels by dragging the bottom-right corner of the panel.


Create a New Dashboard from an Existing Dashboard

Procedure

Step 1

Open the dashboard which you want to customize.

Step 2

Click the Dashboard settings gear icon at the top of the dashboard page.

Step 3

Click Save As… on the left side of the dashboard Settings page.

Step 4

Enter a new dashboard name and choose a folder in the Save dashboard as... pop-up window.

Step 5

Click Save.

Step 6

Open this new dashboard, click the Panel Title, and click Edit to edit the panel properties.

On the Edit Panel page, edit the panel properties in the three tabs: Panel, Field, and Overrides. You can also create a query, and set the transformations and alerts for the dashboard.

Step 7

Click Save at the top of the Edit Panel page.

You can rearrange the panel location within the dashboard by holding and dragging the panel title to the required location. You can also resize the panels by dragging the bottom-right corner of the panel.


Create New Dashboard Using Export and Import

The following process is recommended only for advanced users.

Procedure

Step 1

Open the dashboard that you want to export.

Step 2

Click the share icon at the top of the page to the right of the dashboard name.

Step 3

Click the Export tab.

Step 4

Click Save to file.

Step 5

Edit the JSON file.

Step 6

From the Cisco Operations Hub main menu, click Dashboards > Advanced > Manage.

Step 7

Click Import.

Use one of the following options to import the dashboard file:

  • Click Upload JSON file and choose the dashboard file.

  • Enter a dashboard URL or ID in the Import via grafana.com text box and click Load.

  • Enter a valid dashboard JSON model in the Import via panel json text area and click Load.

    On the next page, add the required data and click Import.


What to do next

After you import a dashboard, you can customize it. For more details, see Customize Dashboard Panels.

Customize Dashboard Panels

You can add new panels to a newly created dashboard.

  • When you create a dashboard from an existing one, click the Add panel icon to open the Edit Panel page to add more panels.

  • When you create a new dashboard using the New Dashboard option, click the Add new panel button to open the Edit Panel page.

The following tabs are available on the Edit Panel page using which you can edit all panel properties.

The table describes each tab in the Edit Panel

Tab

Description

Query

Allows you to create new queries, configure, and update existing data sources.

Transform

Allows you to calculate, reorder, and rename your query results before visualizing them.

Alert

Allows you to create rules, conditions, and notifications on the supported data sources.

Panel

Allows you to configure the visual properties of the panel. You can choose from the available visualization plug-ins.

Fields

Allows you to rename and configure fields appearing in the visualizations. In addition, you can link the current panel to other panels and dashboards using the Data Links option.

Overrides

Allows you to add rules for field overrides, which provide fine-grained control over how your data appears in the dashboard.

KPI Alert Management

The table lists the features, the Cisco cnBR version in which it was introduced, and also gives a short description of the feature.

Table 4. Feature History

Feature Name

Release Information

Feature Description

KPI Alert Management

Cisco cnBR 20.4

Expands the alerts in Subscriber, RF Plant, and Infra KPI Alert categories.

KPIs (Key Performance Indicator) of Cisco cnBR clusters help in getting information on the overall system stability and on the components that are not functioning normally and are impacting the system stability.

The cnBR Manager supports the following KPI Alert categories:

  • Subscriber

  • RF Plant

  • Infra

Subscriber

This KPI Alert category provides an overview of the subscriber health status of the Cisco cnBR cluster. The following parameters are available in this KPI:

  • CMNotHealthyCMState: If the percentage of online modems is higher than the configured threshold(95%), we can consider this parameter as healthy, otherwise, unhealthy.

  • CMNotHealthyPartialUS: If the percentage of modems in upstream partial-service mode is less than the configured threshold(10%), we can consider this parameter as healthy, otherwise, unhealthy.

  • CMNotHealthyPartialDS: If the percentage of modems in downstream partial-service mode is less than the configured threshold(10%), we can consider this parameter as healthy, otherwise, unhealthy.

  • CMNotHealthyPingLoss: If the ping loss rate is less than the configured percentage threshold(20%), we can consider this parameter as healthy, otherwise, unhealthy.

  • CMNotHealthyPingLatency: If the ping latency is less than the configured threshold(200 ms), we can consider this parameter as healthy, otherwise, unhealthy.

  • RPDNotHealthy: If all the RPDs are online, we can consider this parameter as healthy, otherwise, unhealthy.

RF Plant

This KPI Alert category provides an overview of the RF plant health status of the Cisco cnBR cluster. The following parameters are available in this KPI:

  • DSCHNotHealthyMER: If the primary downstream channel has a Modulation Error Ratio higher than the configured threshold(30 dB), we can consider the channel as healthy, otherwise, unhealthy.

  • USCHNotHealthySNRRanging: If the primary upstream channel has an upstream ranging Signal to Noise Ratio (SNR) higher than the configured threshold(20 dB), we can consider the channel as healthy, otherwise, unhealthy.

  • USCHNotHealthySNRData: If the primary upstream channel has a data-SNR higher than the configured threshold(30 dB), we can consider the channel as healthy, otherwise, unhealthy.

  • DSCHPartialNotHealthy: If the percentage of modems in downstream partial-service mode is less than the configured threshold(10%), we can consider the channel as healthy, otherwise, unhealthy.

  • USCHPartialNotHealthy: If the percentage of modems in upstream partial-service mode is less than the configured threshold(10%), we can consider the channel as healthy, otherwise, unhealthy.

Infra

This KPI Alert category provides the following information:

  • An overview of the pod CPU, memory, and file descriptor usage status of the Cisco cnBR and the Cisco Operations Hub clusters.

  • An overview of the node CPU, memory, and disk usage of the Cisco cnBR cluster.

  • Cisco cnBR reachability and token refresh status.

The following parameters are available in this KPI:

  • NodeNotHealthyMEMIssue: If the available memory of a node is higher than the configured threshold(10%), we can consider the node as healthy, otherwise, unhealthy. Available memory is an estimate of the memory available for starting new applications without swapping.

  • NodeNotHealthyCPUIssue: If the 1-minute CPU load of a node is lower than the configured threshold(90%), we can consider the node as healthy, otherwise, unhealthy.

  • NodeNotHealthyDiskIssue: If the disk usage of a node is less than the configured threshold(80%), we consider the node as healthy, otherwise, unhealthy.

  • PodNotHealthy: If all pods of a node are ready, we consider the node as healthy, otherwise, unhealthy.

  • CriticalPodNotHealthy: If all critical pods(configured in the config map) of a node are ready, we can consider the node as healthy, otherwise, unhealthy.

  • PodNotHealthyHighCPU: If a pod is consuming fewer CPU cores than the configured limit, we can consider the pod as healthy, otherwise, unhealthy.

  • PodNotHealthyHighMEM: If a pod is consuming less memory than the configured limit, we can consider the pod as healthy, otherwise, unhealthy.

  • PodNotHealthyTooManyOpenFileDescriptor: If a pod has less open file descriptors than the configured limit(2048), we can consider the pod as healthy, otherwise, unhealthy.

  • cnBRNotReachable: If the cnBR host is reachable from the Cisco Operations Hub, we can consider the Cisco cnBR as healthy, otherwise, unhealthy.

  • cnBRRefreshTokenFailure: If the token refresh is working for a Cisco cnBR host, consider the host as healthy, otherwise, unhealthy.

Alert Management

The cnBR Manager Alert Management is based on the KPIs. Cisco cnBR records all alerts for users to view. You can configure the alert-manager to manage alerts.

Follow this procedure to view the KPI Alert Management dashboard:

Procedure


Step 1

Enter the Cisco Operations Hub URL https://{Hostname} in the web browser.

Step 2

On the Cisco Operations Hub, click the Cisco Operations Hub main menu button.

Step 3

Choose Dashboard to open the Dashboard page.

Step 4

Click Find a Dashboard to open the search pane.

Step 5

Enter KPI Alert Management in the Search dashboards by name field and click the KPI Alert Management row to open the KPI Alert Management dashboard.


Alert Definition

All alerts are built based on the KPI metrics and divided into several alert groups. Each KPI metric generates one alert that belongs to a predefined alert group. For example, KPI metrics: CM state (Summary of CM online state) generates one alert that is named CMNotHealthy, which is part of the Subscriber alert group. The Alert Management supports the following alerts and alert groups.

Alert groups and alerts for each group

Group

Alert

Subscriber

  • CMNotHealthy

  • RPDNotHealthy

RF

  • USCHNotHealthy

  • DSCHNotHealthy

Infra

  • NodeNotHealthy

  • PodNotHealthy

Alert Record

Alert Management records all alerts that are generated in the Cisco cnBR router. The dashboards display an alert summary and detailed information about those alerts.

KPI Alert Summary

Alert summary dashboards show the number of current alerts and total resolved alerts. In addition, the dashboards display the distribution of alerts based on severity. Cisco cnBR supports two levels of alerts:

  • critical

  • warning

To view the KPI Alert Summary Dashboard, complete the following steps:

  1. On the Cisco Operations Hub, click the Cisco Operations Hub main menu button.

  2. Click Dashboards > DAA Overview.

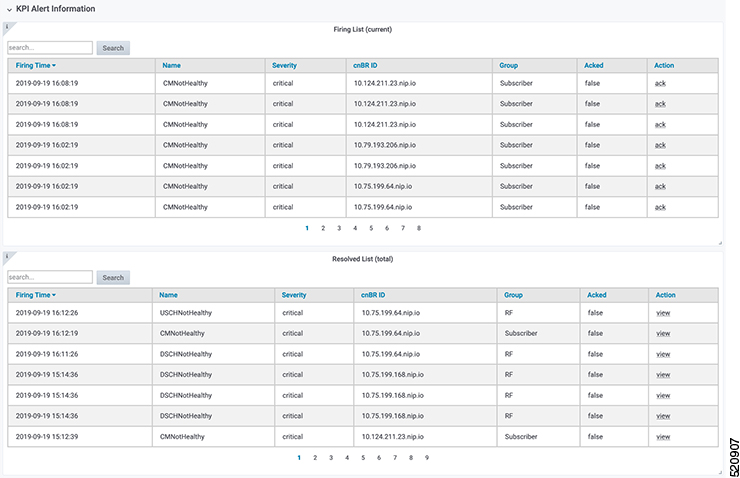
KPI Alert Information

The dashboard shows two lists: Firing Alerts and Resolved Alerts. The following details are available in these tables:

The table describes attribute in the KPI Alert Information pane

Attribute Name

Description

Firing Time

Alert fired time.

Name

Alert name.

Severity

Critical or warning.

cnBR ID

Cisco cnBR where the alert is fired.

Alert Group

Category of the KPI alert.

Acknowledge status

Shows whether acknowledged or not.

Action

Acknowledge or view an alert.

Click the View link. The Alert Action pane on the right side shows the details of the alert.

You can view details and acknowledge firing alerts. For the resolved alerts, you can view the details of each alert.

KPI Alert Information

Acknowledge KPI Alert

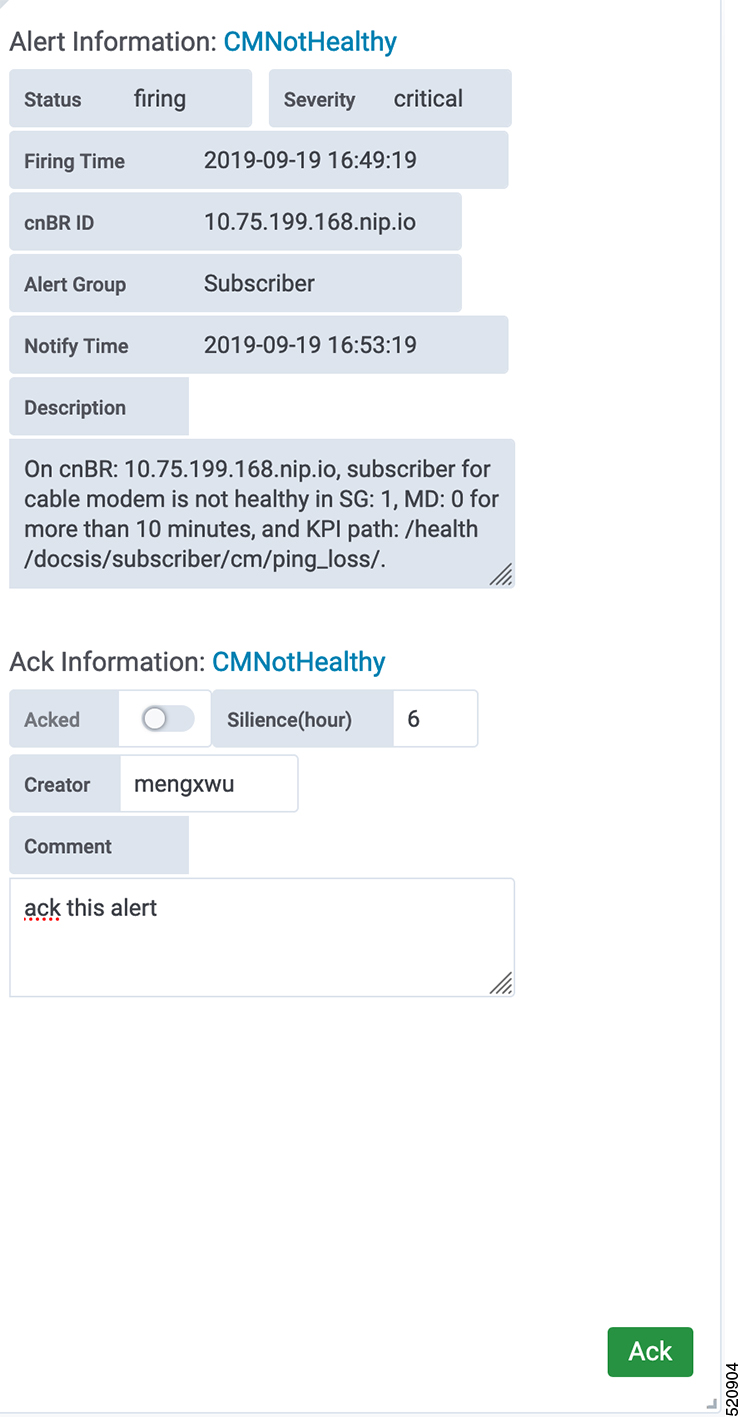
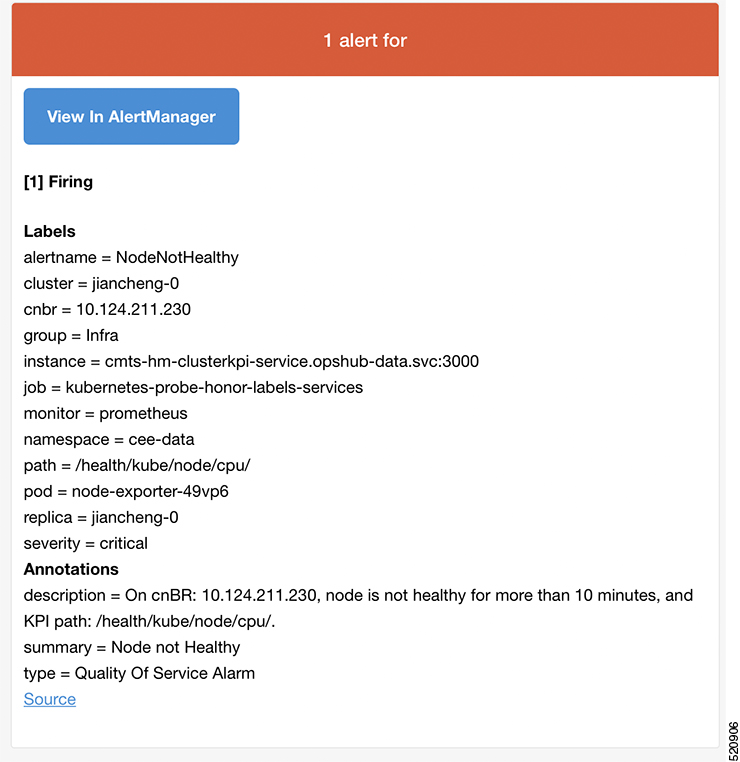
You can acknowledge the firing alerts. By default, every three hours, you are notified about the firing alerts by email. You can stop receiving the alert emails by setting the silence time, creator, and comments.

Acknowledging KPI alerts

Configure Alerts

You can configure global alerts through Alert Management. For global configuration, update the SMTP (Simple Mail Transfer Protocol) settings. By default, this option is disabled.

On the Global Configuration pane, configure the notification channel. The SMTP General Config pane is available under the KPI Global Configuration pane of the KPI Alert Configuration dashboard.

Configure Alerts - Global Configuration pane

Field

Description

SMTP From

The default SMTP From header field.

SMTP Smarthost

The default SMTP smarthost used for sending emails, including the port number. The port number is 25 or 587 for SMTP over TLS (STARTTLS). Example: smtp.example.org:587

SMTP Hello

The default hostname to identify to the SMTP server.

SMTP TLS Require

The default SMTP TLS requirement (Default: false).

KPI Alert Configuration

You can enable or disable an alert group and add or delete email addresses of receivers for each alert group. When you enable an alert group and add email addresses, those users are notified when an alert is generated in the respective group.

KPI Alert Configuration
KPI Alert Email

KPI Alert Email

Monitor and Troubleshoot

The KPI of one Cisco cnBR-Core is displayed on this dashboard.

KPI of Cisco cnBR Core

The state of each category is displayed on this dashboard.

Alert status of KPI category

This dashboard shows the details of the subscriber.

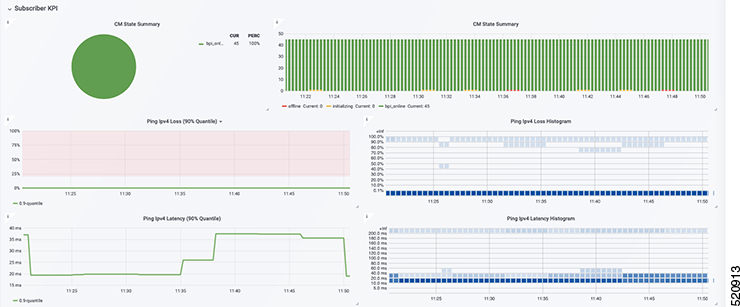
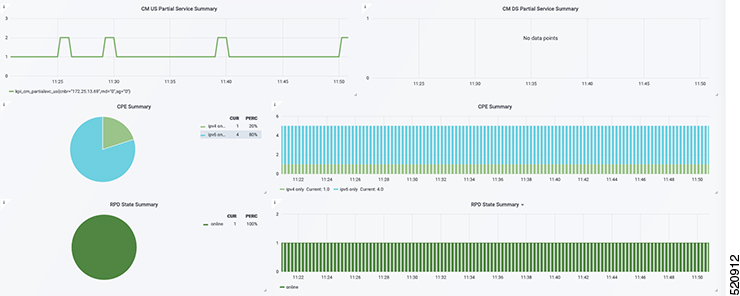
KPI - Subscriber details KPI - Subscriber details

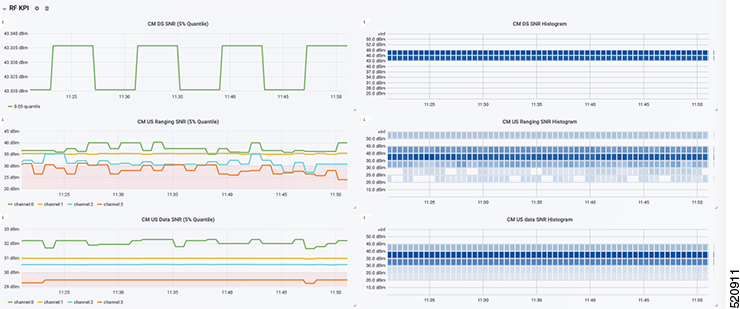
This dashboard shows the details of the RF.

KPI - RF details

Customize Kibana Queries and Data Visualization

The table lists the features, the Cisco cnBR version in which it was introduced, and also gives a short description of the feature.

Table 5. Feature History
Feature Name

Release Information

Feature Description

Customize Kibana Queries and Data Visualization

Cisco cnBR 21.2

You can create Kibana queries, retrieve data, and then customize how you want to present the queried data in Cisco cnBR.

To customize Kibana queries and data visualizations, use the following procedure:

  • Create index patterns

  • Discover data and save the query

  • Visualize data from the query

Create Index Patterns

Define the data for which you want to create the panel. Data is always generated from Elasticsearch indices. You can use an existing index or create a new one by providing a pattern.

Procedure


Step 1

From the Cisco Operations Hub main menu, click System > Logs.

Step 2

Click Advanced > Manage in the left navigation menu.

Step 3

Click Index Patterns link in the Kibana Management panel.

You can search and create a new pattern based on your requirement.

Step 4

Click Create index pattern.

Follow the index pattern creation window.


Discover Data

After you identify or create an Index pattern, discover the relevant data and clean it.

Procedure


Step 1

From the Cisco Operations Hub main menu, click System > Logs.

Step 2

Click Advanced > Discover in the left navigation menu.

The data query panel appears.

Step 3

Create search, add filters, and choose required data columns.

Step 4

Set up refresh intervals using the option in the top-right corner.

Step 5

After the data discovery, save the query with a valid name.

Next time when you view Advanced > Discover, this saved query appears.


Visualize Data from Query

After data discovery, you can present your data in different ways.

Procedure


Step 1

From the Cisco Operations Hub main menu, click System > Logs.

Step 2

Click Advanced > Visualize in the left navigation menu.

Step 3

Click Create visualization or search for an existing configuration.

Step 4

In the New Visualization window, choose a visualization type, and then configure and save them.

Next time when you view the Visualizations window, the saved visualizations appear in the Visualization window.


Log Aggregation and Management

The table lists the features, the Cisco cnBR version in which it was introduced, and also gives a short description of the feature.

Table 6. Feature History

Feature Name

Release Information

Feature Description

Log Aggregation and Management

Cisco cnBR 21.1

The Cisco Operations Hub provides multiple log aggregation tools, various visualization techniques, and customizations that help you to view, debug, visualize, and customize your log information. The Cisco Operations Hub enables Log Aggregation and Management through the Audit Dashboard, Debug Dashboard, and a host of other utilities.

The Cisco Operations Hub provides the Audit Dashboard, Debug Dashboard, and a host of other utilities for log aggregation and management activities.

By using the various visualization techniques and customizations, you can search, visualize, and create dashboards to have macro and micro views.

Configure Operations Hub for Log Management

The following configuration steps are needed only when the Cisco cnBR is added in Cisco Operations Hub using Cisco Operations Hub UI or API. You can skip this section if you added the Cisco cnBR using Autodeployer.

During deployment, the Cisco Operations Hub is preconfigured to collect logs from all the components. However, to send the logs to Cisco Operations Hub, you must manually configure Cisco cnBR.

To manually configure the Cisco cnBR to send the logs to Cisco Operations Hub, complete the following steps:

Procedure


Step 1

Log in to Cisco cnBR CEE Data OpsCenter CLI. Ensure that you provide a valid Cisco cnBR user ID and password.

https://cli.cee-data-ops-center.<cnBRIP>.nip.io

Step 2

Key in these commands at the prompt:


    logging fluent host fluentd.ccmts-infra
    logging fluent port 24224
    logging fluent disable-tls true
    commit
    end
Step 3

Log in to Cisco cnBR OpsCenter. Ensure that you provide a valid user ID and password.

https://cli.<cnBR NameSpace>-ops-center.<cnBRIP>.nip.io

Step 4

Key in these commands at the prompt:


    logging forward kafka-blockers <OpsHub_IP>
    commit
    end

Working with Logs

The Cisco Operations Hub provides you with a host of utilities that helps you to view, debug, visualize, and customise your log information.

View Audit Logs

The Audit dashboard leverages Kibana to provide meaningful visualization and a search interface for the raw log data.

You can view the Audit Logs dashboard by completing these steps:

Procedure

Step 1

Click Cisco Operations Hub > System > Logs.

Step 2

Click Audit Dashboard.

The Audit Dashboard provides the following information:

  • A visualization of the count of audit logs against time. You can view this as a histogram.

  • All user initiated events from UI or using API interface are logged and available as audit logs.

  • For every log file, the Audit Dashboard provides the following facets of information:

    • Time: The time of logging the event.

    • User: The user initiating the event.

    • API: The API call used.

    • Status: The HTTP response status code that returns when API was called.

    • Response Time: The time taken by the API to execute.

    • Method: The HTTP method the API used.

    • Service Host: The application that served the request.


View Debug Logs

You can view the Debug logs dashboard by completing these steps:

Procedure

Step 1

Click Cisco Operations Hub > System > Logs.

Step 2

Click Debug Dashboard.

The Debug Dashboard provides the following information:

  • A visualisation of the count of logs from different components against time is provided as a histogram.

  • All internal application events logged by respective services or software components are captured as debug logs.

  • For every log file, the Debug Dashboard provides the following facets of information:

    • Time: The time of logging the event.

    • Source: The application where the event happened.

    • ContainerName: The applications microservice that generated the event.

    • LogLevel: The log level.

    • Message: The entire log content.


Discover Logs

The Discover option allows you to search and find logs based on custom search definitions.

You can view the Discover option by completing these steps:

Procedure

Step 1

Enter the Cisco Operations Hub URL https://{Hostname} in the web browser.

Step 2

On the Cisco Operations Hub, click the Cisco Operations Hub main menu button.

Step 3

Choose System > Logs to open Logs page.

Step 4

Click Advanced > Discover from the left navigation menu.

Step 5

Search for the log files.

You can perform basic text search, or advanced search by using KQL (Kibana Query Language) or Lucene search. Alternatively, you can also customize your search query based on time, debug-log type, selected fields, inspect option, and so on.

You can choose to save the search for later use from the dashboard.


Visualize Logs

You can create intuitive visualizations for your log data.

To create a visualization, complete these steps:

Procedure

Step 1

Enter the Cisco Operations Hub URL https://{Hostname} in the web browser.

Step 2

On the Cisco Operations Hub, click the Cisco Operations Hub main menu button.

Step 3

Choose System > Logs to open Logs page.

Step 4

Click Advanced > Visualize from the left navigation menu.

Step 5

Click Create visualisation.

Step 6

Choose one of these visualization type:

  • Area

  • Control

  • Coordinate Map

  • Data Table

  • Gauge

  • Goal

  • Heat Map

  • Horizontal Bar

  • Line

  • Markdown

  • Metric

  • Pie

  • Region Map

  • TSVB

  • Tag Cloud

  • Timelion

  • Vega

  • Vertical Bar

Step 7

Choose a source type. You can choose from audit-log, debug-log, or logstash objects.

You can choose to save the visualizations to generate panels when you Create Dashboards.


Create Dashboards

The Dashboard option allows you to create a new dashboard by adding panels from the saved Discover Logs option or Visualize Logs option. You can also create a new Dashboard from scratch.

Complete these steps to create a Dashboard:

Procedure

Step 1

Click Cisco Operations Hub > System > Logs.

Step 2

Click Dashboard > Create dashboard.

Step 3

Click Add.

Step 4

On the Add panels menu, select the required searched and saved logs and visualizations.

Step 5

You can choose to change existing filters or add filters.

Step 6

Click Create new to choose a visualization type. You can choose from these visualization types:

  • Area

  • Control

  • Coordinate Map

  • Data Table

  • Gauge

  • Goal

  • Heat Map

  • Horizontal Bar

  • Line

  • Markdown

  • Metric

  • Pie

  • Region Map

  • TSVB

  • Tag Cloud

  • Timelion

  • Vega

  • Vertical Bar

Step 7

Choose a source type. You can choose from audit-log, debug-log, or logstash objects.

You can view the saved dashboards on the dashboard list.


Manage Indices and Objects

The Management option allows you to manage your indices and index patterns, list your saved objects, and enables you to customize the logs with advanced options.

Complete these steps to use the Management option:

Procedure

Step 1

Enter the Cisco Operations Hub URL https://{Hostname} in the web browser.

Step 2

On the Cisco Operations Hub, click the Cisco Operations Hub main menu button.

Step 3

Choose System > Logs to open Logs page.

Step 4

Click Advanced > Manage from the left navigation menu.

You can choose from these tools:

  • Index Patterns: Lists all available patterns. The list includes all fields for the selected pattern and the field's associated core type as recorded by Elasticsearch.

  • Saved Objects: Lists all saved objects. You can choose to delete saved objects and saved searches. You can also edit the raw data of saved objects.

  • Advanced Settings: These are advanced settings, and must be handled with caution. For more detailed information, go through Kibana Advanced Settings.