Alert Record
The Alert Management Dashboard captures all alerts that are generated in the Cisco Operations Hub cluster. This dashboard displays alert summary and detailed information about those alerts.
The documentation set for this product strives to use bias-free language. For the purposes of this documentation set, bias-free is defined as language that does not imply discrimination based on age, disability, gender, racial identity, ethnic identity, sexual orientation, socioeconomic status, and intersectionality. Exceptions may be present in the documentation due to language that is hardcoded in the user interfaces of the product software, language used based on RFP documentation, or language that is used by a referenced third-party product. Learn more about how Cisco is using Inclusive Language.
All alerts are built based on the KPI metrics and divided into several alert groups. Each KPI metric generates one alert that belongs to a predefined alert group.
The Alert Management Dashboard captures all alerts that are generated in the Cisco Operations Hub cluster. This dashboard displays alert summary and detailed information about those alerts.
The Alerts page displays a summary of total number of firing, pending, and warning alerts based on alert severity. You can access the alert overview page from the main menu.
At the main menu, select Alerts. The Alerts page appears.
View Alert Summary.
Cisco Operations Hub supports the following alert severity:
Critical
Major
Minor
Warning

You can view a list of firing alerts that are currently active and a list of resolved alerts. At the main menu, select Alerts to view the alerts.
Alerts Summary Total count of firing, pending and resolved alerts. Count of alerts are based on severity.
You can filter alerts on any of the following conditions:
| Filter condition | Description | Options |
|---|---|---|
| Focus filter | List of Alert categories | Cluster (default), Operations Hub Infrastructure, DB Upgrade, Internal User Password Expiration, System |
| Date Range | Filter alerts in a specific time window | All Time (default), Last 7 days, Last 24 hours |
| Acknowledged | Filter using acknowledgement status | Yes, No |
| Status | Status of an alert | Firing (default), Pending, Resolved |
| Severity | Severity of the alerts | Critical, Major, Minor, Warning |
| Field | Description | Options |
|---|---|---|
| Date | Date and Time when the alert is fired | Date and Time |
| Acknowledged | Shows whether an alert is acknowledged or not | Yes, No |
| Status | Status of the alert | Firing, Pending, Resolved |
| Severity | Severity of the alert | Critical, Major, Minor, Warning |
| Alert Category | Category of the alert | Cluster, OperationsHubInfra, DbUpgrade, InternalUserPasswordExpiry, System |
| Type | Type of the alert | High CPU, High Memory |
| Pod | Details of the pod generating an alert | Pod-Details |
| Container | Details of the container generating an alert | Container-Details |
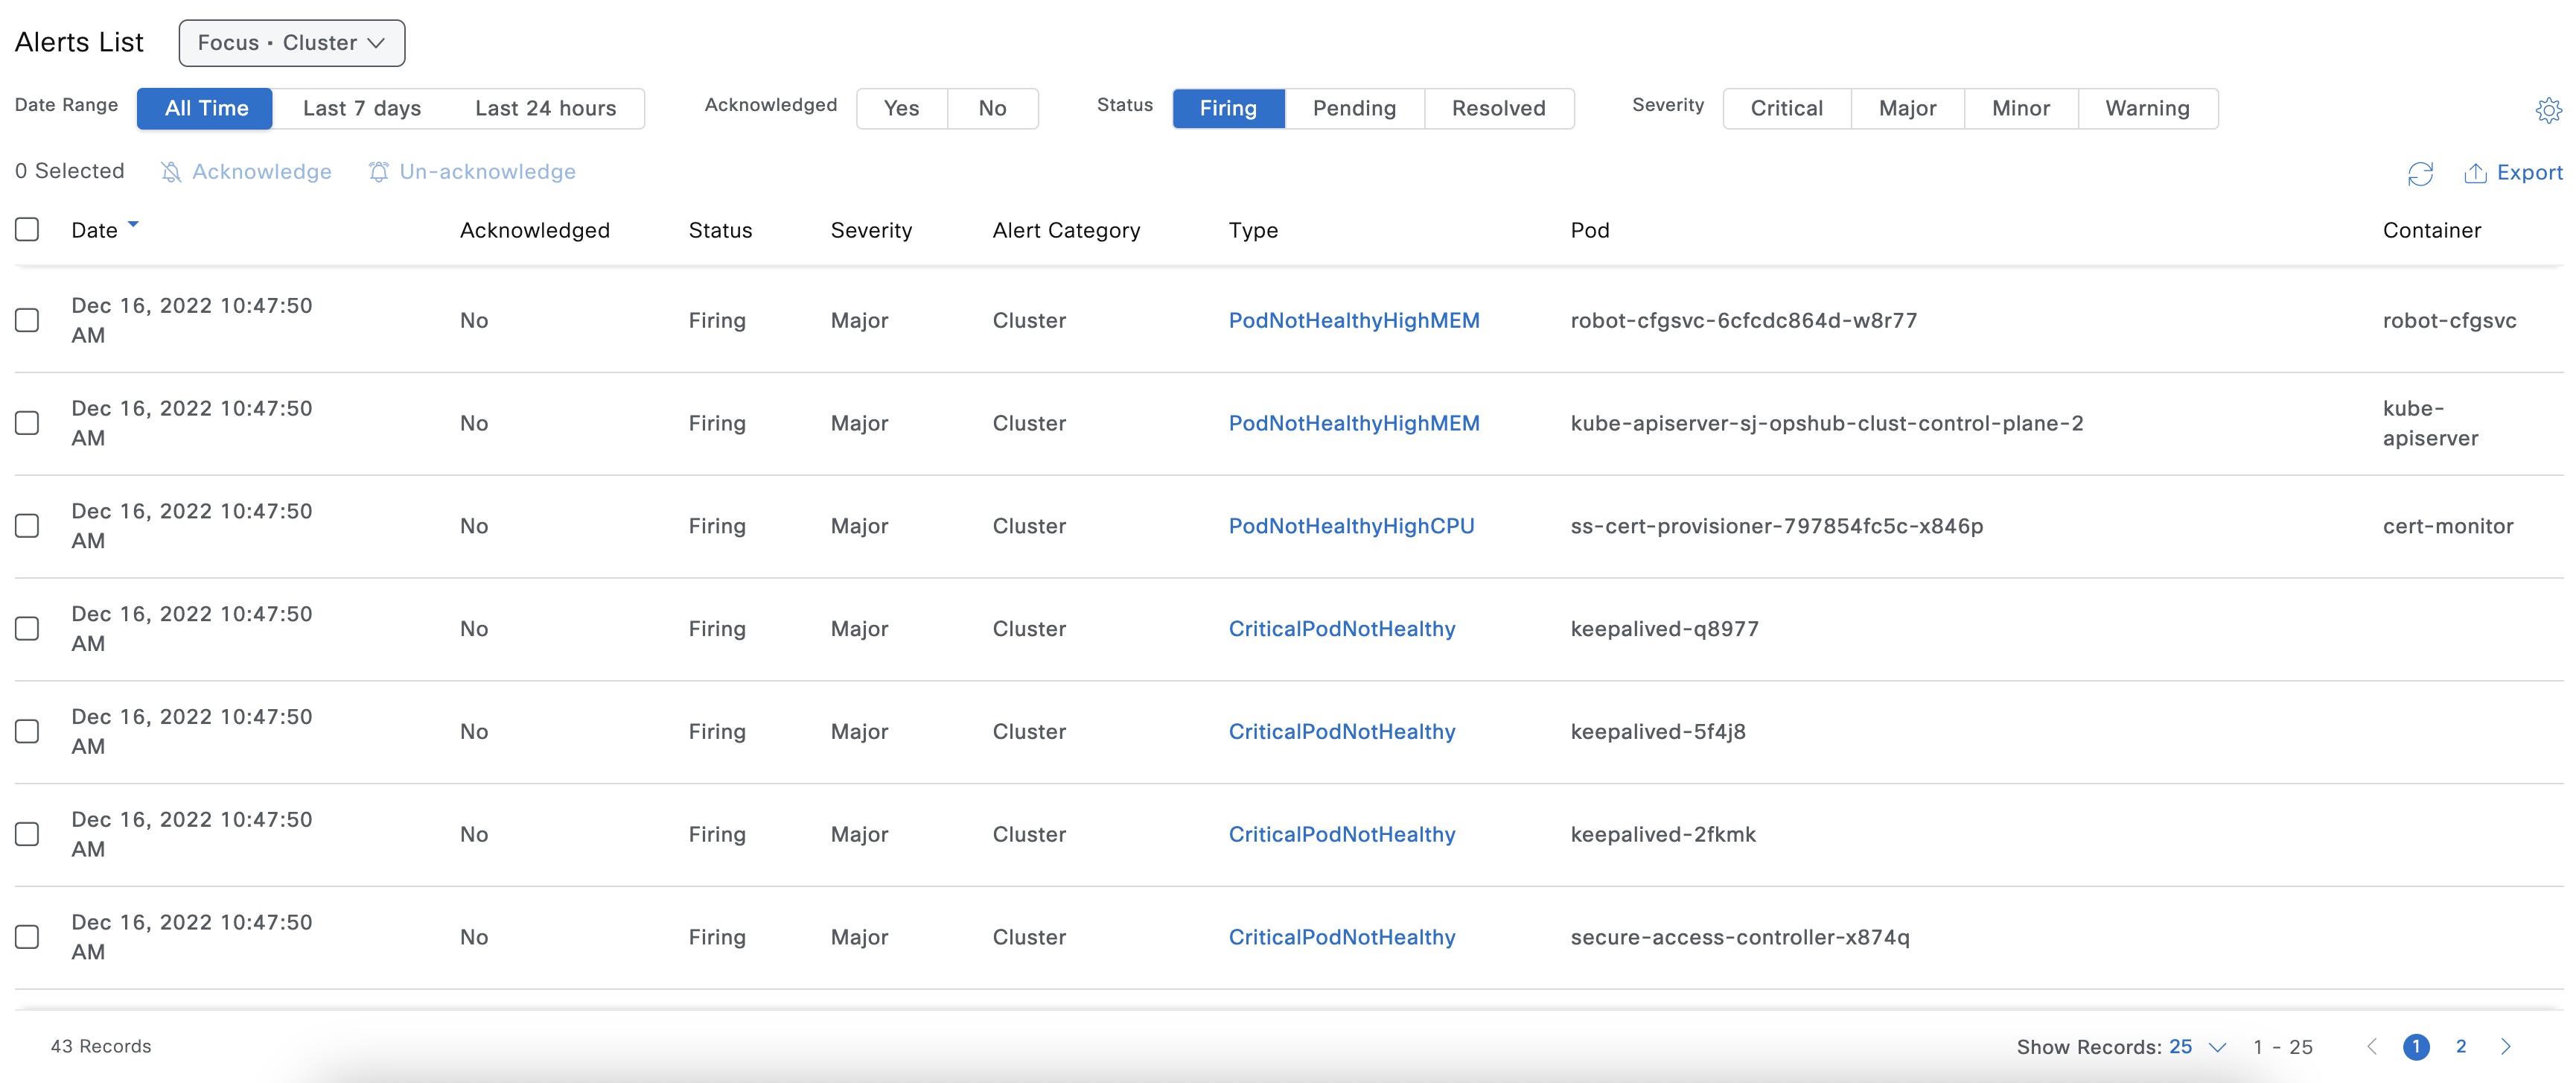
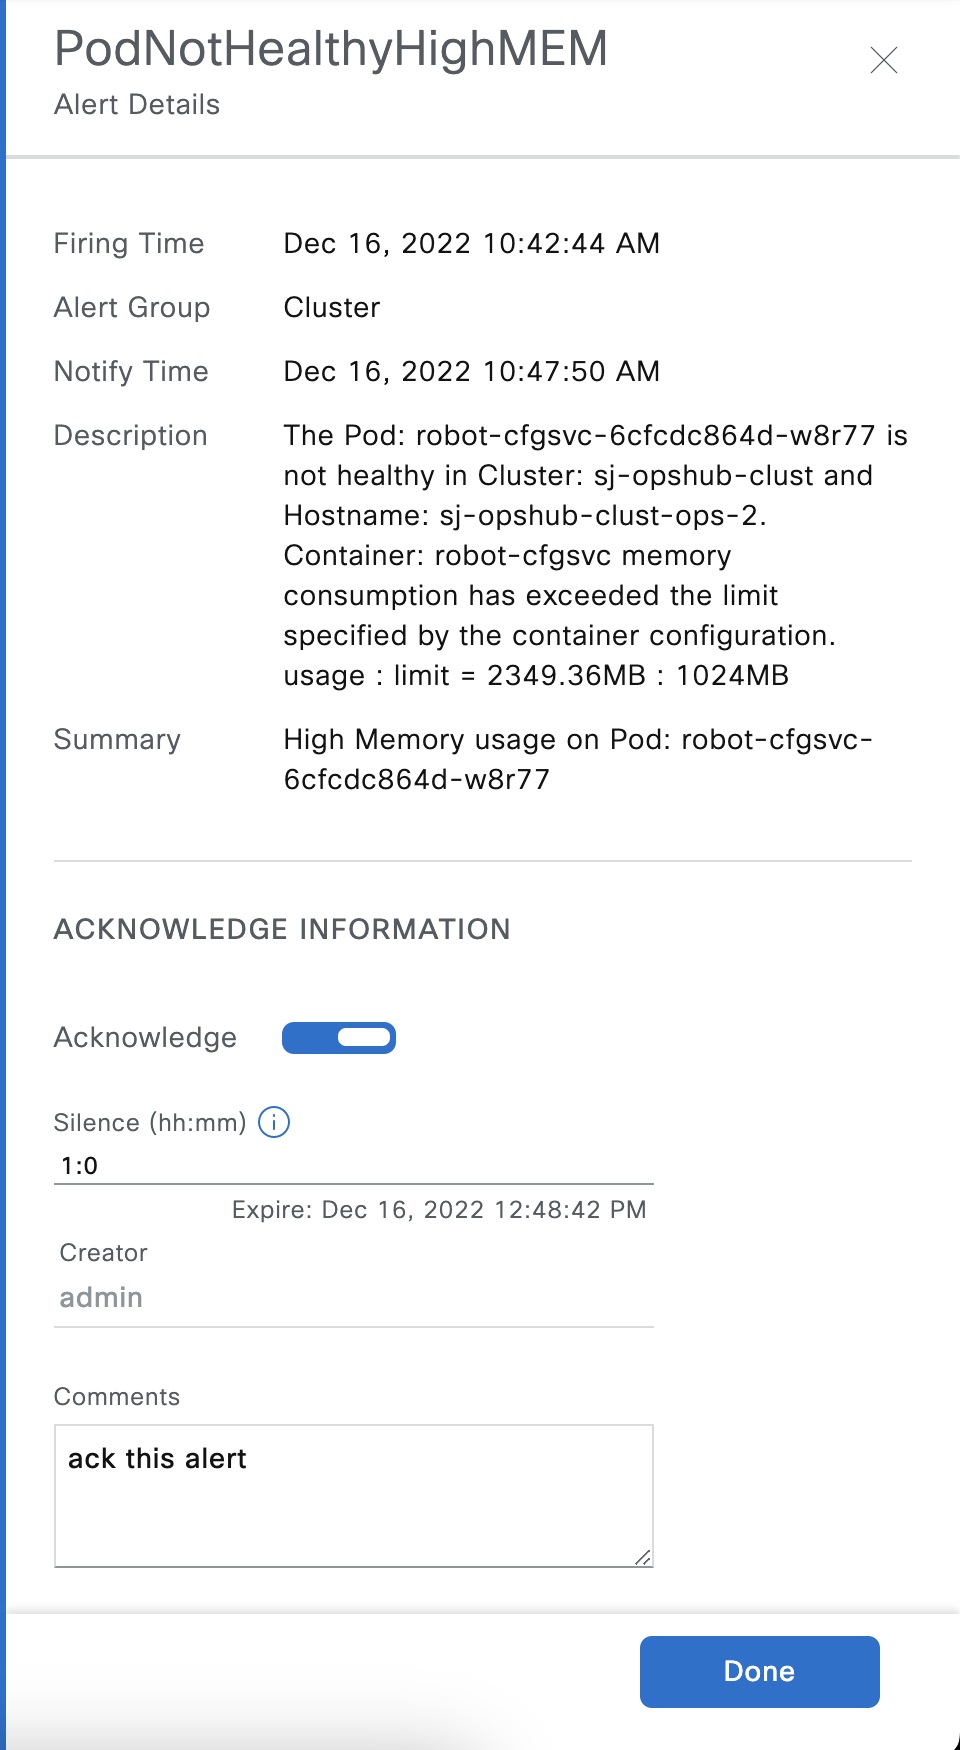
You can view the details of an alert by clicking the Alert Type. The alert details panel captures the following fields:
| Field | Description |
|---|---|
| Status | Status of the alert |
| Firing Time | Time when alert is raised |
| Alert Category | Category of the alert |
| Notify Time | Displays alert notify time |
| Description | Description of the alert |
| Summary | A short summary of the alert |

Once an alert is raised, you can acknowledge the firing alert. You have an option to put a comment before you acknowledge. You can also silence alerts for a predefined time in case you wish to ignore the alert during that time. By default, every three hours you are notified about the firing alerts by email.
Operations Hub is capable of sending notification emails when alerts are triggered. Administrators can customize the outbound SMTP configuration and enable or disable notifications for specific alert categories from the Operations Hub Web UI or API.
Alert categories include: Cluster, Operations Hub Infrastructure, DB Upgrade, Internal User Password Expiration, and System.
When notifications are enabled for a particular alert category, every time an alert in that category is triggered, the email addresses configured in that categories’ notification recipient list are sent a notification email.
Enabling Email Notifications consists of four steps:
Switching on Email Notifications
Configuring SMTP
Choosing Alert Categories and Recipients
Saving your Configuration
Use this procedure to switch on Email Notifications.
At the main menu, select System > Email Notifications.
Click Edit at the bottom right of the page.
Locate the switch labeled Email Notifications and toggle it on.
Click Save.
 Note |
Even though Email Notifications have been switched on, notifications won’t be sent until you complete the SMTP configuration, choose your Alert Categories & Recipients, and save your configuration. |
Use this procedure to specify or change the email address, SMTP server hostname, and port number Operations Hub uses to send notification emails.
Before you begin, make sure that Email Notifications are switched on.
At the main menu, select System > Email Notifications.
Click Edit at the bottom right of the page.
Locate the SMTP Configuration card.
Enter the SMTP configuration details.
| Field | Description |
|---|---|
| From Email Address | Operations Hub uses this email address as its From address when sending email notifications. |
| SMTP Server Hostname | Operations Hub uses this SMTP server to send email notifications. |
| SMTP Server Port Number (Optional) | By default, Operations Hub uses port 25 to connect to the specified SMTP server. You can optionally enter a different port number. |
Click Save.
Use this procedure to enable or disable notifications for one or more alert categories and to add or remove email addresses from a categories’ notification recipient list.
Before you begin, make sure that Email Notifications are switched on, and your SMTP Configuration is completed.
At the main menu, select System > Email Notifications.
Click Edit at the bottom right of the page.
Locate the Alert Categories card.
Enable the switch next to an Alert Category name to turn on notifications for that category or disable the switch to turn off notifications.
Click the Alert Category name to open its Notification Recipient List panel.
Add or remove email addresses.
Click Save, to save your email addresses and close the panel.
Note |
You must save your configuration to complete the enablement of email notifications. |
Use this procedure to save your SMTP configuration, Alert Category & Recipients choices, and enable email notifications.
From the Email Notifications page, click Save at the bottom of the page.


| Feature Name | Release Information | Description |
|---|---|---|
| Cluster Health Monitoring | Cisco Operations Hub 22.2 | Cisco Operations Hub supports viewing and monitoring of the cluster health using the alert management feature. An alert is raised when there is an issue and you can take necessary action based on the severity of the alert. You can view the cluster health information using the Kubernetes Cluster Health dashboard. |
| Alert UI | Cisco Operations Hub, Release 22.4 | Alert UI is introduced. |
Operations Hub enables you to view and monitor the cluster health using the alert management feature. For each cluster, you can map an alert-group to check the cluster health status and take required action. Each alert is categorized based on severity which helps you prioritize the action for taken for that alert. If you do not specify any alert-group for the cluster, then all available alert-groups are added to the cluster
A cluster can have the following types of health alerts:
Clear - Indicates that the cluster has no alerts and everything is working as expected.
Minor - Indicates that a few nonessential pods are not running in the cluster. If you see this alert, then rectify the problem at the earliest.
Critical - Indicates that the cluster has critical problems. Take immediate action before the service degrades further.
Each alert-group is independent in nature, and therefore it is important to review all the alert-groups. Ensure that you take corrective actions that are based on the overall cluster health and not just for an individual alert-group.
For example, an essential pod such as timescaledb can have high CPU usage, which causes it to raise a Critical alert. This is part of the Cluster alert-group for which the cluster health severity is Critical.
Similarly, if there are no critical alerts for the InternalUserPasswordExpiry alert-group and all the pods are running in the cluster, then the cluster health severity is Clear.
For more information regarding Operations Hub Infra Alert Management API, see Cisco Operations Hub and Smart PHY REST API Guide
At the main menu, choose Dashboards. The Dashboard Gallery page appears.
Click Kubernetes Cluster Health.
The Kubernetes Cluster Health dashboard displays.
At the main menu, select Alerts .
The Alerts page displays.
 Feedback