Introduction
This document describes how to troubleshoot sessmgr or aaamgr which are in "warn" or "over" state.
Overview
Session Manager (Sessmgr) - Is a subscriber processing system that supports multiple session types and is responsible for handling subscriber transactions. Sessmgr is typically paired with AAAManagers.
Authorization, Authentication, and Accounting Manager (Aaamgr) - Is responsible for performing all AAA protocol operations and functions for subscribers and administrative users within the system.
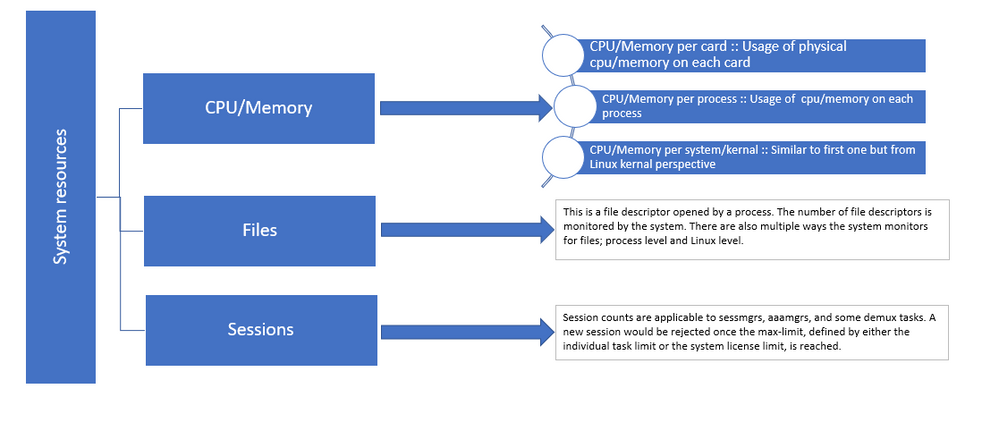
 Figure 1 :: Staros resources distribution
Logs/Basic Checks
Basic Checks
To gather more details about the issue, you need to verify this information with the user:
- How long has the sessmgr/aaamgr been in the "warn" or "over" state?
- How many sessmgrs/aaamgrs are affected by this issue?
- You need to confirm if the sessmgr/aaamgr is in the "warn" or "over" state due to memory or CPU.
- You also need to check if there has been a sudden increase in traffic, which can be assessed by examining the number of sessions per sessmgr.
By obtaining this information, you can better understand and address the issue at hand.
Logs
-
Obtain Show Support Details (SSD) and syslogs capturing the problematic timestamp. It is recommended to collect these logs at least 2 hours prior to the issue onset to identify the trigger point.
-
Capture corefiles for both problematic and non-problematic sessmgr/aaamgr. More information about this can be found in the Analysis section.
Analysis
Step 1. To check the status of affected sessmgr/aaamgr by commands.
show task resources         -
--------- to check detail of sessmgr/aamgr into warn/over state and from the same you also get to know current memory/cpu utlization

Output ::

******** show task resources *******
Monday May 29 08:30:54 IST 2023
     task          cputime      memory         files      sessions
cpu facility inst used  alloc used alloc    used allc    used allc   S   status
----------------------- ----------- ------------- --------- ------------- ------
2/0 sessmgr  297  6.48% 100% 604.8M 900.0M  210 500     1651 12000   I     good
2/0 sessmgr  300  5.66% 100% 603.0M 900.0M  224 500     1652 12000   I     good
2/1 aaamgr   155  0.90% 95%  96.39M 260.0M   21 500     -- --        -     good
2/1 aaamgr   170  0.89% 95%  96.46M 260.0M   21 500     -- --        -     good

Note: The number of sessions per sessmgr can be checked by this command as shown in the command output.
Both these commands help in checking the maximum memory usage since the node has been reloaded:
show task resources max
show task memory max

 ******** show task memory max *******
Monday May 29 08:30:53 IST 2023
             task   heap     physical                     virtual
cpu facility inst   max          max     alloc           max    alloc status
----------------------- ------ ------------------ ------------------ ------
2/0 sessmgr  902   548.6M   66% 602.6M  900.0M     29%  1.19G    4.00G good
2/0 aaamgr   913   68.06M   38% 99.11M  260.0M     17%  713.0M   4.00G good

Note: The memory max command gives the maximum memory utilized since the node reloads. This command helps us identify any patterns related to the issue, such as if the issue started after a recent reload or if there has been a recent reload that allows us to check the maximum memory value. On the other hand, "show task resources" and "show task resources max" provide similar outputs, with the distinction that the max command displays the maximum values of memory, CPU, and sessions utilized by a specific sessmgr/aaamgr since the reload.
show subscriber summary apn <apn name> smgr-instance <instance ID> | grep Total

-------------- to check no of subscribers for that particular APN in sessmg
Action Plan
Scenario 1. Due to High Memory Utilization
1. Collect SSD before restarting/killing the sessmgr instance.
2. Collect the core dump for any of the affected sessmgr.
task core facility sessmgr instance <instance-value>
3. Collect the heap output using these commands in the hidden mode for the same affected sessmgr and aaamgr.
show session subsystem facility sessmgr instance <instance-value> debug-info verbose
show task resources facility sessmgr instance <instance-value>

Heap outputs:

show messenger proclet facility sessmgr instance <instance-value> heap depth 9
show messenger proclet facility sessmgr instance <instance-value> system heap depth 9
show messenger proclet facility sessmgr instance <instance-value> heap
show messenger proclet facility sessmgr instance <instance-value> system

show snx sessmgr instance <instance-value> memory ldbuf
show snx sessmgr instance <instance-value> memory mblk
4. Restart the sessmgr task using this command:
task kill facility sessmgr instance <instance-value>

Caution: If there are multiple sessmgrs in the "warn" or "over" state, it is recommended to restart the sessmgrs with an interval of 2 to 5 minutes. Start by restarting only 2 to 3 sessmgrs initially, and then wait for up to 10 to 15 minutes to observe if those sessmgrs return to normal state. This step helps in assessing the impact of the restart and monitoring the recovery progress.
5. Check the status of the sessmgr.
show task resources facility sessmgr instance <instance-value> -------- to check if sessmgr is back in good state
6. Collect another SSD.
7. Collect the output of all CLI commands mentioned in Step 3.
8. Collect the core dump for any of the healthy sessmgr instances using the command mentioned in Step 2.

Note: To obtain corefiles for both problematic and non-problematic facilities, you have two options. One, you can collect the corefile of the same sessmgr after it returns to normal after a restart. Alternatively, you can capture the corefile from a different healthy sessmgr. Both these approaches provide valuable information for analysis and troubleshooting.
Once you collect the heap outputs, please contact Cisco TAC to find the exact heap consumption table.
From these heap outputs, you need to check the function which is utilizing more memory. Based on this, TAC investigates the intended purpose of function utilization and determines if its usage aligns with the increased traffic/transaction volume or any other problematic reason.
Heap outputs can be sorted by using a tool accessed by the link given as Memory-CPU-data-sorting-tool.

Note: Here in this tool, there are multiple options for different facilities. However, you need to select "Heap consumption table" where you upload heap outputs and run the tool to get the output in a sorted format.
Scenario 2. Due to High CPU Utilization
1. Collect SSD before restarting or killing the sessmgr instance.
2. Collect the core dump for any of the affected sessmgr.
task core facility sessmgr instance <instance-value>
3. Collect the heap output of these commands in the hidden mode for the same affected sessmgr/aamgr.
show session subsystem facility sessmgr instance <instance-value> debug-info verbose
show task resources facility sessmgr instance <instance-value>
show cpu table
show cpu utilization

show cpu info ------ Display detailed info of CPU.
show cpu info verbose ------ More detailed version of the above

Profiler output for CPU

This is the background cpu profiler. This command allows checking which functions consume
the most CPU time. This command requires CLI test command password.

show profile facility <facility instance> instance <instance ID> depth 4
show profile facility <facility instance> active facility <facility instance> depth 8
4. Restart the sessmgr task with this command:
task kill facility sessmgr instance <instance-value>
5. Check the status of the sessmgr.
show task resources facility sessmgr instance <instance-value> -------- to check if sessmgr is back in good state
6. Collect another SSD.
7. Collect the output of all CLI commands mentioned in Step 3.
8. Collect the core dump for any of the healthy sessmgr instances using the command mentioned in Step 2.
To analyze both high memory and CPU scenarios, please examine bulkstats to determine if there is a legitimate increase in traffic trends.
Additionally, verify bulkstats for Card/CPU level statistics.


 Feedback