Introduction
This document describes how to troubleshoot S11 Key Performance Indicators (KPI) degradation issues.
Overview
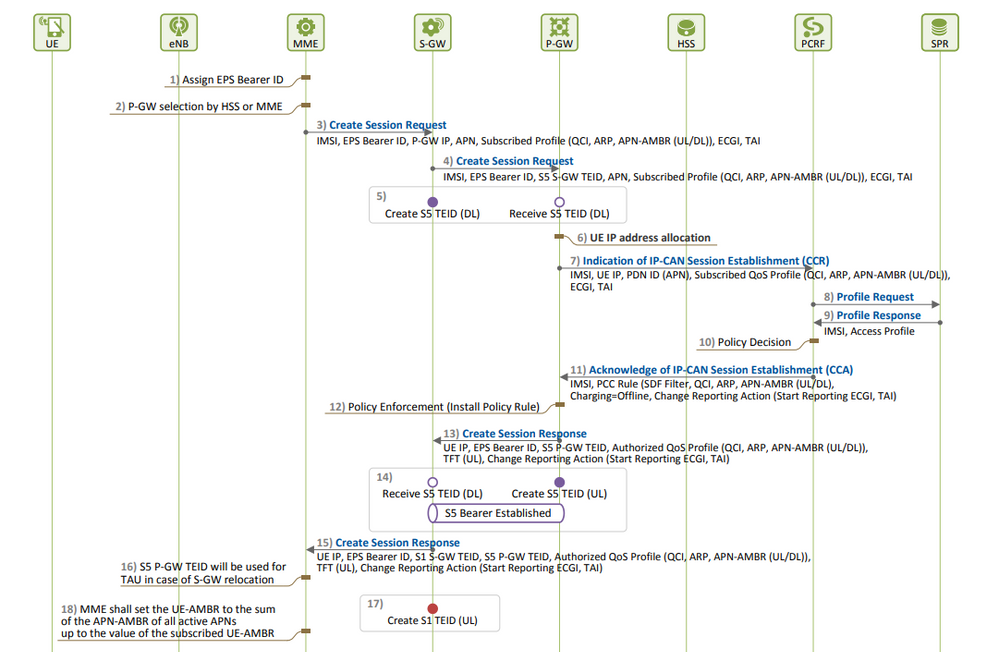
S11 is the interface that connects the Mobility Management Entity (MME) and the Serving Gateway (SGW) in a Long Term Evolution (LTE) network. The interface utilizes the Gn or GPRS Tunnelling Protocol-Control (GTP-C).
Messages in the S11 Interface
- Create Session Request/Response
- Modify Session Request/Response
- Delete Session Request/Response

EPS Session Establishment:
- S11 KPI degradation is observed when you see more Create Session Requests (CSR) rejections as compared to its CSR attempts, which has to be the root cause.
You can know the formula used to measure the KPI and make a note of all the counters which are included in the formula and determine the exact counter responsible for degradation.
S11 ASR (SPGW)  = ((tun-sent-cresessrespaccept+ggsn_tun-sent-cresessrespdeniedUserAuthFailed+tun-sent-cresessrespdeniedPrefPdnTypeUnsupported+tun-sent-cresessrespdeniedCtxtNotFound)/EGTPC-ggsn_tun-recv-cresess)*100

PDN Connectivity Success Rate (MME) : ((%esmevent-pdncon-success%) + (%esm-msgtx-pdncon-rej%))*) / (%esmevent-pdncon-attempt%) *100)

Note: Formula can vary based on the way it is measured.
Logs Required at Initial Level:
- KPI trend depicting the degradation.
- KPI formula utilized.
-
Raw bulkstat counters and cause code trends from the beginning of the issue.
- Capture two instances of Show Support Details (SSDs) from the node at a 30-minute interval during problematic periods.
- Syslogs ranged from two hours before the degradation occurred up until the current time.
mon sub/pro traces and logging monitor msid <imsi> .
Troubleshooting Sequence
-
Evaluate the KPI trend of each counter involved in the S11 KPI formula by analyzing the bulkstats.
-
Compare the KPI trend during problematic timelines with non-problematic timelines.
-
Examine how the identified problematic bulkstat counter is defined based on flow and establish any patterns.
-
Collect disconnect reasons from the node through multiple iterations at intervals of 3 to 5 minutes.
You can analyze the delta of disconnect reasons between two SSDs collected at different timestamps. The disconnect reason that shows a significant increase in the delta value can be considered the cause of KPI degradation. For detailed descriptions of all disconnect reasons, refer to the Cisco Statistics and Counters Reference here: https://www.cisco.com/c/en/us/td/docs/wireless/asr_5000/21-23/Stat-Count-Reference/21-23-show-comman...
show session disconnect-reasons verbose
5. Check egtp statistics based on the type of node it is taken on:
--- SGW end -----

show egtpc statistics interface sgw-ingress path-failure-reasons
show egtpc statistics interface sgw-ingress summary
show egtpc statistics interface sgw-ingress verbose
show egtpc statistics interface sgw-ingress sessmgr-only

show egtpc statistics interface sgw-egress path-failure-reasons
show egtpc statistics interface sgw-egress summary
show egtpc statistics interface sgw-egress verbose
show egtpc statistics interface sgw-egress sessmgr-only

---- PGW end -----

show egtpc statistics interface pgw-ingress path-failure-reasons
show egtpc statistics interface sgw-ingress summary
show egtpc statistics interface sgw-ingress verbose
show egtpc statistics interface sgw-ingress sessmgr-only

--- MME end -----

show egtpc statistics interface mme path-failure-reasons
show egtpc statistics interface mme summary
show egtpc statistics interface mme verbose
show egtpc statistics interface mme sessmgr-only
6. Once you have identified the specific counter causing the problem, you must capture mon-sub/mon-pro call traces to further analyze and identify the specific call flow that is causing the KPI degradation. Additionally, you can use external tools to obtain Wireshark traces for more detailed analysis.
Commands to capture Mon sub-traces are as follows:
monitor subscriber with options 19, 26,33, 34, 35, 49,A,S, X, Y, verbosity +5 during the issue.

mon-pro with options 19, 26,33, 34, 35, 49,A,S, X, Y, verbosity +5 during the issue if no mon-sub is present.

More options can be enabled depending on the protocol or call flow we need to capture specifically
In cases where capturing traces like mon-sub is not feasible due to a minimal percentage of KPI degradation, you must capture system-level debug logs instead. This involves capturing debug logs for sessmgr and egptc, and if necessary, capturing gateway-specific flows.
logging filter active facility sessmgr level debug
logging filter active facility egtpc level debug
logging filter active facility sgw level debug
logging filter active facility pgw level debug

logging active ----------------- to enable
no logging active ------------- to disable

Note :: Debugging logs can increase CPU utilization so need to keep a watch while executing debugging logs
7. After analyzing the debug logs, if you determine the cause of the issue, you can proceed to capture the core file for that specific event where you observe the error logs.
logging enable-debug facility sessmgr instance <instance-ID> eventid 11176 line-number 3219 collect-cores 1

For example  :: consider we are getting below error log in debug logs which we suspect can be a cause of issue
and we don;t have any call trace

[egtpc 141027 info] [15/0/6045 <sessmgr:93> _handler_func.c:10068] [context: INLAND_PTL_MME01, contextID: 6] [software internal user syslog] [mme-egress] Sending reject response for the message EGTP_MSG_UPDATE_BEARER_REQUEST with cause EGTP_CAUSE_NO_RESOURCES_AVAILABLE to <Host:x.x.x.x, Port:31456, seq_num:82011>

So in this error event

facility :: sessmgr
event ID = 141027
line number = 10068

Warning: Whenever requesting the collection of logs such as debug logs, logging monitor, mon-sub, or mon-pro, it is important to ensure that these logs are collected during a maintenance window. Additionally, it is crucial to monitor the CPU load during this time.
Analysis and Identification of Symptoms
- First, check if any frequent crashes are observed in the system from SSD.
show crash list
- Please verify if any license issues have been encountered. In some cases, when the license at the Serving Packet Data Gateway (SPGW) is expired, it can no longer accept new calls, resulting in failed calls and leading to S11 degradation or dip.
show resource info
- Please verify if there are multiple sessmgr instances in a warn/over the state due to high memory or CPU usage. If such instances are found, check if new calls are being rejected because of these conditions.
- From the debug logs, you can check on which interface, you get the call rejection errors.
If a significant number of call rejection errors occur for a specific subscriber in the "sgw-egress" context, followed by the same subscriber being rejected in the "sgw-ingress" context, it can be inferred that the rejections from the Packet Data Gateway (PGW) are sent to SGW-> MME in the S11 context. To confirm and troubleshoot further from the PGW end, you can now take a mon-sub for this IMSI.
2022-Nov-26+00:20:51.763 [egtpc 141018 unusual] [7/0/16871 <sessmgr:579> _handler_func.c:3227] [context: gwctx, contextID: 2]  [software internal user syslog] [sgw-egress] For IMSI: 427021600263284, create session request is rejected by the peer with cause EGTP_CAUSE_NO_RESOURCES_AVAILABLE

2022-Nov-26+00:20:51.763 [egtpc 141018 unusual] [7/0/16871 <sessmgr:579> _handler_func.c:2505] [context: gwctx, contextID: 2]  [software internal user syslog] [sgw-ingress] For IMSI: 427021600263284, create session request is rejected by the SAP user with cause EGTPC_REASON_UNKNOWN
- Sometimes there can be multiple rejection reasons for the KPI dip, so you need to check for each reason separately and proceed accordingly.
For example, there can be no_resource_available/user_auth_failure error increase for certain International Mobile Subscriber Identity (IMSI) series, which is for in-roamer subscribers, so these need to be checked from PGW. There could be a reason like remote peer not responding and create a session request getting timed out at SGW and this can cause degradation in S11 KPI. This create session could be rejected as No_resource_available from SGW towards MME. These reject cause codes can be observed from the monitor protocol logs and you can check the Create Session Request and Create Session Responses to identify the specific IP addresses from where these reject cause codes are sent.


 Feedback