Introduction
This document describes a structured approach to troubleshoot and resolve high CPU utilization to the SNMP process on a 9800 Wireless Lan Controller.
Components Used
The information in this document is based on these software and hardware versions:
- Wireless controller: C9800-80-K9 running 17.09.03
The information in this document was created from the devices in a specific lab environment. All of the devices used in this document started with a cleared (default) configuration. If your network is live, ensure that you understand the potential impact of any command.
Log collection
Identifying CPU Utilization Patterns Upon receiving a report of high CPU utilization linked to the SNMP process, the first course of action is to collect detailed logs over a specified timeframe. This is going to help in establishing a pattern or trend in CPU usage, which is essential for pinpointing the times when the SNMP process is most active and resource-intensive.
Before commencing the log collection, it is imperative to gather specific information that is used to support the troubleshooting process. Start by collect few information regarding the issue.
- Is the system experiencing spikes or consistently high usage?
- What is the % of utilization in either case?
- What is the frequency of high CPU utilization?
- How frequent each SNMP server is polling the WLC?
- Who are the top talkers?
Collect the command output from 9800 WLC at two-minute intervals over a span of ten minutes. This data can be used to analyze high CPU utilization issues, particularly those related to the SNMP process.
#terminal length 0
#show clock
#show process cpu sorted | exclude 0.0
#show process cpu history
#show processes cpu platform sorted | exclude 0.0
#show snmp stats oid
#show snmp stats hosts
Logs analysis
After collecting these logs, you must analyze them to understand the impact.
Let us look at a sample CPU utilization logs and identify the SNMP process that is consuming the most CPU.
WLC#show process cpu sorted | exclude 0.0
CPU utilization for five seconds: 96%/7%; one minute: 76%; five minutes: 61%
 PID Runtime(ms)     Invoked      uSecs   5Sec   1Min   5Min TTY Process
 250   621290375    58215467      10672 58.34% 39.84% 34.11%   0 SNMP LA Cache pr  <-- High utilization
  93   167960640   401289855        418 14.50% 11.88%  9.23%   0 IOSD ipc task
 739   141604259   102242639       1384  8.57%  6.95%  7.21%   0 SNMP ENGINE
 763        7752       34896        222  4.00%  3.41%  1.83%   5 SSH Process
 648     6216707   181047548         34  0.72%  0.37%  0.31%   0 IP SNMP
 376     3439332    51690423         66  0.40%  0.36%  0.25%   0 SNMP Timers
 143     3855538   107654825         35  0.40%  0.35%  0.23%   0 IOSXE-RP Punt Se
 108     6139618    17345934        353  0.40%  0.30%  0.34%   0 DBAL EVENTS
The output from the show process cpu sorted | exclude 0.0 command indicates that the SNMP process is indeed consuming a disproportionate amount of CPU resources. Specifically, the SNMP LA Cache pr process is the most CPU-intensive, followed by other SNMP-related processes.
The next set of commands is going to help us drill down into the SNMP high utilization process.
WLC#show snmp stats oid

time-stamp               #of times requested             OID
11:02:33 Austral Jun 8 2023      27698                   bsnAPIfDBNoisePower  <-- Frequently polled OID
11:02:23 Austral Jun 8 2023      1                       sysUpTime
11:02:23 Austral Jun 8 2023      17                      cLSiD11SpectrumIntelligenceEnable
11:02:23 Austral Jun 8 2023      1                       cLSiD11SpectrumIntelligenceEnable
11:02:23 Austral Jun 8 2023      6                       cLSiD11Band
11:02:23 Austral Jun 8 2023      1                       cLSiD11Band
11:02:23 Austral Jun 8 2023      1                       cLSiD11Band
11:02:23 Austral Jun 8 2023      1                       cLSiD11Band
11:02:19 Austral Jun 8 2023      24                      clcCdpApCacheApName
11:02:19 Austral Jun 8 2023      1                       clcCdpApCacheDeviceIndex
11:02:19 Austral Jun 8 2023      9                       cLApCpuAverageUsage
11:02:19 Austral Jun 8 2023      1315                    cLApCpuCurrentUsage
11:02:19 Austral Jun 8 2023      2550                    bsnAPIfDBNoisePower
The output from the show snmp stats oid command reveals the frequency at which various OIDs are being polled. A particular OID, bsnAPIfDBNoisePower, stands out due to its exceptionally high number of requests. This suggests that aggressive polling of this OID is likely contributing to the high CPU utilization observed on the WLC.
Let us try to understand what the OID bsnAPIfDBNoisePower does and its data storage times.
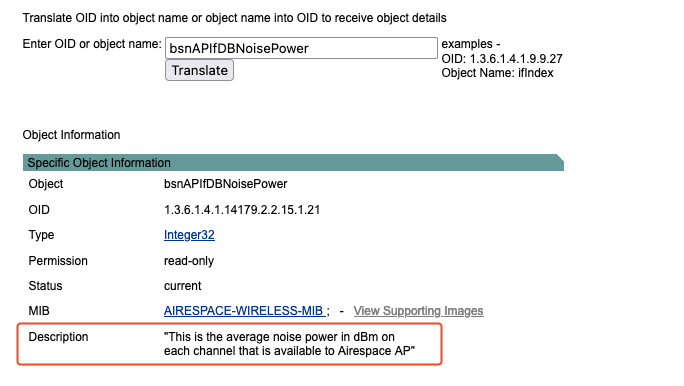
Navigate to SNMP Object Navigator and search the OID "bsnAPIfDBNoisePower".
 OID Search Result
So now you understand the bsnAPIfDBNoisePower object reports the noise power of each channel as reported by each AP. Given the large number of channels and APs managed by the WLC, the SNMP data generated by this OID can be substantial. When the WLC serves a large number of APs, the volume of data generated by polling this OID can be immense. This can lead to high CPU utilization as the WLC processes these extensive SNMP requests.
Similarly, you need to understand the behavior of the specific OID that is getting polled aggressively.
The next command is going to help you know the SNMP servers that are polling the WLC.
WLC#show snmp stats hosts
Request Count    Last Timestamp  Address
77888844          00:00:00 ago   10.10.10.120
330242            00:00:08 ago   10.10.10.150
27930314          00:00:09 ago   10.10.10.130
839999            00:00:36 ago   10.10.10.170
6754377           19:45:34 ago   10.10.10.157
722               22:00:20 ago   10.10.10.11
This command provides a list of SNMP servers along with their request counts and the last timestamp of their polling activity.
You can see there are multiple different server that are polling the 9800 WLC. If you look at the complete logs data collected during the last 10 mins you can gauge their polling frequency as well.
Now you can go to each server and see how frequently the offending OID is being polled. In this example case, the OID is being polled every 30 seconds, which is significantly more frequent than necessary. Since the WLC receives RF/RRM data every 180 seconds, polling the OID every 30 seconds results in unnecessary processing and contributes to high CPU utilization.
Once the offending OID and the server have been identified, we can try multiple different solution to reduce the load on the WLC.
- Reduce the polling frequency on the SNMP server.
- If the OID is not needed for operation usage, disable polling of that OID from the SNMP server.
- If you do not have control over the SNMP server, you can use SNMP view to block the offending OID.
SNMP View configuration
Define a new view that excludes the OID you want to block. For example, you want to block the OID 1.3.6.1.4.1.14179.2.2.15.1.21, create a new view and attach the OID to the view.
snmp-server view blockOIDView 1.3.6.1.4.1.14179.2.2.15.1.21 excluded  <-- This is the OID of bsnAPIfDBNoisePower
snmp-server community TAC view blockOIDView RO <-- This command assigns the blockOIDView to the community myCommunity with read-only (RO) access.
snmp-server group TAC v3 priv read blockOIDView <-- This command assigns the blockOIDView to the group myGroup with the priv security level for SNMPv3.
Troubleshooting Tip
- Baseline CPU Usage: Document the normal CPU utilization levels when the SNMP process is not causing high usage.
- SNMP Configuration: Review the current SNMP configuration settings, including community strings, version (v2c or v3), and access lists.
- SNMP Best Practice: Use the 9800 WLC best practise document and match the suggested configuration for SNMP as close as possible.
C9800(config)#snmp-server subagent cache
C9800(config)#snmp-server subagent cache timeout ?
  <1-100>  cache timeout interval (default 60 seconds)
- Frequency of SNMP Polling: Determine how often the WLC is being polled by SNMP queries, as a high frequency could contribute to increased CPU load.
- Network Topology and SNMP Managers: Understand the network setup and identify all SNMP managers that are interacting with the WLC.
- System Uptime: Check the time elapsed since the last reboot to see if there is a correlation between uptime and CPU utilization.
- Recent Changes: Note any recent changes to the WLC configuration or network that can have coincided with the onset of high CPU utilization.
- With 9800 WLC, the focus has been put on telemetry. Telemetry works in a "push" model where WLC sends out relevant information to the server without the need to be queried. If your SNMP queries are consuming WLC CPU cycles and causing operation issues, it would be better to move to Telemetry.
Conclusion
By methodically analyzing CPU utilization data and correlating it with SNMP polling activities, you can troubleshoot and resolve high CPU utilization issues caused by SNMP processes on the Cisco 9800 WLC. Post-implementation monitoring is essential to confirm the success of the troubleshooting efforts and to maintain optimal network performance.
Related Information


 Feedback