Introduction
This document describes a memory leak in the context of a Cisco Catalyst 9800 Wireless LAN Controller (WLC).
Memory Leak
When a program or process allocates memory for temporary use and does not correctly deallocate it when it is no longer needed, that memory remains in use from the perspective of the operating system. As the process continues to operate and repeatedly fails to deallocate memory, the total amount of memory used by the process grows, and less memory is available for other processes and system functions. Memory leaks are usually caused by software bugs or issues in the system firmware or applications running on it.
In the case of a Cisco Catalyst 9800 WLC, a memory leak can manifest as follows:
- Decreased Performance: As memory becomes increasingly scarce, the WLC possibly slows down, resulting in slower response times for management functions or decreased performance of client devices connected to the network.
- System Instability: Critical processes can start to fail, possibly leading to dropped client connections, inability to manage the WLC, or other erratic behaviours.
- System Crashes: In severe cases, the WLC can possibly crash and restart, especially if it runs out of memory for essential operations.

Note: 9800 WLC can experience a sudden reboot/crash to reclaim the leaked memory and recover itself. Since memory leak is buggy behaviour, leaks occur even after reboot unless the leak causing configuration/feature is disabled.
Syslog
%PLATFORM-4-ELEMENT_WARNING:R0/0: smand: RP/0 Used Memory Value 91% exceeds warning level 88%
This message prints the top 3 memory consuming process' name along with the traceky, callsite ID and diff calls:
%PLATFORM-4-ELEMENT_WARNING: Chassis 1 R0/0: smand: 1/RP/0: Used Memory value 91% exceeds warning level 88%. Top memory allocators are: Process: sessmgrd_rp_0. Tracekey: 1#258b8858a63c7998252e96352473c9c6 Callsite ID: 11B8F825A8768000 (diff_call: 20941). Process: fman_fp_image_fp_0. Tracekey: 1#36b34d8e636a89f6397a3b12acab9706 Callsite ID: 1944E78DF68EC002 (diff_call: 19887). Process: linux_Cisco IOSd-imag_rp_0. Tracekey: 1#8ec74901dc8e23a44e060e69d5820ece Callsite ID: E2AA338E11594003 (diff_call: 13404).
How to Identify 9800 WLC have Experienced Memory Leak Issue
It is important to address memory leaks promptly as they can compromise the stability and reliability of the network services provided by the WLC. To diagnose a memory leak on a WLC, you can use various commands on the CLI to monitor memory usage over time. They can look for processes that are using an increasing amount of memory without releasing it or patterns that indicate memory is not being reclaimed as expected.
Check how much memory is totally allocated to platform.
9800WLC#show version | in memory
cisco C9800-L-F-K9 (KATAR) processor (revision KATAR) with 1634914K/6147K bytes of memory.

32768K bytes of non-volatile configuration memory.
16777216K bytes of physical memory.

!! Determines Total platform memory available, Here it is 16GB
Check how much memory is allocated to each pool.
9800WLC#show processes memory
Processor Pool Total: 1674013452 Used: 823578520 Free: 850434932
reserve P Pool Total: 102404 Used: 88 Free: 102316
lsmpi_io Pool Total: 6295128 Used: 6294296 Free: 832
Check resource utilization, including memory usage. If it exceeds the Warning or Critical levels, it can indicate a potential memory leak.
 Memory Utilization on 9800 WLC
Monitor overall memory usage for control plane resources
9800WLC#show platform software status control-processor brief
Slot  Status  1-Min  5-Min 15-Min
1-RP0 Healthy   0.52   0.75   0.80

Memory (kB)
Slot  Status    Total     Used (Pct)     Free (Pct)     Committed (Pct)
1-RP0 Healthy 16327028   4898110(30%)  114218918 (70%)   5387920 (33%)
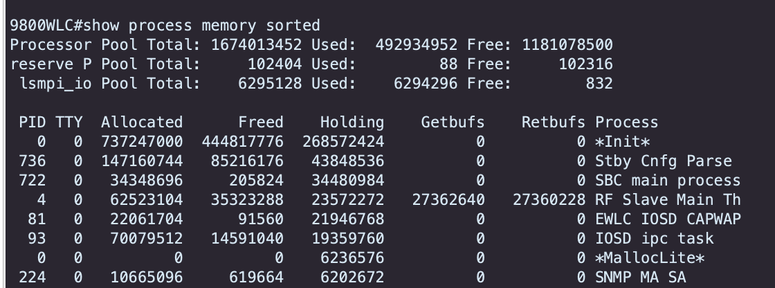
Monitor the allocated and used memory size for the top processes. If the memory usage continues to increase while the free memory remains fixed or is too low, there is a high chance of a memory leak at the Cisco IOSd level.
 Per Process Memory Stats Starting from the Highest Holding Process
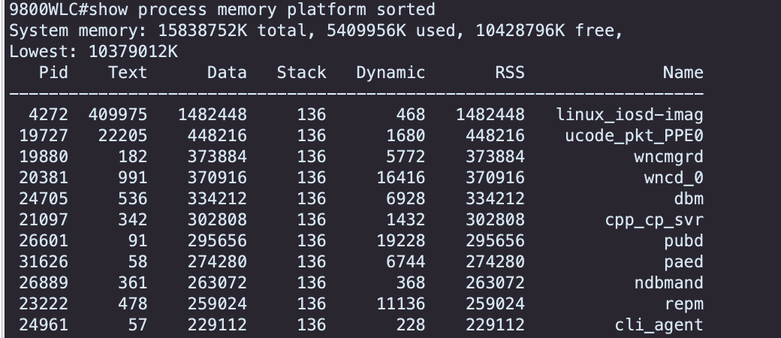
For platform-level memory leak issues, monitor the Resident Set Size (RSS) counters. RSS indicates the amount of memory allocated to a process during execution. If this value increases rapidly, it could signify a potential memory leak.
 Platform Processes Memory Usage from the Highest Holding Process
Troubleshooting Memory Leak in Cisco IOS® Process
In Cisco IOS XE, Cisco IOS operates as a process (daemon) running on top of the Linux kernel, known as Cisco IOSd. Typically, Cisco IOSd is allocated between 35% to 50% of the total available platform DRAM.
Basic Logs from WLC
Enable timestamp to have time reference for all the commands.
9800WLC#term exec prompt timestamp
To review the configuration and memory related information:
9800WLC#show tech-support wireless
9800WLC#show tech-support memory
Collect Core Dump file or System Report if generated.
Via GUI
Navigate to Troubleshooting > Core Dumps and System Report.
 Core Dump and System Report
Via CLI
9800WLC#show bootflash: | in core/system-report
9800WLC#copy bootflash:system-report/Core_file {tftp: | ftp: | https: ..}
For Processor Memory Pool
Check per process memory starting from the highest holding process.
9800WLC#show process memory sorted
Check the total memory stats for the concerned pool. It also shows largest free block and lowest available memory since boot.
9800WLC#show memory Statistics
Check the program counter (PC) which allocated large amount of memory.
9800WLC#show memory allocation-process totals
Check leaked blocks and chunks.
9800WLC#show memory debug leak chunks
!!This is CPU intensive cli and use only if above CLI output is not helping.
For IO Memory Pool
Check the top allocators.
9800WLC#show memory io allocating-process totals
If the top allocator is Packet Data or Pool Manager , check which caller_pc requested large number of buffers.
9800WLC#show buffers
9800WLC#show buffers usage
If the top allocator is mananged_chunk_process() or Chunk Manager process, then it means one or more chunks is/are allocating large amount of memory.
9800WLC#show chunk summary
9800WLC#show chunk brief
If the process MallocLite is the top allocator.
9800WLC#show memory lite-chunks totals
9800WLC#show memory lite-chunks stats
Troubleshooting Memory Leak at Polaris/Platform Level
Check memory usage % for available memory resources on platform.
9800WLC#show Platform resources
Check the overall system memory snapshot.
9800WLC#show platform software process slot chassis active R0 Monitor | in Mem
Check all platform processes memory sorted.
9800WLC#show process memory platform sorted
9800WLC#show platform software process memory chassid active r0 all sorted
Check last hourly status of callsites.
9800WLC#show process memory platform accounting
Pick the top contender from the previous two CLI outputs and enable the debugs for the individual processes.
9800WLC#debug platform software memory <process> chassis <1-2/active/standby> R0 alloc callsite stop
9800WLC#debug platform software memory <process> chassis <1-2/active/standby> R0 alloc callsite clear
9800WLC#debug platform software memory <process> chassis <1-2/active/standby> R0 alloc backtrace start <CALL_SITE> depth 10
9800WLC#debug platform software memory <process> chassis <1-2/active/standby> R0 alloc callsite start
!! Running these debugs has no impact to device
Collect the output a few minutes (15 minutes to one hour) after initiating the debugs.
9800WLC#show platform software memory <process> chassis <1-2/active/standby> R0 alloc backtrace
!! Capture this output three times, with a 5-10 minutes interval between each capture, to identify the pattern.
Check for call_diff, allocs, and frees value with the respective backtrace for each process.
9800WLC#show platform software memory <process> chassis <1-2/active/standby> R0 alloc callsite brief

Note: call_diff = allocs - frees
If allocs = frees, no memory leak
If frees = 0, memory leak
If allocs != frees, maybe or maybe not be memory leak (If call_diff is more, it indicates high chances of memory leak)
Capture data of database memory for individual process.
9800WLC#show platform software memory <process> chassis <1-2/active/standby>active R0 alloc type data brief
9800WLC#show platform software memory database <process> chassis <1-2/active/standby> chassis active R0 brief
Check system mount information to check the memory usage for temporarily created virtual file system.
9800WLC#show platform software mount
Recommendation
Refer to the relevant configuration guides, data sheets, and release notes for memory recommendations and scaling limits, and ensure the WLC is upgraded to the latest recommended release.
Related Information


 Feedback