Introduction
This document describes and provides an overview of all the Cisco IOS® XE features and capabilities leveraged for troubleshooting Catalyst 9800.
Prerequisites
Requirements
- Basic knowledge of Wireless LAN Controllers (WLC).
- Basic knowledge of the use case flows involved in the usage of a WLC.
Components used
This document covers 9800-CL, 9800-L, 9800-40 and 9800-80 controllers. It is mainly based on 17.3 Cisco IOS® XE version.
Background Information
Cisco IOS® XE running on 9800 WLCs is essentially made up of a Linux Kernel (binOS) with Cisco IOS® and all the wireless processes implemented as daemons.
All the process daemons can be bundled under the generic term Control Plane (CP) and are responsible for Control and Provisioning of Access Points (CAPWAP), Mobility, Radio Resource Management (RRM). Rogue Management, Network Mobility Service protocol (NMSP) that are destined to and from the 9800 WLC.
Data Plane (DP) refers to the components that forward data on 9800 WLC.
On all iterations of 9800 (9800-40, 9800-80, 9800-CL, 9800-SW,9800-L), Control Plane remains fairly common.
However, Data Plane varies with 9800-40 and 9800-80 that use hardware Quantum Flow processor (QFP) complex similar to ASR1k while 9800-CL and 9800-L uses software implementation of Cisco Packet Processor (CPP).
9800-SW simply leverages the Doppler chipset on Catalyst 9k series switches for data forwarding.
Packet flow inside 9800 WLC
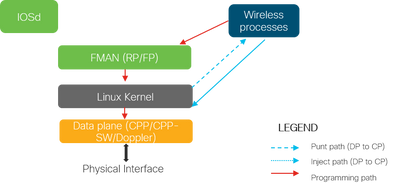
When a packet enters the 9800 WLC from physical ports, if it is determined to be control traffic, it is punted to the corresponding Control Plane Processes.
For an AP join, this would be all the capwap and dtls exchange sourced from AP. In case of client join, this would be all the traffic sourced from client until the client goes to RUN state..
As the various daemons process the incoming traffic, the resulting return traffic (capwap response, dot11, dot1x, dcp response) sourced from 9800 WLC to be sent to the client is injected back into the data plane to be sent out the physical port.
As we process AP joins, client join, mobility exchanges, data plane needs to be programmed so it can handle data traffic forwarding.
This occurs with multiple components being programmed sequentially over the programming path indicated in the image.
Cisco IOS® XE provides a versatile tool set to trace the packet from the moment it enters 9800 WLC until the processed traffic leaves the box.
The next section introduces these tools along with the commands used to invoke these tools from the command line interface (CLI).
Control Plane Tracing
This section describes the commands and tools available to view the processing done by the control plane processes after the packet meant for 9800 WLC has been punted from DP or before injecting the response packet sourced from 9800 WLC to the DP for sending out the physical interface
Syslog
Logs generated by the 9800 WLC is the first means to verify the general health of the system.
Any violation of the predefined threshold for system resources like CPU, memory, buffers are reported into the log.
Also, any errors generated by any subsystems get written into logs. To view the logs, navigate to Troubleshooting > Syslog
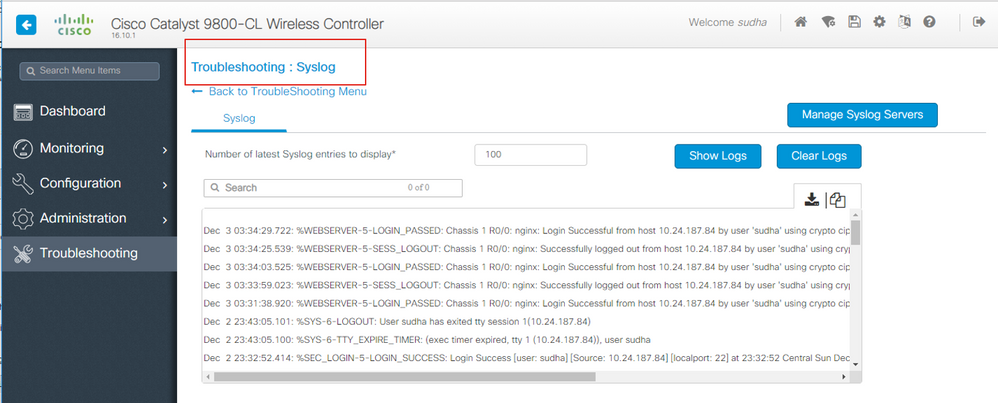
or run the CLI command :
# show logging
This output shows general logs as well as some wireless-specifics logs. However, contrary to legacy Cisco IOS®, no wireless debugging typically makes its way to this logging output.
Note: If WLC9800 is configured to redirect these logs to an external syslog server, then you need to check the logs on external syslog server as well.
Always-on Tracing
Every control plane process on the WLC9800 is constantly logging at logging level of Notice to its own dedicated buffer. This is termed as always-on tracing.
This is a unique capability that allows you to get contextual data on a failure that has occurred without mandating the failure condition be reproduced.
For example, if you are familiar with AireOS, for any client connectivity troubleshooting, you would need to enable debugs and reproduce the client connectivity problem state to identify the root cause.
With always-on tracing, you can look back to already captured traces and identify if it is common root cause. Depending on volume of logs generated, we can look back several hours to several days.
Now, while the traces are logged per individual process, it is possible to view them wholistically for a particular context of interest like client mac or AP mac or AP ip address. In order to do so, run the command
# show logging profile wireless filter mac to-file bootflash:
By default, this command only goes back 10 minutes in time to generate and decode the logs. You can chose to go further back in time with :
# show logging profile wireless start last <number> [minutes|hours|days] filter mac to-file bootflash:
In order to view per-process logs, run the command
# show logging process to-file bootflash:
Note: There are multiple filtering options on these CLIs including module, logging level, start timestamp and so on. To view and explore these options, run the command
# show logging profile wireless ?
# show logging process  ?
Conditional Debugging and RadioActive tracing
Conditional Debugging allows the ability to enable debug level logging for specific features for the conditions of interest.
RadioActive tracing takes it a step further by adding the ability to conditionally print debug information across processes, threads for the condition of interest.
This means, the underlying architecture is completely abstracted.
Note: On 16.12, radioactive tracing is only implemented for troubleshooting AP join with AP radio and ethernet mac addresses, client join with client mac address as well mobility issues with mobility peer ip and CMX connectivity with the CMX ip address as conditions of interest.
Note: MAC address vs IP address as condition provides different outputs as different processes are aware of different identifiers for the same network entity (AP or client or mobility peer).
With client connectivity, as an example to troubleshoot, conditional debug runs for client mac to get end to end view at control plane.
Radioactive traces via web UI
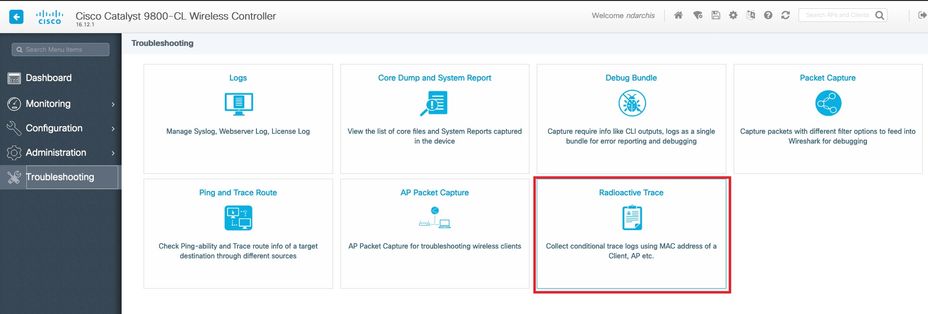
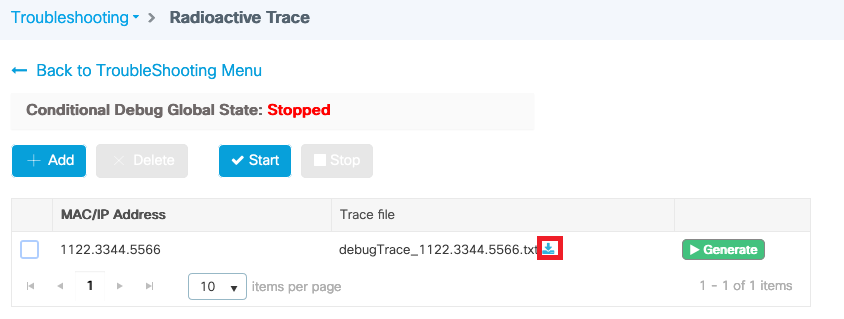
Go the Troubleshooting page menu and chose Radioactive Tracing
Click Add and enter a client or AP mac address that you want to troubleshoot. As of 16.12, only mac addresses can be added through the GUI. You can add IP address through CLI.
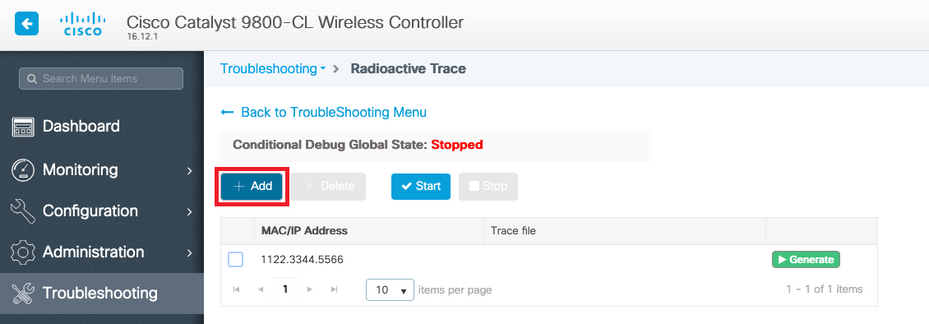
You can add several mac addresses to track. When you are ready to start the radioactive tracing, click start.
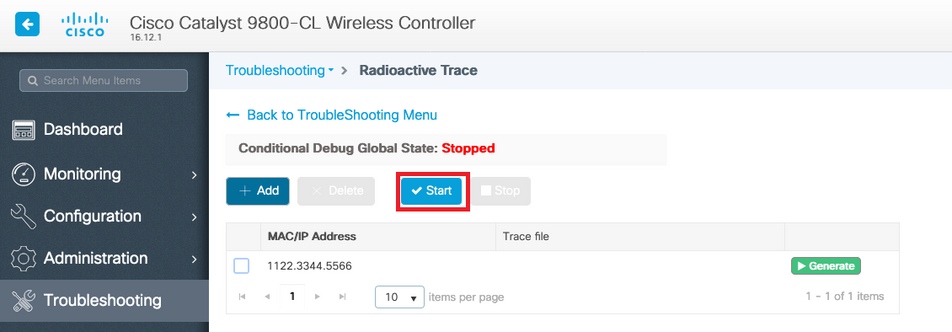
Once started, debug logging are written to disk about any control plane processing related the tracked mac addresses.
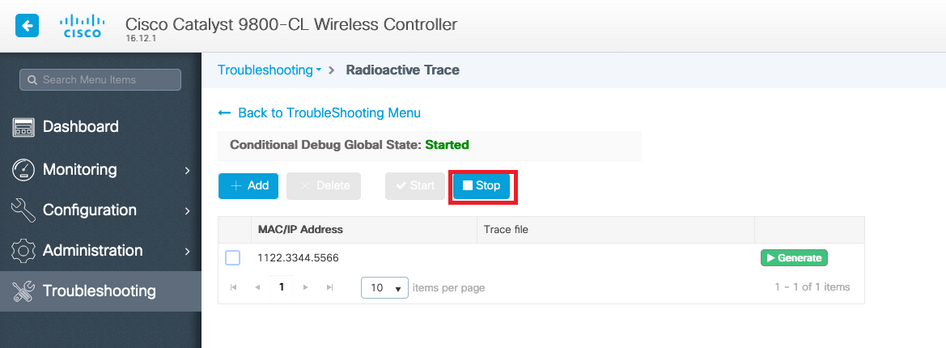
When you reproduced the issue you want to troubleshoot, click Stop.
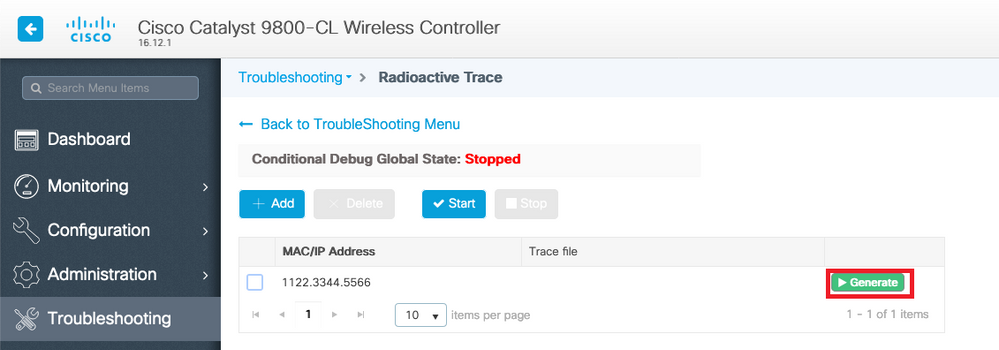
For each mac address debugged, you can generate a log file collating all the logs pertaining to that mac address by clicking Generate.
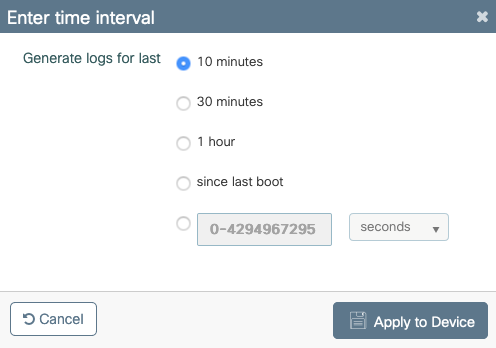
Chose how long back you want your collated log file to go and click Apply to Device.
You can now download the file by clicking the small icon next to the file name. This file is present in the bootflash drive of the controller and can also be copied out of the box through CLI.
Radioactive traces via CLI
In order to enable conditional debugging, run the command
# debug wireless {mac | ip} {aaaa.bbbb.cccc | x.x.x.x } {monitor-time} {N seconds}To view the currently enabled conditions, run the command
# show debugging
These debugs do not print any output on terminal session but store the debug output file to flash to be retrieved and analyzed after. The file is saved with the naming convention ra_trace_*
For example, for mac address aaaa.bbbb.cccc, file name generated is ra_trace_MAC_aaaabbbbcccc_HHMMSS.XXX_timezone_DayWeek_Month_Day_year.log
One advantage is that the same command can be used to troubleshoot AP join issues (input AP radio mac and ethernet mac), client connectivity issues (input client mac), mobility tunnel issue (input peer ip), client roaming issues (input client mac).
In other words, you do not have to remember multiple commands like debug capwap, debug client, debug mobility and so on.
Note: debug wireless also allows pointing to an FTP-server and running even more verbose logging with keyword internal. We do not recommend these at this time, as there are some issues being ironed out.
In order to debug output file on terminal session, run the command
# more bootflash:ra_trace_MAC_*.log
In order to redirect the debug output to an external server for offline analysis, run the command
# copy bootflash:ra_trace_MAC_*.log ftp://username:password@FTPSERVERIP/path/RATRACE_FILENAME.txt
There is a much more verbose view of the same debug log levels. in order to see this verbose view, run the command
# show logging profile wireless internal filter mac to-file
To disable debugging for specific context or before the configured or default monitor time is up, run the command.
# no debug wireless mac <aaaa.bbbb.cccc>
Caution: The conditional debugging enables debug level logging which in turn increases volume of the logs generated. Leaving this running reduces how far back in time you can view logs from. So, it is recommended to always disable debugging at the end of troubleshooting session.
In order to disable all debugging, run these commands
# clear platform condition all
# undebug all
Per-Process Non-Conditional Debugging
For the use cases and processes, not implemented for radioactive tracing, you can get debug level traces. To set debug level on specific process, use the command
# set platform software trace <PROCESS_NAME> wireless chassis active R0 { module_name | all-modules } To verify trace levels of the various modules, run the command
# show platform software trace level <PROCESS_NAME> chassis active R0
To view the traces collected, run the command
# show logging process to-file
Data Plane Packet Tracing
When a packet first enters 9800 WLC, some processing occurs at data plane to identify if traffic is control plane or data plane.
Packet-Trace feature provides a detailed view of this Cisco IOS® XE processing done at dataplane and the decision made on whether to punt, forward, drop or consume the packet.
This feature on WLC 9800 works exactly same as the implementation on ASR!k.
Packet Tracer on 9800 WLC provides three levels of inspection same as ASR1K.
- Statistics - Provides count of packets that enter and leave the networking processor
- Summary -
- This is collected for a finite number of packet that match specific condition of interest.
- The summary output indicates ingress and egress interfaces, lookup decision made by the data plane and also tracks punt, drop and inject packets, if any.
- This output provides succinct view of the dataplane processing
- Path Data - This provides the most detailed view of DP packet handling. Collected for finite number of packets, it includes conditional debugging id that can be used to correlate DP packet to control plane debugs, timestamp as well as feature specific path-trace data. This detailed view has two optional capabilities
- Packet copy enables you to copy ingress and egress packets at various layers of the packet (layer2, layer 3 and layer 4)
- Feature Invocation array (FIA) is the sequential list of features that are executed on the packet by the data plane. These features are derived from the default and user enabled configuration on WLC 9800
For detailed explanation of the feature and suboptions, refer to Cisco IOS XE Datapath Packet Trace Feature
For wireless workflows like AP join, client connectivity, and so on, tracing the uplink bidirectionally
Caution: The dataplane packet-tracer only parses outer CAPWAP header. So, conditions like wireless client mac do not yield useful output.
Step 1. Define condition of interest.
# debug platform condition { interface | mac | ingress | egress | both | ipv4 | ipv6 | mpls | match }Warning: Both the commands - debug platform condition feature as well as debug platform condition mac aaaa.bbbb.cccc are meant for control plane packet tracing and do not return any dataplane packet traces.
Step 2. To view the currently enabled conditions, run the command
# show platform conditions
Step 3. Enable packet-tracer for a finite number of packets. This packet number is defined as a power of 2 in the range of 16 - 8192. By default, both the summary and feature data are captured. Optionally, you can choose to only get a summary view if you use summary-only sub-option. You have also have sub-options available to get fia trace, defining packet size in bytes, trace punt, inject or drop packets. and so on.
# debug platform packet-tracer packet <packet-number> {fia-trace}
Step 4. (Optionally) You can copy and dump the packets as they are traced
# debug platform packet-trace copy packet both size 2048 { l2 | l3 | l4 }Step 5. Enable conditional debugging.
# debug platform condition start
Step 6. In order to view if the packet-trace is collecting any output, verify statistics
# show platform packet-trace statistics
Step 7. In order to view the output of the packet-trace, run the command
# show platform packet-tracer summary
Step 8. (Optional) You can export packet dump for offline analysis by Cisco TAC
# show platform packet-trace packet all | redirect { bootflash: | tftp: | ftp: } pactrac.txtEmbedded Packet Capture
Embedded Packet capture (EPC) is a packet capturing facility that allows view into packets destined to, sourced from and passing through the Catalyst 9800 WLCs. These captures can be exported for offline analysis with Wireshark.
For more details on the feature, refer EPC Configuration Guide
Compared to AireOS, instead fo relying on packet capturing and traffic mirroring capabilities on uplink switch, 9800 WLC allows for pcap capture on the box itself.
On 9800, this capture can be setup both from Command Line Interface (CLI) as well as on the Graphical User Interface (GUI).
To configure via GUI, navigate to Troubleshooting > Packet Capture > +Add
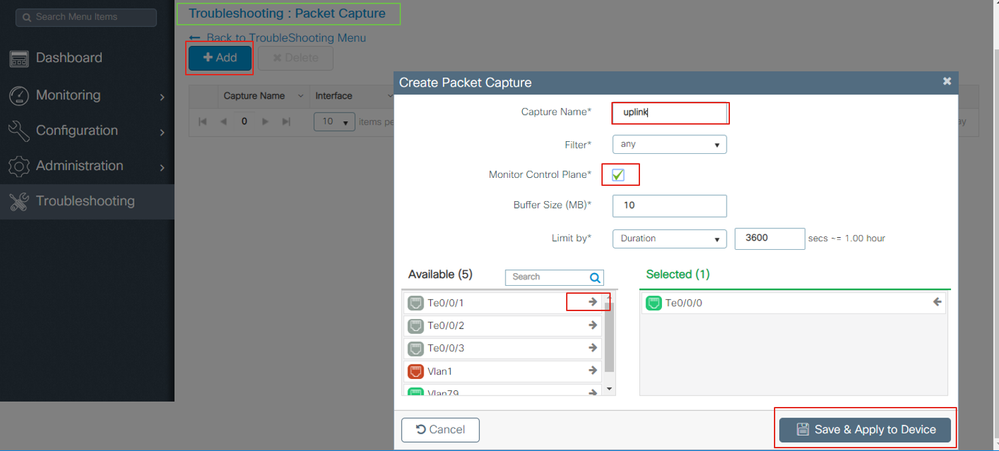
Step 1. Define name of the packet capture. Maximum of 8 characters is allowed.
Step 2. Define filters, if any
Step 3. Check the box to Monitor Control Traffic if you want to see traffic punted to system CPU and injected back into the data plane
Step 4. Define buffer size. A maximum of 100 MB is allowed
Step 5. Define limit, either by duration which allows a range of 1 - 1000000 seconds or by number of packets which allows range of 1 - 100000 packets, as desired
Step 6. Choose the interface from list of interfaces in the left column and selecting the arrow to move it to the right column
Step 7. Save and Apply to Device
Step 8. To start the capture, select Start
Step 9. You can let the capture run to the defined limit. To manually stop the capture, select Stop.
Step 10. Once stopped, an Export button becomes available to click with the option to download capture file (.pcap) on local desktop via https or TFTP server or FTP server or local system harddisk or flash.

Note: CLI provides a little more granularity of options such as Limit by. GUI is sufficient to capture packets for common use cases.
To configure via CLI:
Create the monitor capture:
monitor capture uplink interface <uplink_of_the_9800> both
Associate a filter. The filter can be specified inline, or an ACL or class-map can be referenced.
In this example it’s the ACL to match the traffic between the 2 ip addresses of the 9800 and another WLC 5520. Typical scenario for mobility troubleshooting:
conf t

ip access-list extended mobilitywlcs
permit ip host <5520_ip_address> host <9800_ip_address>
     permit ip host <9800_ip_address> host <5520_ip_address>
end

monitor capture uplink access-list mobilitywlcs
If you want the capture to run in a circular buffer, it gives some time to notice the problem and then stop the capture and save it.
If you set it to 50MB buffer for example. It takes maximum 50MB of disk on the 9800 and its pretty large to capture several minutes of data in the hope that you get the occurrence of the problem.
monitor capture uplink buffer circular size 50
Start the capture. You can to it from GUI or CLI:
monitor capture uplink start
The capture is now active.
Allow it to collect the necessary data.
Stop the capture. You can do it via GUI or CLI:
monitor capture uplink stop
You can retrieve the capture from the GUI > Troubleshooting > Packet Capture > Export.
Or upload to a server from CLI. Example via ftp:
monitor capture uplink export ftp://x.x.x.x/MobilityCAP.pcap
Once the necessary data has been collected, remove the capture:
no monitor capture uplink
Alarm LED and critical platform alarms
All 9800 appliances (9800-L, 9800-40 and 9800-80) have an ALM LED on their front panel. If that LED goes red, it means that there is a critical alarm on the platform.
You can verify the alarms that cause the LED to go red with the show facility-alarm status command
WLC#show facility-alarm status
System Totals  Critical: 2  Major: 0  Minor: 0

Source                     Time                   Severity      Description [Index]
------                     ------                 --------      -------------------
TenGigabitEthernet0/1/0    Jul 26 2019 15:14:04   CRITICAL      Physical Port Link Down [1]
TenGigabitEthernet0/1/1    Jul 26 2019 15:14:04   CRITICAL      Physical Port Link Down [1]


 Feedback