Analyze and Troubleshoot 802.11 Wireless Sniffing
Available Languages
Download Options
Bias-Free Language
The documentation set for this product strives to use bias-free language. For the purposes of this documentation set, bias-free is defined as language that does not imply discrimination based on age, disability, gender, racial identity, ethnic identity, sexual orientation, socioeconomic status, and intersectionality. Exceptions may be present in the documentation due to language that is hardcoded in the user interfaces of the product software, language used based on RFP documentation, or language that is used by a referenced third-party product. Learn more about how Cisco is using Inclusive Language.
Contents
Introduction
This document describes the process to collect a good wireless sniffer trace in order to analyze and troubleshoot 802.11 behavior.
Background Information
This process can be a difficult and time intensive operation. There are a few things to bear in mind to help simplify and speed up this process. With wireless sniffing, it helps to have an idea of what you want to do. You want to capture the raw wireless frames from over the air, as seen by the wireless sniffing device itself.
Checklist for a Successful Capture
Step 1: Since the sniffing device, client device, and AP are using RF generating radios for transmission or reception, it helps to have your wireless sniffer close to your target device (the client machine). This allows your sniffing device to capture a good approximation of what your client device hears over the air.
Step 2: Use a separate device to act as your wireless sniffer. You cannot take a good wireless sniffer trace if it is running on the device under test (the client machine you want to get a wireless trace of).
Step 3: Understand exactly what 802.11 Channel and Band your client device uses before setting up your capture. Lock your sniffer to the channel of interest - do not use the sniffer's scan channels mode! (With scan channels, the sniffer cycles from channel to channel every second or so. This is useful for a site survey or to find rogues, but not when you attempt to capture an 802.11 problem.)
Also, bear in mind that your client device can roam to another AP which is on a different RF channel or Band, so you need to plan accordingly. Typically in the 802.11b/g (2.4GHz) environment, a three channel sniffer can be required. This involves the use of 3 Wireless adapters on your sniffing device, with each one set to channels 1, 6 and 11. USB wireless adapters work best for this type of setup.
Step 4: If you troubleshoot 5GHz, then the number of channels dramatically increases. Since you cannot have enough cards to capture all channels, it is a good practice for the test to operate on not more than 4 channels on your surrounding Access Points.
Step 5: If you can reproduce the problem when a client roams from one channel to another, then a 2-channel sniff can suffice. If you only have a single channel sniffer available, then have it sniff the roamed-to channel.
Step 6: Always NTP sync your sniffers. The packet capture needs to be collated with debug captures, and with other wired and/or wireless captures. To have your timestamps even one second off makes the collation much more difficult.
Step 7:If you are capturing for a long period of time (hours), then configure your sniffer to cut a new capture file every 30MB or so. In order not to fill up your hard drive, you want to put an upper limit on the number of files written.

Note: The Linksys USB600N does not reliably collect 11n packets with short guard interval. It misses 20% to 30% of short guard interval packets. If necessary, the WLC configuration can be changed to only use the slower long guard interval. This can only be a temporary configuration change. The command is config 802.11 {a | b}11nsupport guard-interval {any | long}.
Sniffer Tools
Wireless Sniffing with a Mac with OS X 10.6 and higher.
Wireless sniffing on the Mac works well, as Mac OS X has built in tools to capture a wireless trace. However, it depends on what versions of OS X you are running, as the commands can vary. This document covers OS X 10.6 through the latest version. Wi-Fi diagnostics is the preferred method in the latest macbooks. It is always good to remember that your macbook sniffer needs to be at least as capable as the client you are sniffing (sniffing an 802.11ac smartphone with an 802.11n macbook is not optimal).
Mac OS X Wireless Sniffing Tools
- airportd (10.6-10.8)
- airport utility (10.6 - 10.8)
- tcpdump (10.8)
- Wi-Fi Diagnostics (10.7->10.12)
- Wireshark (10.6 - 10.8)
- 3rd party tool : Airtool
Airportd
If you run OS X 10.6 (Snow Leopard) or higher, then you can easily use the command line utility airportd.
Use these steps:
- Use the command + Space bar key combo to bring up the search dialog box in the upper right top of the screen and type in the word terminal. This can search for the terminal application. Choose this application to run it. A terminal window can appear.
- Once you have a terminal window open, you can run the this command to capture a Wireless sniffer trace on RF channel 11 (802.11b/g):
sudo /usr/libexec/airportd en1 sniff 11
Some things to remember:
- You are prompted to enter in your account password for verification.
- You cannot specify the name of the capture file or where you place the output.
- You lose any wireless connectivity to your network while the capture occurs.
- If you use an Air, the wireless adapter is en0 rather than en1.
Once you are finished with the trace, hit Cntl-C to stop the trace and the utility displays the name and location of the capture file. The file format is your standard wireshark PCAP file that can be read on the MAC or Windows via Wireshark.
Airport Utility
The airport utility is not a sniffer program; however, it can provide information about the wireless LAN. Also, it has the ability to set the default wireless channel which is crucial for sniffer programs (tcpdump, Wireshark) that are themselves unable to set the channel.

Note: Because the path to the airport utility is so ugly, it can be a good idea to set a symbolic link to it from a directory in the path. For example, # sudo ln -s /System/Library/PrivateFrameworks/Apple80211.framework/Versions/Current/Resources/airport /usr/sbin/airport.
Set the Wireless Channel
# sudo /System/Library/PrivateFrameworks/Apple80211.framework/Versions/Current/Resources/airport --channel=48
Dump Out Info on the SSIDs/BSSIDs Seen
# sudo /System/Library/PrivateFrameworks/Apple80211.framework/Versions/Current/Resources/airport -s
SSID BSSID RSSI CHANNEL HT CC SECURITY (auth/unicast/group)
Test 00:24:97:89:cb:41 -53 11 Y -- WPA(PSK/TKIP/TKIP) WPA2(PSK/AES/TKIP)
Test2 00:24:97:89:cb:40 -53 11 N -- WPA(PSK/TKIP/TKIP)
Guest 00:22:75:e6:73:df -64 6,-1 Y -- WPA(PSK/AES,TKIP/TKIP) WPA2(PSK/AES,TKIP/TKIP)
Detailed Information on the Current Association
# sudo /System/Library/PrivateFrameworks/Apple80211.framework/Versions/Current/Resources/airport –I
agrCtlRSSI: -54
agrExtRSSI: 0
agrCtlNoise: -89
agrExtNoise: 0
state: running
op mode: station
lastTxRate: 300
maxRate: 300
lastAssocStatus: 0
802.11 auth: open
link auth: wpa2-psk
BSSID: 0:24:97:95:47:60
SSID: GuestNet
MCS: 15
channel: 36,1
tcpdump
Tcpdump is a command line utility shipped with OS X that can perform packet capture (The tshark utility bundled with Wireshark is very similar). To perform a wireless packet capture with tcpdump:
- First, set the channel and use the airport utility as shown previously.
- Then, perform a wireless packet capture, and save to a file. When done, type Control/C to exit.
Example:
bash-3.2# tcpdump -I -P -i en1 -w /tmp/channel-11.pcap
tcpdump: WARNING: en1: no IPv4 address assigned
tcpdump: listening on en1, link-type IEEE802_11_RADIO (802.11 plus radiotap header), capture size 65535 bytes
^C
897 packets captured
968 packets received by filter
0 packets dropped by kernel
bash-3.2#
Wi-Fi Diagnostic
The easiest capture method is to use the graphical program called Wi-Fi Diagnostics.
It can be accessed by holding the ALT key and clicking the top-right wifi icon (the one where you typically choose the SSID you want to connect to).
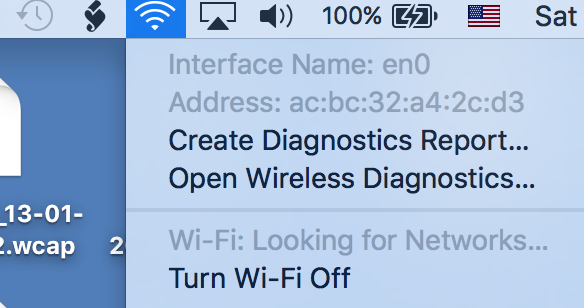
Click the Open Wireless diagnostics option in the list.
It brings up a window that runs a default report on troubleshooting. This is typically NOT what you are interested in.
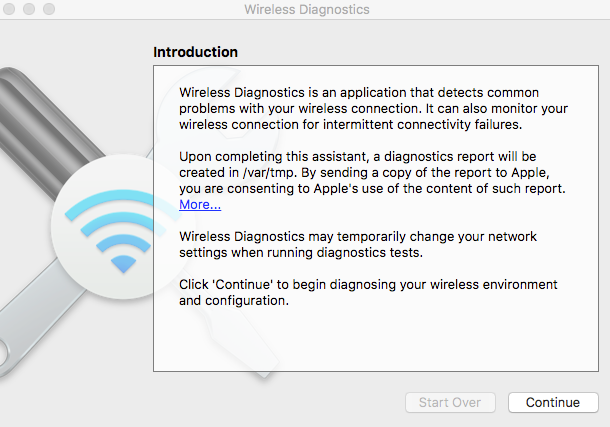
Keep that window open and navigate to the menu bar on top of the screen. Click Window. You see a list of various tools (useful for site survey or signal analysis). In the scope of wireless sniffer capture, you are interested in the Sniffer option, click it.
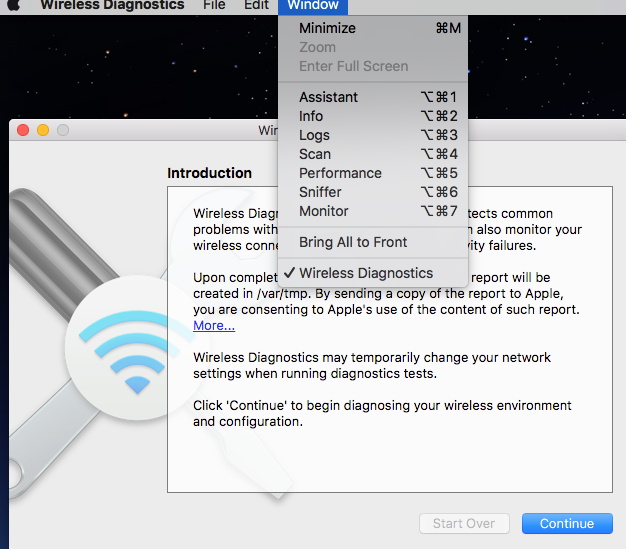
You then simply have to chose the primary channel as well as channel width.
The sniffer capture saved either on the Desktop or in /var/tmp/ as of Mac Os Sierra.
Airtool
Some third party tools also exist that support many mac os x versions and enhance the embedded sniffing features with easier options to chose channels. One example is Airtool.
Wireless Sniffing using Windows 7 with 3.4 (deprecated method)
Introduction
With Microsoft Network Monitor ( 3.4), you can now perform some decent 802.11a/b/g (and maybe 11n) wireless sniffing in Windows 7, with your standard wireless adapter. The file saved from can be read by latest (1.5 and greater) Wireshark, though not in OmniPeek. It is important to note that is not supported by Microsoft anymore and most often does not work properly on 11n and 11ac adapters (most frames missing).
Netmon 3.4 is supported with XP SP3; however, it does not support wireless sniffing when running XP. As to Vista, experience is mixed.
The Netmon detailed section of this document has been removed since it is deprecated and does not reliably capture 802.11ac frames.
You can view details at: Wireless Sniffing in Windows with Netmon
Wireless Sniffing using Cisco Lightweight Access Point (LAP) in Sniffer Mode
Introduction
You can use the Cisco WLC and LAPs in sniffer mode, in conjunction with a wired sniffer (Best results with Wireshark. Omnipeek decrypts the protocol differently as of version 10).
A single wired sniffer can collect packets from multiple APs, so this method is very useful to run multi-channel traces. For static scenarios, if it is possible to move the sniffer AP, this can be used as an effective alternative to other sniffing options.
For roaming scenarios, the sniffer APs are usually installed in the proximity of the APs the client roams through, and this can report the “point of view” of the static APs rather than the client.
In order to see the RF from the point of view of the client while roaming, a multi-channel wireless trace can be captured with a laptop with multiple Wireless NICs that can use the test client.
Configuration steps
Step1. WLC / AP side
Here are the steps in order to collect a trace that uses a sniffer mode LAP.
Configure the AP in Sniffer mode:
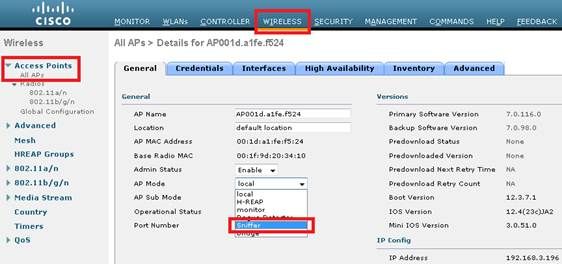
The AP can reboot and not be able to serve clients. Once the AP has re-joined the WLC, configure the radio of the AP (802.11b/g/n or 802.11a/n):
- specify the sniffer IP address
- choose the channel
- enable sniffing

The sniffer receives the 802.11 traffic encapsulated and uses the airopeek protocol, from the WLC management IP address with source port UDP/5555 and destination UDP/5000.
Step 2. Sniffer side: Wireshark
If you use Wireshark to receive the traffic, perform these steps:
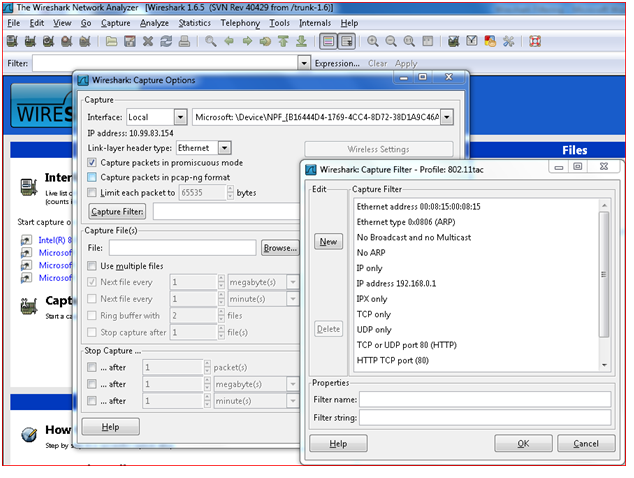
- Set the capture options to receive only traffic that comes from the sniffing AP. If you set the filter only for port UDP 5000, you miss IP fragments in the capture if the AP has to fragment the packet (which happens if it sniffed a 1500 bytes long frame to which it needs to add PEEKREMOTE encapsulation):
This filter is optional, but strongly recommended as it excludes all the non-wireless related traffic from the capture. Consider that the WLC sends traffic to a UDP port and there is no application listening on the sniffer side; this results in a ICMP port-unreachable response for each packet received from the WLC.
Although this is expected, the filter helps to also exclude this traffic which is useless, and it can only cause the trace to be bigger and more difficult to read.
Then, start the capture:

The captured traffic has to be decoded as.. PEEKREMOTE in order to be able to see the 802.11 traffic:
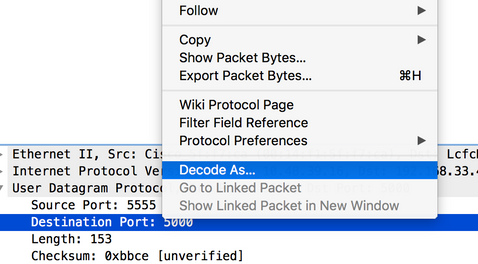

- The 802.11 traffic cannow be visible:
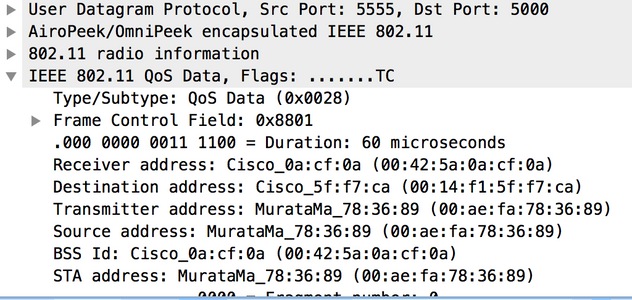
The RF info shown in the image (in other words, the channel, signal strength, noise and so on) are added by the AP.
Step 3. Sniffer side: OmniPeek
When you use OmniPeek as the receiver of the traffic stream from the WLC/AP in sniffer mode, it is first of all necessary to create a Cisco Remote Adapter under the Adapter menu of the Capture Options window:
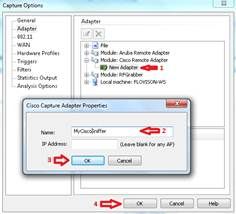
At least one adapter is required; the name is a mandatory field, whereas the IP Address field can be left blank if you do not want OmniPeek to filter the incoming traffic from a specific WLC.
In this case, it is not necessary to filter out any traffic (such as the ICMP port-unreachable) as OmniPeek listens on the UDP port to specifically capture the data stream from the Wireless LAN Controller.
Before you start the capture, confirm the settings on the main OmniPeek window:
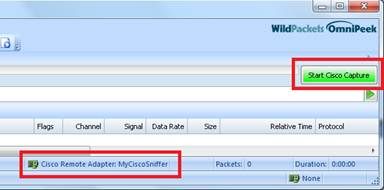
At this point, the capture can be started and the result is a trace that includes the RF info reported by the AP:
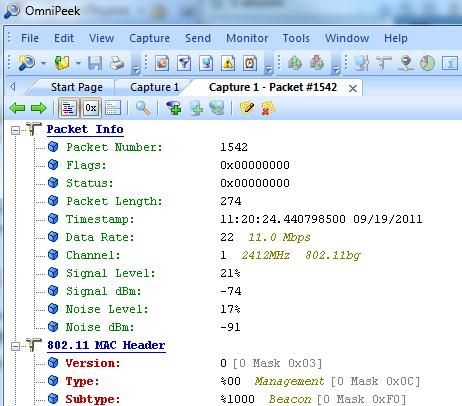

Note: By default, OmniPeek remote adapter picks up the timestamp sent by the AP itself. This info has nothing to do with the AP clock, so the resulting timestamp can be incorrect. If you use a single sniffer AP, the timestamps can be wrong, but at least consistent. This is no longer true if you use multiple APs as sniffers (as every AP sends its own timestamp info, causing weird time jumps on the merged capture).
Solution
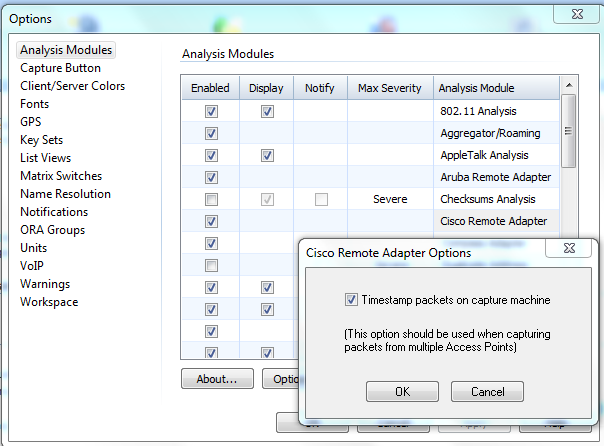
You can explicitly tell OmniPeek to use the local sniffer PC clock to set the packet timestamp.
This solves both the single and multi AP scenario, and has correct and consistent timestamps as long as the PC running OmniPeek has a NTP-synched clock.
How-to steps:
In OmniPeek, do these steps:
1. Navigate to Tools > Option > Analysis Modules.
2. Search for cisco remote adapter, then double click to bring out the options.
3. Click the Timestamp option, then click OK and test the capture again.
Wireless Sniffing using Cisco® Autonomous (IOS) AP
An autonomous AP can be used to gather air packet captures. These instructions list how to perform the air capture.
1. Enter the dot11radio interface on which you wish to perform the capture. Set the station-role to sniffer, add the server/PC IP that can run Wireshark and collect the captures, and select the channel. The port you specify with the monitor frames command can be the destination UDP port to which the AP sends the captures.
|
|
|
|
|---|---|---|
|
Step 1 |
int {d0 | d1} |
Enter interface configuration command mode for configuring the radio interfaces. |
|
Step 2 |
station-role sniffer |
Change the station role to sniffer. |
|
Step 3 |
channel number |
Select the channel in which to operate in sniffer mode. |
|
Step 4 |
no shut |
Reverse the shutdown of the interface. |
|
Step 5 |
exit |
Exit interface configuration command mode. |
|
Step 6 |
sniffer ip-address destination-ip port port-number |
Set the IP address and port number to which AP redirects all the packets. You can specify an IP address on any port number between 1024 to 65535. |
|
Step 7 |
wireshark enable |
If you use Wireshark at the end point, this adds a Wireshark header to the packets. |
Sample configuration:
ap(config)# int d0
ap(config)-if# station-role sniffer
ap(config)# channel 11
ap(config)# no shut
ap(config)# exit
ap(config)# sniffer ip-address 10.10.10.1 30 port 5555
ap(config)# wireshark enable
2. Start Wireshark on the server/PC. Navigate to Capture > Options. Choose the Ethernet NIC (LAN) and add a filter to capture only traffic with the UDP port you specified in step 1.
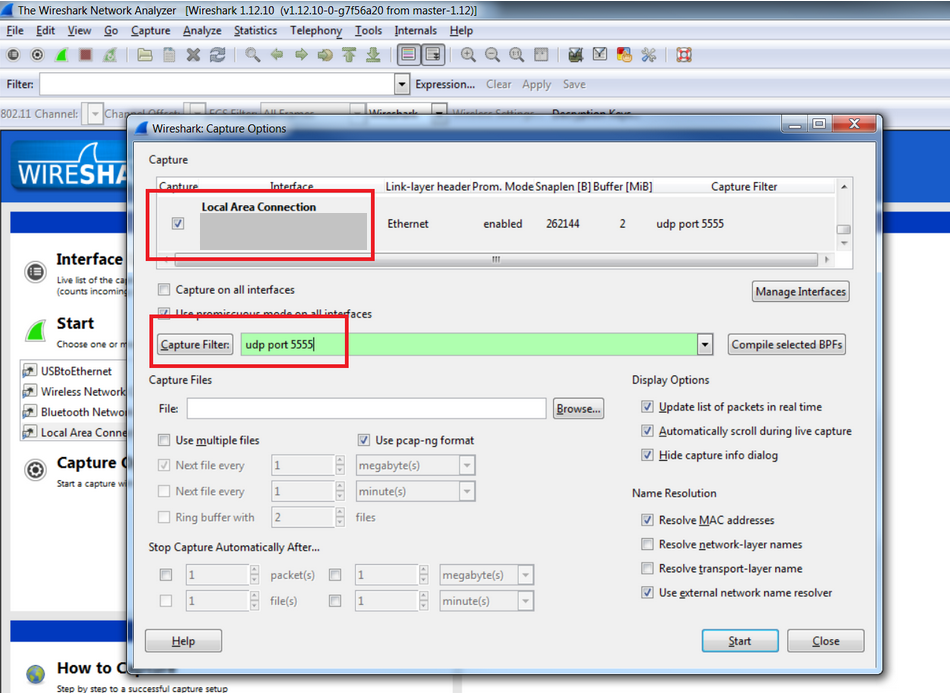
3. Start the Wireshark capture.
Uploading Capture Files to TAC Service Request
If the capture file(s) are too large for email, you can upload them to your TAC Service Request:
https://tools.cisco.com/ServiceRequestTool/query/
Enter your SR Number, and then click File Upload.
Sniffer Analysis
To analyze wireless captures, refer to the links listed. They are designed to be read in order since each document builds upon the preceding document. Remember that when reading any wireless trace, it is a good idea to understand the 802.11 Wireless specifications. These documents do a great job to help you understand the packet flow and what to look for in a wireless trace. They are not meant to teach the 802.11 Wireless specifications.
802.11 Sniffer Capture Analysis - Physical Layer
Intro: Physical Layer Info in Wireless Packet Captures
A captured packet contains a copy of the frame data, but prepended to each frame is a metadata header that gives you information about how the frame was captured. With wired packets, the metadata is not much. It is the frame number, date when the packet was captured, and the packet’s length. When you do wired packet analysis, you rarely care too much about the physical layer – with a bit error rate of 1010, you usually assume that the captured bits are what they say they are.
Wireless is another story entirely. The physical layer is more complex and treacherous than wired. Before you dive into an attempt to analyze a capture based upon the upper layers, it is usually a good idea to get an understanding of the physical layer in which the capture was taken. If the physical layer is not working right, then the upper layers can never have a chance.
The physical layer qualities are particularly important to be aware of:
Signal strength (RSSI, signal strength, Signal/Noise Ratio.) It is generally best to focus on RSSI, if available. The power level in dBm at which the sniffing adapter received the packet is:
- RSSI < -90 dBm: this signal is extremely weak, at the edge of what a receiver can receive.
- RSSI -67dBm: this is a fairly strong signal – the edge of what Cisco considers to be adequate to support Voice over WLAN.
- RSSI > -55dBm: this is a very strong signal.
- RSSI > -30dBm: your sniffer is sitting right next to the transmitter.
Channel (frequency). As a wireless LAN can support anywhere from 3 to 25 or so different channels, it is crucial to know exactly which channel(s) your capture was taken from. If your intention is to get a sniff from a specific AP, then lock your sniff to that AP’s channel, and validate that the capture was on that channel, otherwise the capture can be worthless.
.
Data rate can be anywhere from 1Mbps up to 300Mbps or more. To understand why data transmissions do not always make it from transmitter to receiver, you must know what data rates are being used. A “marginal” RSSI of -80dBm can work horribly for a packet modulated at 54Mbps, but can be quite satisfactory at 6Mbps.
Wireless Packet Headers – Examples
Different wireless sniffers can use different metadata header formats to encode the wireless physical layer. Do be aware that the accuracy of the information is dependent upon the specific adapter hardware and driver in use. Some values, such as noise, are generally be taken into account.
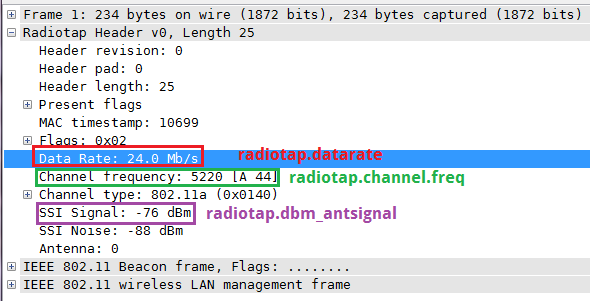
These samples have the data rate, frequency and RSSI fields highlighted.
Mac OS X 10.7 Wireless Diagnostics (Broadcom Adapter)
OS X 10.7 uses a Radiotap v0 header, which looks like this in Wireshark:
OmniPeek 6.8 (Ralink USB Adapter)
In Wireshark, an OmniPeek capture uses an Airopeek header, which looks like this:

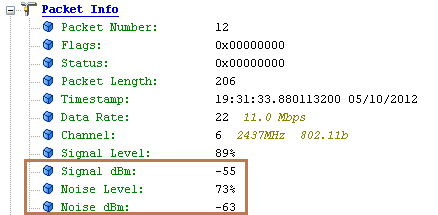
Wireshark (as of 1.6.x) does not know how to decode all the wireless metadata in an OmniPeek capture – the same frame viewed in OmniPeek itself shows Signal dBm, Noise Level and Noise dBm:
Netmon 3.4

Applying wireless files as Wireshark columns.
It is often much easier to understand what is going on with a wireless sniff if you have applied the wireless fields as columns. Here is how to do this:
1. Locate the field of interest in the packet details section (first expanding the applicable header section, if necessary) and right-click it. Choose Apply as Column:

2. The new column appears. Now you can resize, rename (by right clicking the column header and select Edit Column Details), and move the column as desired.
3. Repeat for other columns of interest. Now you have a better handle on the physical layer aspects of your capture.
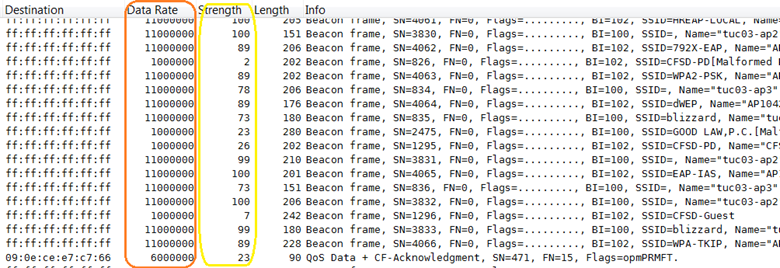
4. Once you have applied the new column, the next time you run Wireshark, the column is available (if you do not see it, right-click the column headers and select Displayed Columns.)
802.11 Sniffer Capture Analysis - Wireshark Filtering
Introduction
'802.11 Sniffer Capture Analysis -Wireshark filtering
Wireshark Filtering-wlan
Objective
This document can help guide you in how to set up the wireshark and analyze the interesting packets that use a versatile tool within the wireshark program called the wireshark filters.
Prerequisites
The wireshark tool in itself does not help you get through the troubleshoot process unless you have good knowledge and understand the protocol, the topology of the network and which data points to consider to take sniffer traces. This is true whether it is for a wired or for a wireless network where we capture the packets over the air before they are put on the network. The stripping of the wireless mac address is done by the by the AP.
Why Do We Need to Capture Wireless Sniffer Trace
When you inspect a traffic or data on a wired network that uses wired sniffer trace and can not find our interesting packets, you need to know where it misses. Your suspicion can get you to verify if it even made it through the first point of the source of origination which being wireless, works fine or not (being missed over the air). If it did not make it correctly over the air, then it obviously is not there, or cannot get translated, or sent over to the wired side by the AP to the DS or distribution system. It then becomes critical for you to identify and localize the wireless network issue using wireless sniffer trace.
Why Do We Need to Use Wireless Sniffer Capture Filter
When it comes to troubleshooting network related issues, there are many dependencies, and all work in layered model and each layer of data depends on its lower layer under it. There are many components, or network elements, and configuration and proper operation of the devices that help us achieve a smooth running network. When a working network stops functioning, a logical approach is required to localize the issue. Once identified, the exact point of failure is difficult to find. In those situations, sniffer comes to our aid. This troubleshooting process can become complicated despite your best approach and even when you have a good knowledge of troubleshooting skills. The problem is that if you capture the packets that travel through a network device, you can have huge files and can even end up at 1G if you capture long enough with a lot of packets details in it. With such a large amount of data, it can be very time consuming to pin point the problem, and gets to be a very difficult task. Filtering comes to your rescue and can help you spot the problems quickly, and eliminate the unwanted traffic, and cut down on the variables to focus on at one time. This helps in quickly finding whether the interesting traffic is present or absent from the traffic collected.
- Display Filters – after you capture a lot of information, they help you to visualize only the packets that you are interested in.
- Capture Filters – from the beginning you know what the packet of interest is for you and capture only those packets.
- Filters for coloring the packets - this is used as a visual aid to enhance the display filter or capture filter, or can be used without any filter to classify the many different packets as various colors for high level approach.
When to Use Display Filters and Capture Filters
It is recommended to use the Capture filters when you know what to look for and try to verify that in running traffic to that event. It is captured when you run that for more than a couple of hours in a heavy traffic environment. This helps keep the data collected to be a reasonable amount in terms of file size.
If you are at a point where you are not sure what can cause the issue, and it is more of a behavioral random nature, then run the packet capture for less time within the probable window of problem occurrence pattern, like one or two hours, and capture all the traffic. Then, use Display filters to visualize only the information that you are searching for. Besides this use, one can see all the capture and use coloring rules to catch the attention of certain type of packets assigned different colors for easy sorting or distinguishing packet flow.
How to Filter
You must understand the various fields within a typical wireshark sniffer trace. Break it down and define each field.
You focus on 3 items which you need to understand to use Filtering.
- Capture filter
- Display Filter
- Coloring rules Filter
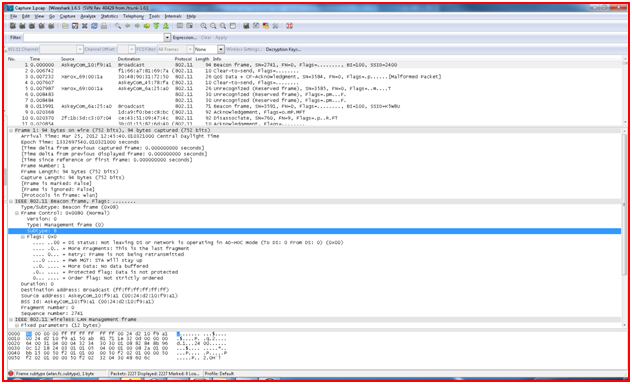
Before you delve into the details, here is the example of the sniffer capture window for wireshark.
MENU BAR

This is the Menu bar of the wire shark window.
It contains these items:
- File - This menu contains items to open and merge capture files, save / print / export capture
files in whole or in part, and to quit Wireshark.
- Edit - This menu contains items to find a packet, time reference or mark one or more
packets, handle configuration profiles, and set your preferences; (cut, copy, and paste
are not presently implemented).
- View - This menu controls the display of the captured data, it includes colorization of
packets, zoom function for the font, shows a packet in a separate window, expands and
collapses trees in packet details.
- Go - This menu contains items to go to a specific packet.
- Capture - This menu allows you to start and stop captures and to edit capture filters.
- Analyze - This menu contains items to manipulate display filters, enable or disable the
dissection of protocols, configure user specified decodes and use a TCP stream.
- Statistics - This menu contains items to display various statistic windows that includes a summary
of the packets that have been captured, display protocol hierarchy statistics, and much
more.
- Telephony - This menu contains items to display various telephony related statistic windows,
that include a media analysis, flow diagrams, display protocol hierarchy statistics and
much more.
- Tools - This menu contains various tools available in Wireshark, such as how to create Firewall
ACL Rules.
- Internals - This menu contains items that show information about the internals of Wireshark.
- Help - This menu contains items to help the user, for example, access to some basic help, manual
pages of the various command line tools, online access to some of the webpages,
and the usual about dialog.
The Main TOOL BAR

The main toolbar provides quick access to frequently used items from the menu. This toolbar cannot be customized by you, but it can be hidden with the View menu, if the space on the screen is needed to show even more packet data. As in the menu, only the items useful in the current program state can be available. The others can be grayed out. (For example, you cannot save a capture file if you have not loaded one).
The Filter Toolbar

The filter toolbar lets you quickly edit and apply display filters.
Filter: Brings up the filter construction dialog, The Capture Filters and Display Filters dialog boxes.
- Filter the input in the area to enter or edit a display filter string expression. A syntax check of your filterstring is done while you type. The background turns red if you enter an incomplete or invalid string, and becomes green when you enter a valid string. You can click the pull down arrow to select a previously-entered filter string from a list. The entries in the pull down list remain available even after a program restart.
- After you have changed something in this field, do not forget to press the Apply button (or the Enter/Return key), to apply this filter string to the display. This field is also where the current filter in effect is displayed.
- Expression: The middle button labeled Add Expression... opens a dialog box that lets you edit a display filter from a list of protocol fields described in, The Filter Expression dialog box.
- Clear resets the current display filter and clears the edit area.
- Apply the current value in the edit area as the new display filter.
The Packet List Pane
The packet list pane displays all the packets in the current capture file.
Each line in the packet list corresponds to one packet in the capture file. If you select a line in this pane, more details are displayed in the Packet Details and Packet Bytes panes.

The Packet Details Pane
The packet details pane shows the current packet (selected in the Packet List pane) in a more detailed form.

The Packet Bytes Pane
The packet bytes pane shows the data of the current packet (selected in the Packet List pane) in a
hexdump style.

The Statusbar
The statusbar displays informational messages. In general, the left side shows context related information, the middle part shows the current number of packets, and the right side shows the selected configuration profile. Drag the handles between the text areas to change the size.
The initial Statusbar
This statusbar is shown while no capture file is loaded. For example, when Wireshark is started.

The context menu (right mouse click) of the tab labels shows a list of all available pages. This can be helpful if the size in the pane is too small for all the tab labels.
The Statusbar

The status bar displays informational messages. In general, the left side shows context related information, the middle part shows the current number of packets, and the right side shows the selected configuration profile. Drag the handles between the text areas to change the size.
The Status bar with a loaded capture file.
- The left side shows information about the capture file, its name, its size and the elapsed time while it was captured.
- The colorized bullet on the left shows the highest expert info level found in the currently loaded capture file. Hovering the mouse over this icon shows a textual description of the expert info level, and when you click the icon, it can bring up the Expert Infos dialog box.
- The middle part shows the current number of packets in the capture file.
These values are displayed:
- Packets - the number of captured packets
- Displayed - the number of packets currently being displayed
- Marked - the number of marked packets
- Dropped - the number of dropped packets (only displayed if Wireshark was unable to capture all packets)
- Ignored - the number of ignored packets (only displayed if packets are ignored)
- The right side shows the selected configuration profile. Click this part of the statusbar to bring up a menu with all available configuration profiles, and to select from this list changes the configuration profile.
Use Capture Filters
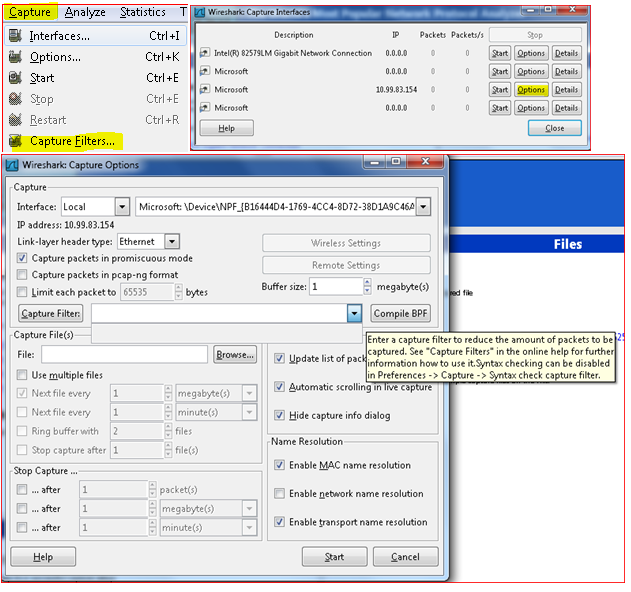
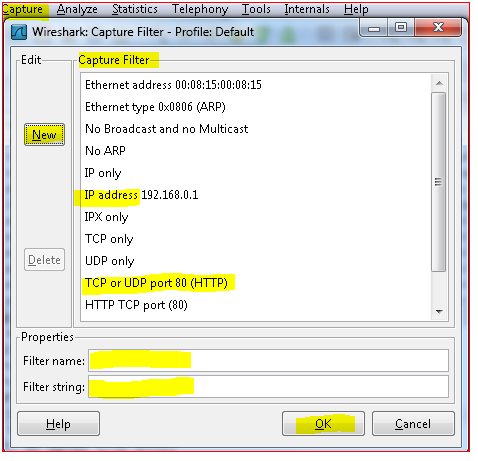
Click Capture Interfaces options and choose the Network adapter from drop down menu which is used to capture running packets in the network on the PC. Click the Capture Filters and enter the filter name and filter string or directly input the filter string you know in the box. Then hit button. Now the wire shark sniffer program captures packets which are of interest to you only among the huge flow of real time packets of all types of protocols .
Display Filter
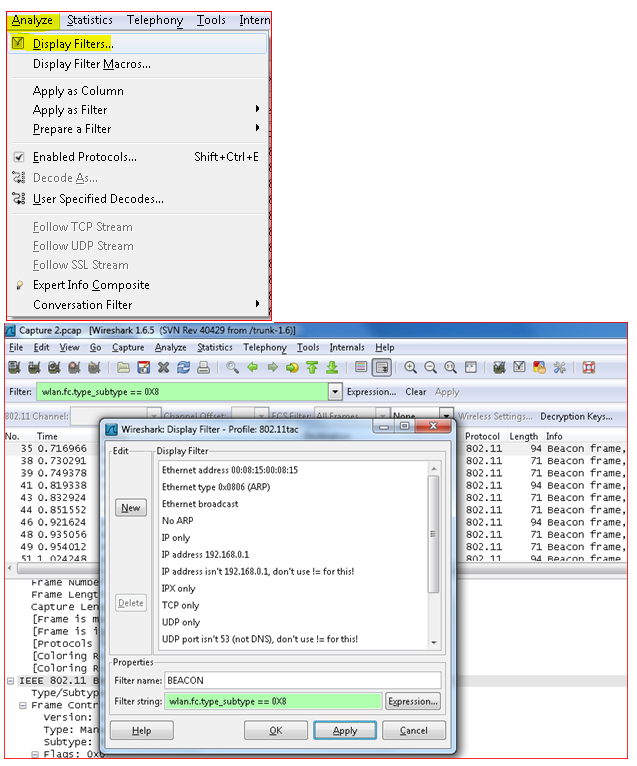
Once you have the captured file loaded, you now set up filters to display packets you are interested in or avoid packets you are not interested in. This can be done through simple filter expression or a combination of expression that uses logical operators to form a complex filer string.
Click Analyze. Choose Display Filter.
In this example, you are creating a filer to filter out only the Beacon packets from a 802.11 wireless packet capture trace as seen in the yellow highlighted areas.
Similar to the display filter, you can find a particular packet by applying filter after you click Find packet.
Find the Filter button and enter the filter value in the filter box. If you do not know the string, then you can dig further and click filter and hit New button and name the filter strings and apply or type the filter string in the box. If you do not know the specific filter spring, you can form it ad choose the Expression button which has various protocol options.
Choose the one you want, expand, and you get more options to choose from.
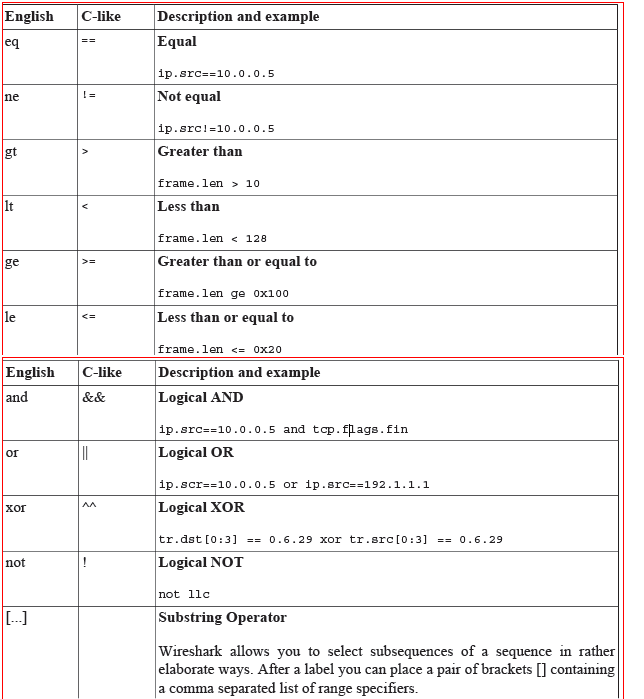
You also have a Logical operator box to choose from to use to match to input the value you want to put and apply completing the filter.
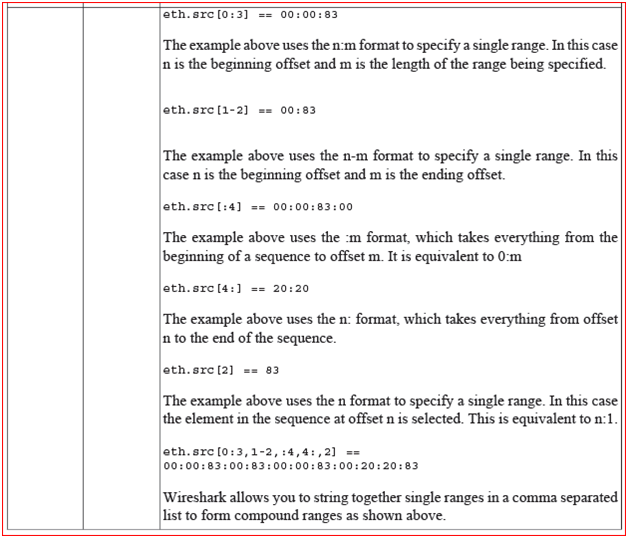
You can build display filters that compare values that use a number of different comparison operators.
Use Coloring Filter Rule
A very useful mechanism available in Wireshark is packet colorization. You can set-up Wireshark so that it colorizes packets according to a filter. This allows you to emphasize the packets you are interested in. You can set-up Wireshark so that it can colorize packets according to a filter you choose to create. This allows you to emphasize the packets you are (usually) interested in.
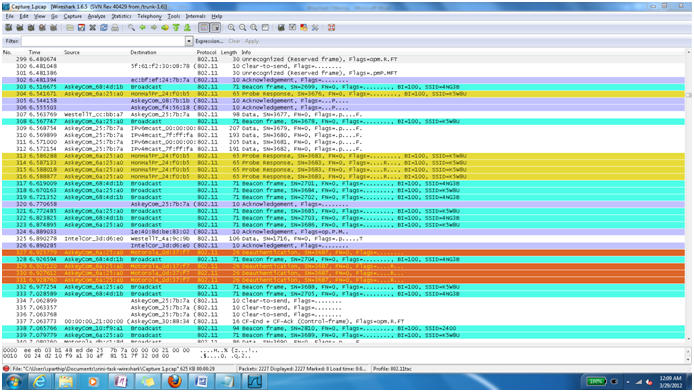
In the example, the packets are colorized for Beacons, Acknowledgement, Probe Response, and Deauthentication based on the filters mentioned.
Click View. ChooseColoring rules or Edit coloring rules from the main tool bar.
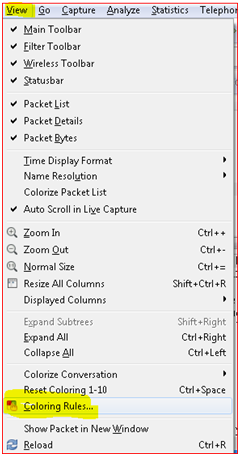
This opens the coloring rules and you can add a new coloring filter using New or Edit. Choose the packet, or edit the filter string, and assign or adjust the color desired.
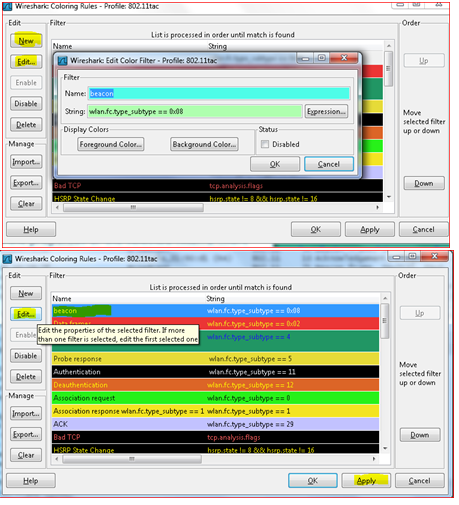
In the Edit Color dialog box, simply enter a name for the color filter, and enter a filter string in the Filter text field. The Edit Color Filter dialog box shows the values beacon and wlan.fc.type_subtype == 8 which means that the name of the color filter is Beacon and the filter can select protocols of type wlan.fc.type_subtype == 8 which is the beacon filter string. Once you have entered these values, you can choose a foreground and background color for packets that match the filter expression. Click Foreground color... or Background color... to achieve this.
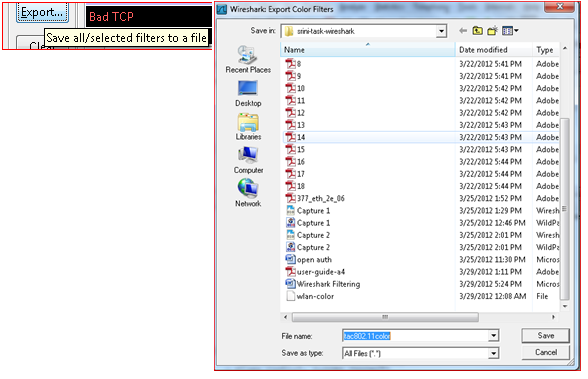
A very useful feature is to export or form the coloring filter and save it by exporting the filter to a file “ tac80211color” as seen in the example. This can be imported. You can create multiple coloring rule files in your troubleshoot folder and use it as a template for your convenience every time you troubleshoot.
You can think innovatively and tailor make coloring filter template files such as routing, wlan, switching and so on. Color filter files and just import them depending on the problem you want to troubleshoot.
There is a good coloring rules download which you can download and use Support Forum - Coloring Rules
This is how the final look of the wireshark packets window looks like after color filter file
tac80211color is imported and applied.
802.11 Sniffer Capture Analysis - Management Frames and Open Auth
Introduction
802.11 Sniffer Capture Analysis - Management Frames and Open Auth
802.11 – Frames and Open Authentication
When you try to analyze or troubleshoot a wireless LAN network that uses 802.11 packet analyzer requires you to have a thorough understanding of different 802.11 frame types as a basis to find pointers to localize the causes of the problem area in a wlan network . Take wlan sniffer traces that use tools like omnipeek and / or wireshark where you can monitor the communications between radio network interface cards (NICs) and access points. You need to comprehend each frame type occurring in the operation of a wireless LAN and solves network problems. In a wlan RF environment the radio transmission conditions can change so dynamically, coordination becomes a large issue in WLANs. Management and control packets are dedicated to these coordination functions.
To find cause of the wlan problems that occurs in the wlan network relating to RF environment, it would be best to test the wlan network using open authentication without any security. When you take this approach, the RF connectivity issues surface and can be corrected before you can move to stronger encryption and higher layers of the OSI layer. Authentication in the 802.11 specification is based on authenticating a wireless station or device instead of authenticating a user.
As per the 802.11 specification client authentication process, these are the transactions as mentioned.
- The Access points continuously send out Beacon Frames which are picked up by the nearby wlan clients.
- The client can also broadcast on its own probe request frame on every channel.
- Access points within range respond with a probe response frame.
- The client decides which access point (AP) is the best for access and sends an authentication request.
- The access point sends an authentication reply.
- Upon successful authentication, the client sends an association request frame to the access point.
- The access point replies with an association response.
- The client is now able to pass traffic to the access point.
802.11 Client Authentication Process

There are 3 types of frames used in the 802.11 MAC layer 2 communications that happen over the air which manages and controls the wireless link.

They are Management Frames, Control Frames and Data frames. You can learn what those frames consist of in detail to help you to analyze the wlan problems better while you work with wlan sniffer traces.
Management Frames
802.11 management frames enable stations to establish and maintain communications. Management packets are used to support authentication, association, and synchronization.
These are common 802.11 management frame subtypes:
- Authentication frame: This is a frame that signifies to the network membership within the wlan topology. 802.11 authentications is a process whereby the access point either accepts or rejects the identity of a radio NIC to create resources. Authentication restricts the ability to send and receive on the network. It is the first step for a device to attempt to connect to an 802.11 WLAN. The function is handled by an exchange of management packets .Authentication is handled by a request/response exchange of management packets. The number of packets exchanged depends on the authentication method employed.
wlan.fc.type_subtype == 0x0b


The NIC begins the process by sending an authentication frame containing its identity to the access point. With open system authentication (the default), the radio NIC sends only one authentication frame, and the access point responds with an authentication frame as a response indicating acceptance (or rejection). There is an associated authentication ID associated which is the name under which the current station is authenticated itself on joining the network.
- Deauthentication frame: This is an announcement packet by a station which sends a deauthentication frame to another station if it wishes to terminate secure communications. It is a one-way communication from the authenticating station (a BSS or functional equivalent), and must be accepted. It takes effect immediately.
wlan.fc.type_subtype == 0x0c


- Association request frame: 802.11 associations enable the access point to allocate resources for and synchronize with a radio NIC. A NIC begins the association process by sending an association request to an access point. This frame carries information about the NIC (for example, supported data rates) and the SSID of the network it wishes to associate with. After receiving the association request, the access point considers associating with the NIC, and (if accepted) reserves memory space and establishes an association ID for the NIC. Packets can show the current association of the sender. Association and Reassociation are handled by request/response management packets.
wlan.fc.type_subtype == 0x0


- Association response frame: An access point sends an association response frame that contains an acceptance or rejection notice to the radio NIC that requests association and includes the Association ID of the requester. If the access point accepts the radio NIC, the frame includes information regarding the association, such as association ID and supported data rates. If the outcome of the association is positive, the radio NIC can utilize the access point to communicate with other NICs on the network and systems on the distribution side of the access point.
wlan.fc.type_subtype == 0x01


- Reassociation request frame: This frame is similar to a association request but has a different purpose and is mainly useful in client roaming where in If a radio NIC roams away from the currently associated access point and finds another access point that has a stronger beacon signal, the radio NIC and sends a reassociation frame to the new access point. The new access point then coordinates the forwarding of data frames that can still be in the buffer of the previous access point waiting for transmission to the radio NIC. The sender must already be authenticated in order to gain a successful association.
wlan.fc.type_subtype == 0x02


- Reassociation response frame: An access point sends a reassociation response frame containing an acceptance or rejection notice to the radio NIC requesting reassociation. Similar to the association process, the frame includes information regarding the association, such as association ID and supported data rates.
- Disassociation frame: A station sends a disassociation frame to another station if it wishes to terminate the association. For example, a radio NIC that is shut down gracefully can send a disassociation frame to alert the access point that the NIC is powering off. The access point can then relinquish memory allocations and remove the radio NIC from the association table. Disassociation is a simple declaration from either an access point or a device.
The filter used to apply and find only the Disassociation packets is wlan.fc.type_subtype == 0x0a.


- Beacon frame: The access point periodically sends a beacon frame to announce its presence and relay information, such as timestamp to help synchronize member stations with the BSS, SSID, and other parameters regarding the access point to radio NICS that are within range. The purpose of this frame is to announce the beginning of a Contention Free period (CF), and which the right to transmit is conferred by the access point by polling. Radio NICs continually scan all 802.11 radio channels and listen to beacons as the basis to choose which access point has the best signal and availability to be associated with.
The filter used to apply and find only the Beacon packets is wlan.fc.type_subtype == 0x08.


- Probe request frame: A station or client becomes active or on a PC when the wlan card it enabled it becomes active and sends a probe request frame when it needs to obtain information from another station or access point. After a radio NIC sends out a probe request to determine which access points are within range, the probe request frame is sent on every channel the client supports in an attempt to find all access points in range that match the SSID and client-requested data rates..It is up to the client to determine which access point to associate to by weighing various factors like supported data rates and access point load to select optimal access point and thus move to the authentication phase of 802.11 network after it gets responses from Aps as probe response. This mechanism support also helps the roaming station in the ability to move between cells while it remains connected in the search for new access point.
The filter used to apply and find only the Probe request packets is wlan.fc.type_subtype ==0x04.


- Probe response frame: In response to the probe request, APS with matching criteria respond with a probe response frame that contains synchronization information and access point load and would contain capability information, supported data rates, and so on.
The filter used to apply and find only the Probe request packets is wlan.fc.type_subtype ==0x05.


Control Frames
802.11 control frames assist in the delivery of data frames between stations. These are the common 802.11 control frame subtypes:
- Request to Send (RTS) frame: The RTS/CTS function is optional and reduces frame collisions present when hidden stations have associations with the same access point. A station sends a RTS frame to another station as the first phase of a two-way handshake necessary before sending a data frame.
wlan.fc.type_subtype == 0x1B


- Acknowledgement (ACK) frame: After receiving a data frame, the receiving station utilizes an error to check processes to detect the presence of errors. The receiving station sends an ACK frame to the sending station if no errors are found. If the sending station does not receive an ACK after a period of time, the sending station can retransmit the frame.
wlan.fc.type_subtype == 0x1D


Data Frames
These are the frames that come later in the game after the basic wlan communication is already established between the Mobile station and the Access point. You always reach to the 802.11 data frame for analysis, typically to verify and analyze over the air if the protocols and data from higher layers within the frame body get through to the wire. These frames transport data packets from higher layers, such as web pages, printer control data, and so on within the body of the frame.
wlan.fc.type_subtype == 0x20


On a packet analyzer, you can observe the contents of the frame body within 802.11 data frames for interesting traffic in question.
References
802.11 Sniffer Capture Analysis - WPA/WPA2 with PSK or EAP
WPA-PSK(TKIP)
1.Beacon frames are transmitted periodically to announce the presence of wireless network and contain all information about it (data rates, channels, security ciphers, key management and so on):
![]()
2.Probe request is sent by STA to obtain information from AP:

3.Probe response. AP responds with a probe response frame that contains capability information, supported data rates, and so on after it receives a probe request frame from STA:

4.802.11 authentication is a process whereby the access point either accepts or rejects the identity of a radio NIC. The NIC begins the process by sending an authentication frame that contains its identity to the access point. With open system authentication (the default), the radio NIC sends only one authentication frame, and the access point responds with an authentication frame as a response that indicates acceptance (or rejection).:
a.Dot11 authentication request:

b.Dot11 authentication response:

5. 802.11 association enables the access point to allocate resources for and synchronize with a radio NIC. A NIC begins the association process by sending an association request to an access point. This frame carries information about the NIC (for example, supported data rates) and the SSID of the network it wishes to associate with.
a.Dot11 association request:

After receiving the association request, the access point considers associating with the NIC, and (if accepted) reserves memory space and establishes an association ID for the NIC.
b.Dott11 association response:

6.4-way handshake. During this phase PTK is created, and PSK is used as PMK to construct those values:
a.AP sends 802.1x authentication frame with ANonce. STA now has all the information to construct PTK:

b.STA responds with 802.1x authentication frame with SNonce and MIC:

c.AP constructs 802.1x frame with new MIC and GTK with sequence number. This sequence number is used in the next multicast or broadcast frame, so that the receiving STA can perform basic replay detection:

d.STA sends ACK:

From that point all data is sent encrypted.
WPA2-PSK(AES/TKIP)
The process is fairly the same as in previous section. Only information that is different is highlighted.
1.WPA2 AP management frame includes RSN element that included unicast cipher suite, AKM information and GTK cipher suite (if both AES and TKIP are selected, then a less stronger encryption method can be used for GTK).

2. During 4-way handshake, frames contain version information for WPA2 in Type fields.


Note: You can decrypt WEP/WPA-PSK/WPA2-PSK encrypted wireless traffic if 4-way handshake key exchange frames are included in trace and PSK is known.
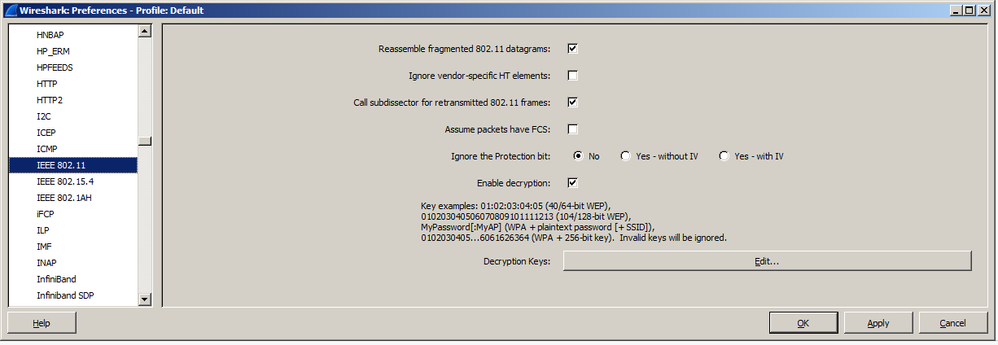
In order to encrypt wireless traffic in wireshark, navigate to Preferences-> Protocols->IEEE 802.11 and provide PSK information and choose Enable decryption option.
To decrypt WPA/WPA2 encrypted traffic specify Key in format:
wpa-psk:PSK:SSI

Note: In order to filter out WLAN traffic from specific STA in wireshark, you could use WLAN Statistic option.
In order to filter traffic from specific STA, navigate to Statistics > WLAN Traffic. From the list of SSIDs, choose the corresponding SSID that STA is associated with, and apply filter based on the STA.

How to Decrypt WPA2 AES Data on Over the Air Packet Captures with Wireshark
Requirements:
- Capture is on .pcap format.
- Frames are presented in 802.11 format.
- Know the SSID name and PSK for the WLAN from which Over the Air Capture has been collected.
- Key: Capture the 4 EAPOL 4 way handshake.
The most accurate process to do this is to start the capture and then de-authenticate the client in order to catch the process from zero, meaning that the 4 way EAPOL handshake can be included.
If frames are within another format, like PEEKREMOTE it can be required to decode them, please see section on how to Decode PEEKREMOTE frames.
Process
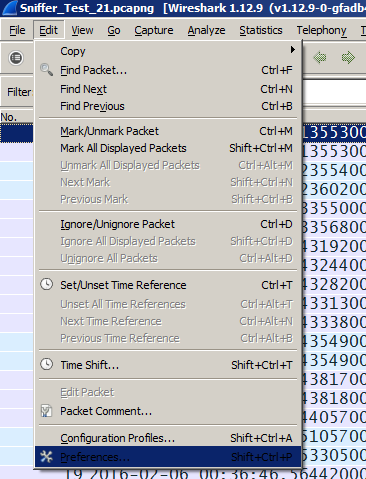
Once capture has been opened in Wireshark, navigate to Edit > Preferences Menu.
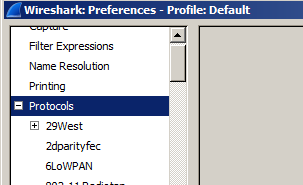
Go to Protocols menu and look for IEEE 802.11.
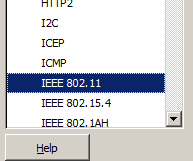
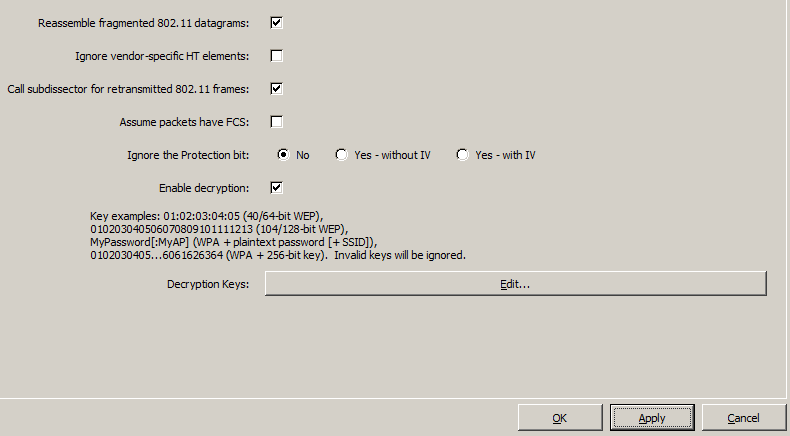
From IEEE 802.11 section, check the Enable Decryption check box and click Edit… button next to Decryption Keys label.
Once in the Edit menu, click the New button on the left side of the window.
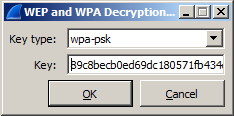
From the key type choose wpa-psk.
In order to obtain the key, it is important to know the exact name of SSID and PSK for which decrypt process is conducted.
Have these two values and navigate to the next website to generate the key based on these two elements.
Type the SSID name and the PSK in the specified fields. String typed into the fields must be exact as defined for SSID and for PSK.
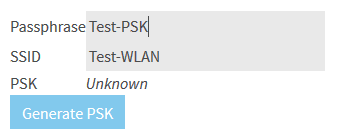
Once values have been defined, click Generate PSK. This generates the key, copies it and goes back to Wireshark.

Paste the key that was generated into the Key field. Click OK.
Then click Apply at the Preferences screen. Capture begins to be decoded.
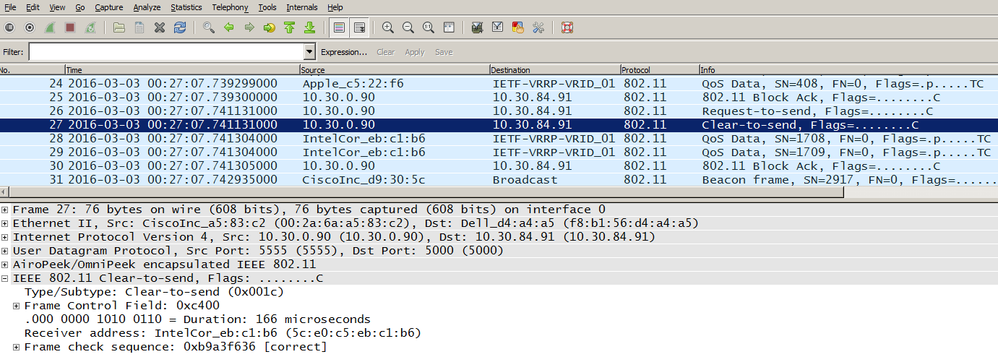
Once decoded, it is possible to see contents of 802.11 packets that were previously ciphered.
WPA/WPA2 Enterprise
1. WPA(TKIP)/WPA2(AES) with dot1x (PEAP)
This process uses the same steps like the previous except for the AKM method and PTK/GTK and AP advertised attributes in 802.11 management frames.
- In this example, AP advertises WPA(TKIP)/WPA2(AES) with dot1x authentication, both RSN and WPA tag attributes for AKM contain WPA value, whether in case of PSK authentication this field contains PSK. Also in this example, TKIP is used for WPA and AES is used for WPA2.

b. STA chooses one of authentication methods and cipher suites advertised by AP. In this case, WPA2 with AES was selected. That can be seen in RSN IE parameters.
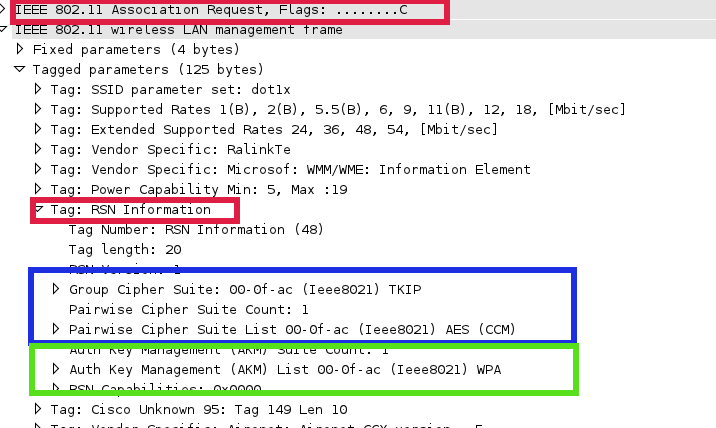
c. After successful dot11 association, dot1x authentication takes place. In this process, we can see what EAP method is used by STA for authentication and certificate(s) exchange information between supplicant and AAA server.

d. After successful dot1x authentication, PMK is transmitted to AP in Access-Accept message from AAA server and the same PMK is derived on the client. Next 4-way handshake takes place and PTK and GTK are established.
Radius exchange between WLC and AAA server:

General flow diagram:

WPA(TKIP)/WPA2(AES) with dot1x (EAP-TLS)
Difference between this type of authentication compared to the previous one is that client provides its certificate in “Client Hello” message and mutual authentication is performed between client and AAA server based on certificates.
EAP exchange between STA and WLC:

Radius exchange between WLC and AAA server:

General flow diagram:

2.WPA(TKIP)/WPA2(AES) with dot1x (FAST)
Only dot1x authentication stage is a bit different than compared to the previous example. After successful dot11 association dot1x authentication takes place, AP sends dot1x identity request to the STA and STA provides identity response. The response depends on what PAC provisioning has been in use (in-band PAC provisioning (phase 0) or out-of-band PAC provisioning). In case of in-band provisioning, PAC is sent to the client from AAA server. Once client has PAC, it goes to EAP-FAST phase1 from this point TLS tunnel establishment starts (phase 1).

After TLS tunnel is established, inner authentication method (phase 2) starts inside encrypted tunnel. On successful authentication, PMK is sent in Access-Accept message to AP from AAA server. The same key is derived based on dot1x exchange on STA. This key (PMK) is used to calculate PTK during 4-way handshake that can be used to secure communication between STA and AP.
General flow diagram:

802.11 Sniffer Capture Analysis – Multicast
Introduction
Multicast Sniffing
Solution
The controller performs multicasting in two modes:
- Unicast mode — In this mode, the controller unicasts every multicast packet to every AP associated to the controller. This mode is inefficient but can be required on networks that do not support multicasting.
- Multicast mode — In this mode, the controller sends multicast packets to an LWAPP multicast group. This method reduces overhead on the controller processor and shifts the work of packet replication to your network which is much more efficient than the unicast method.
- You can enable multicast mode that uses the controller GUI or CLI.
IGMP Snooping on WLC
In controller software release 4.2, IGMP snooping is introduced to better direct multicast packets. When this feature is enabled, the controller gathers IGMP reports from the clients, processes the reports, creates unique multicast group IDs (MGIDs) from the IGMP reports after it checks the Layer 3 multicast address and the VLAN number, and sends the IGMP reports to the infrastructure switch. The controller sends these reports with the source address as the interface address on which it received the reports from the clients.
The controller then updates the access point MGID table on the AP with the client MAC address. When the controller receives multicast traffic for a particular multicast group, it forwards it to all the APs. However, only those APs that have active clients who listen or subscribe to that multicast group send multicast traffic on that particular WLAN. IP packets are forwarded with an MGID that is unique for an ingress VLAN and the destination multicast group. Layer 2 multicast packets are forwarded with an MGID that is unique for the ingress interface.

Note: IGMP snooping is not supported on the 2000 series controllers, the 2100 series controllers, or the Cisco Wireless LAN Controller Network Module for Cisco Integrated Services Routers.
Guidelines for Using Multicast Mode
Use these guidelines when you enable multicast mode on your network:
The Cisco Unified Wireless Network solution uses some IP address ranges for specific purposes. Keep these ranges in mind when you configure a multicast group. Although not recommended, any multicast address can be assigned to the LWAPP multicast group; this includes the reserved link local multicast addresses used by OSPF, EIGRP, PIM, HSRP, and other multicast protocols.
Cisco recommends that multicast addresses be assigned from the administratively scoped block 239/8. IANA has reserved the range of 239.0.0.0-239.255.255.255 as administratively scoped addresses for use in private multicast domains. See the note for additional restrictions. These addresses are similar in nature to the reserved private IP unicast ranges, such as 10.0.0.0/8, defined in RFC 1918. Network administrators are free to use the multicast addresses in this range inside of their domain without fear of conflict with others elsewhere in the Internet. This administrative or private address space must be used within the enterprise and its leave or entry blocked from the autonomous domain (AS).

Note: Do not use the 239.0.0.X address range or the 239.128.0.X address range. Addresses in these ranges overlap with the link local MAC addresses and flood out all switch ports, even with IGMP snooping turned on.
Cisco recommends that enterprise network administrators further subdivide this address range into smaller geographical administrative scopes within the enterprise network to limit the scope of particular multicast applications. This prevents high-rate multicast traffic that leaves a campus (where bandwidth is plentiful) and congests the WAN links. It also allows for efficient filtering of the high bandwidth multicast from reaching the controller and the wireless network.
When you enable multicast mode on the controller, you must configure an LWAPP multicast group address on the controller. APs subscribe to the LWAPP multicast group using Internet Group Management Protocol (IGMP).
- Cisco 1100, 1130, 1200, 1230, and 1240 APs use IGMP versions 1, 2, and 3. However, Cisco 1000 Series APs use only IGMP v1 to join the multicast group.
- Multicast mode works only in Layer 3 LWAPP mode.
- APs in monitor mode, sniffer mode, or rogue detector mode do not join the LWAPP multicast group address.
- When you use controllers that run version 4.1 or earlier, you can use the same multicast address on all the controllers. If you use controllers that run version 4.2 or later, the LWAPP multicast group configured on the controllers must be different for each controller used on the network.
- If you use controllers with version 4.1 or earlier, the multicast mode does not work across intersubnet mobility events, such as guest tunneling, site-specific VLANs, or interface override that uses RADIUS. The multicast mode does work in these subnet mobility events when you disable the Layer 2 IGMP snooping/CGMP features on the wired LAN.
In later versions, that is, 4.2 or later, the multicast mode does not operate across intersubnet mobility events, such as guest tunneling. It does, however, operate with interface overrides that use RADIUS (but only when IGMP snooping is enabled) and with site-specific VLANs (access point group VLANs).
- The controller drops any multicast packets sent to the UDP port numbers 12222, 12223, and 12224. Make sure the multicast applications on your network do not use those port numbers.
- Multicast traffic is transmitted at 6 Mbps in an 802.11a network. Therefore, if several WLANs attempt to transmit at 1.5 Mbps, packet loss occurs. This breaks the multicast session.
Configuring Multicast (Using Multicast-Multicast Mode)
Select Mutlicast - Multicast and configure your group, each WLC in your mobility group can use a unique address.
Enable multicast routing on the L3 device and enable PIM on these VLANs. Management, AP-Manger, VLAN on which the AP are in and as well as the VLAN where the clients that receive the multicast stream.
Example :
VLAN 40 is the WLC management, VLAN 40 is for AP, and VLAN 50 is where your clients are. So under all of these SVI you need to issue the multicast commands.
Issue all Multicast show commands to verify, for example, show ip mroute, show ip igmp groups to validate that the group for the AP is built properly.
You can also enable IGMP Snoping on the WLC. The WLC holds its own snooping table for the IGMP messages that it receives, so that it knows who requests the stream.
On Wireless LAN Controller
Enable Global Multicast on the WLC and Enable Multicast – Multicast mode on the WLC.
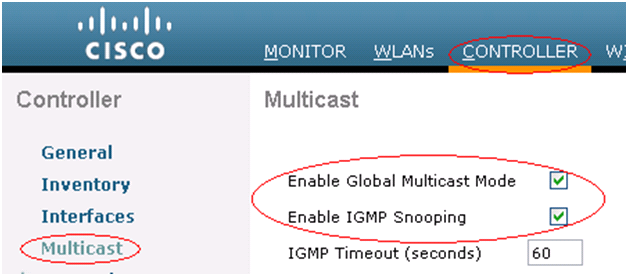

Once the client sends the multicast join, you see it on the WLC MGID.
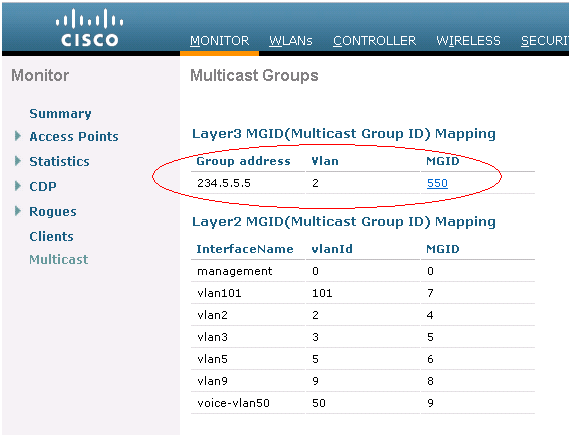
Multicast Configuration on Wired Network
Configure Multicast routing Globally and then enable PIM on each interface.
6504-WLCBUG#sh run | i multicast
ip multicast-routing
6504-WLCBUG#sh run int vla 50
Building configuration...
Current configuration : 119 bytes
!
interface Vlan50
description // WLAN DHCP pool VLAN //
ip address 172.16.1.1 255.255.255.0
ip pim dense-mode
end
6504-WLCBUG#sh run int vla 40
Building configuration...
Current configuration : 121 bytes
!
interface Vlan40
description // Management Vlan //
ip address 10.105.135.136 255.255.255.128
ip pim dense-mode
end
6504-WLCBUG#sh ip pim interface vlan 40
Address Interface Ver/ Nbr Query DR
DR Mode Count Intvl Prior
10.105.135.136 Vlan40 v2/D 0 30 1 10.105.135.136
6504-WLCBUG#sh ip pim interface vlan 50
Address Interface Ver/ Nbr Query DR DR
Mode Count Intvl Prior
172.16.1.1 Vlan50 v2/D 0 30 1 172.16.1.1
6504-WLCBUG#sh ip mroute
IP Multicast Routing Table
Flags: D - Dense, S - Sparse, B - Bidir Group, s - SSM Group, C - Connected,
L - Local, P - Pruned, R - RP-bit set, F - Register flag,
T - SPT-bit set, J - Join SPT, M - MSDP created entry,
X - Proxy Join Timer Running, A - Candidate for MSDP Advertisement,
U - URD, I - Received Source Specific Host Report,
Z - Multicast Tunnel, z - MDT-data group sender,
Y - Joined MDT-data group, y - Sending to MDT-data group
V - RD & Vector, v - Vector
Outgoing interface flags: H - Hardware switched, A - Assert winner
Timers: Uptime/Expires
Interface state: Interface, Next-Hop or VCD, State/Mode
(*, 239.255.255.255), 4d17h/00:02:03, RP 0.0.0.0, flags: DC
Incoming interface: Null, RPF nbr 0.0.0.0
Outgoing interface list:
Vlan40, Forward/Dense, 4d17h/00:00:00
(*, 239.254.0.3), 2w1d/00:02:07, RP 0.0.0.0, flags: DC
Incoming interface: Null, RPF nbr 0.0.0.0
Outgoing interface list:
Vlan40, Forward/Dense, 3d10h/00:00:00
(*, 224.0.1.40), 2w1d/00:02:13, RP 0.0.0.0, flags: DCL
Incoming interface: Null, RPF nbr 0.0.0.0
Outgoing interface list:
Vlan11, Forward/Dense, 2w1d/00:00:00
Packet Captures
Topology
Wired PC ----------- 6500 Switch -------- WISM ------- AP )))) ((((( Wireless Client
Vlan 50 Vlan 40 Vlan 40 Vlan 40 Vlan 50
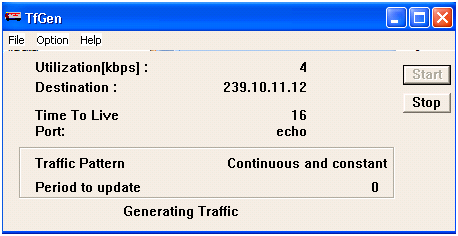
MCAST Traffic Generator Tool
Used on the Wired PC to Generate Multicast Stream – Continuous UDP packets.
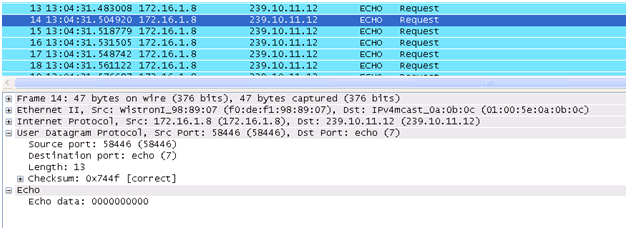
Wired Wireshark Packet Capture on the MCAST Generator
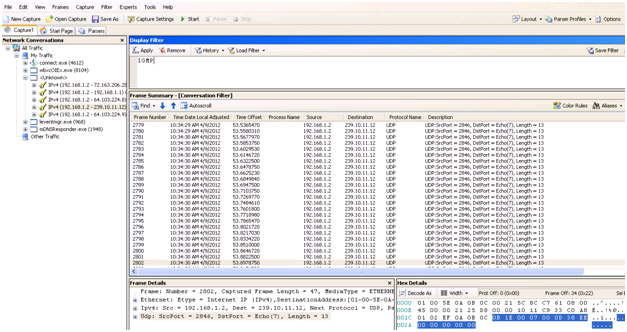
Windows Netmon Capture on the Mcast Packet Generator</h=5>
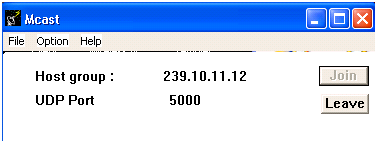
MCAST Receiver Tool is used on the Wireless Client to Receive the Multicast traffic from the Source (Wired PC).
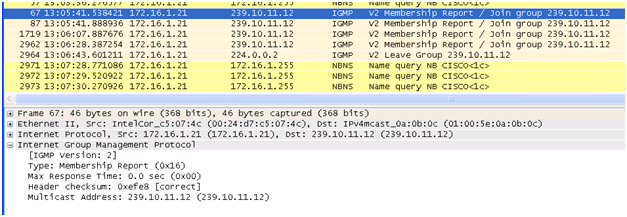
Wireshark Captures on the Wireless Interface of the Wireless client
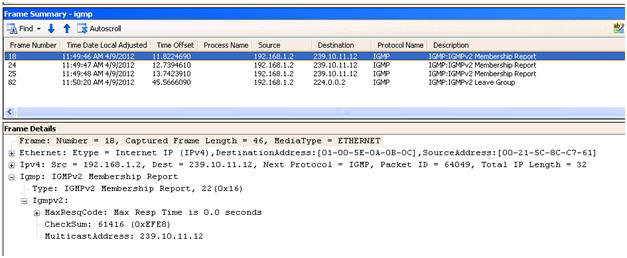
Netmon Capture on the Wireless Interface of the Wireless Client
Reference:
Revision History
| Revision | Publish Date | Comments |
|---|---|---|
3.0 |
16-Jan-2024 |
Updated SEO, Style Requirements, Machine Translation, Spelling and Formatting. |
2.0 |
10-Nov-2022 |
Article required major, multiple updates to comply with PII, biased language, machine translation, SEO, style requirements and other required items. |
1.0 |
20-Jun-2016 |
Initial Release |
Contributed by Cisco Engineers
- Aaron LeonardCustomer Delivery Engineering Technical Lead
- Shankar RamanathanPrincipal Engineer
Contact Cisco
- Open a Support Case

- (Requires a Cisco Service Contract)
 Feedback