Introduction
This document describes the log collection process for Cisco Emergency Responder (CER). A common scenario is used for illustration.
Prerequisites
Requirements
Cisco recommends that you have knowledge of these topics:
- Cisco Emergency Responder (CER)
- The Cisco ER Administration web page
- The Cisco ER Serviceability web page
Components Used
This document focuses on Cisco Emergency Responder, version 7.1 and greater.
The information in this document was created from the devices in a specific lab environment. All of the devices used in this document started with a cleared (default) configuration. If your network is live, make sure that you understand the potential impact of any command.
Background Information
If you work with a TAC engineer on a CER issue, at some point in time they are likely to ask you for logs from CER, possibly in addition to traces from CUCM.
For information on trace collection in Cisco Unified Communications Manager (CUCM), please see How to Collect Traces for CUCM 9.x, 10.x and 11.x.
In this scenario, you are troubleshooting an issue with Public Safety Answering Point (PSAP) callback failures. The TAC engineer has asked you to collect the detailed CER Server, detailed Java Telephony Application Programming Interface (JTAPI) and Event Viewer logs from the CER Publisher for the duration of a test call from the Public Switched Telephone Network (PSTN) to an Emergency Location Identification Number (ELIN).
To complete this task, you need to:
- Enable trace debugs and trace packages.
- Reproduce the issue and take notes.
- Gather the requested logs.
- Attach the log packages to your Service Request.
Enable Trace Debugs and Trace Packages
Detailed tracing and debugging is not enabled by default in CER. TAC has requested detailed logs for troubleshooting. Therefore, before reproducing the issue, enable detailed traces and debugs:
- Log on to the Cisco ER Administration web page, either as the application administrator or as a user with Emergency Responder System Admin Role permissions.
- Navigate System > Server Settings. The CER Publisher is selected by default.
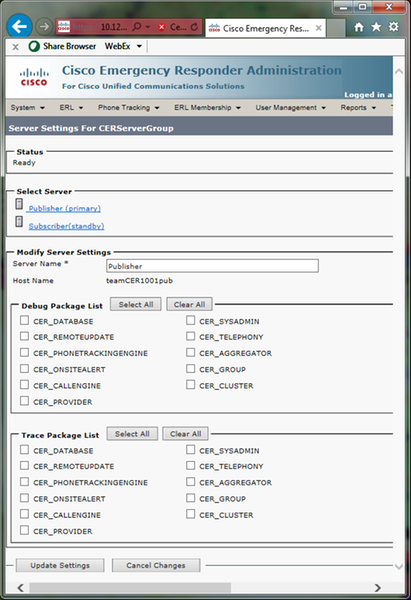
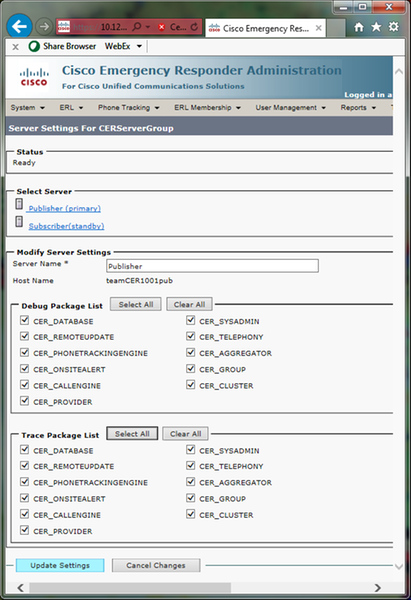
- In the Debug Package List section, click Select All.
- In the Trace Package List section, click Select All.
- Click Update Settings, as shown in the image:
- If TAC had also requested detailed logs from the CER Subscriber, you would select Subscriber(standby) in the Select Server section, and then repeat steps 3-5.
Disabling detailed tracing and debugging after issue reproduction, by deselecting all debug and trace packages, is optional. There are troubleshooting scenarios, such as troubleshooting intermittent phone tracking issues, in which you may need to leave detailed tracing and debugging on for a long period of time.
Reproduce the Issue and Take Notes
In our scenario, you would place an inbound call from the PSTN to an Emergency Location Identification Number (ELIN) to generate a failure. TAC needs the call details so that they can provide an analysis. In any troubleshooting scenario, providing details is important. Incorrect or missing information can hamper the investigation.
For each test call, please record this information for TAC:
- Calling party phone number
- Called party ELIN
- Call start time
- Call end time
- Result of call, success or failure.
Notify your TAC engineer of these details, either by phone, via email or through the Case File Uploader tool.
Gather the Requested Logs
Unlike some other Cisco Unified Communications products, you do not use the Real-Time Monitoring Tool to gather log files. In CER, log files may be downloaded from the Cisco ER Serviceability web page, under System Logs. The most frequently needed logs for CER application troubleshooting are in the System Logs > CER Logs menu.
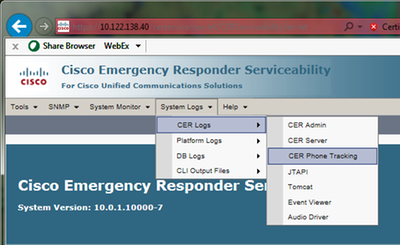
Depending on your exact troubleshooting scenario, TAC may request different sets of logs. For a switch tracking issue, they may request the CER Server, CER Phone Tracking and Event Viewer logs. For a backup failure issue, they may request the DRS logs from System Logs > Platform Logs. For more details on the available System Logs, please see the System Logs Menu section of the CER Administration Guide.
The Cisco ER Serviceability web page on the CER Publisher gives you access to the Publisher’s log files only. Log files for the CER Subscriber are obtained separately, by logging on to the Cisco ER Serviceability web page on the CER Subscriber itself.
For our scenario, TAC has requested detailed CER Server, detailed JTAPI and Event Viewer logs from the CER Publisher only.
- Log on to the Cisco ER Serviceability web page on the CER Publisher, either as the application administrator or as a user with at least Emergency Responder Serviceability Role permissions.
- Select System Logs > CER Logs > CER Server.
- The CER Server Log Files page opens.
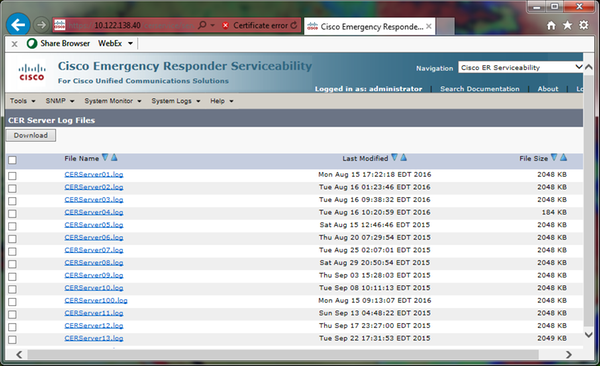
- Click the down arrow in the Last Modified column header. The log files are then sorted by date, in descending order.
- Locate the log files which cover the time range for the test call, and click the checkboxes to the right of each of the file names. Be generous - it is better to include too many files than too few.
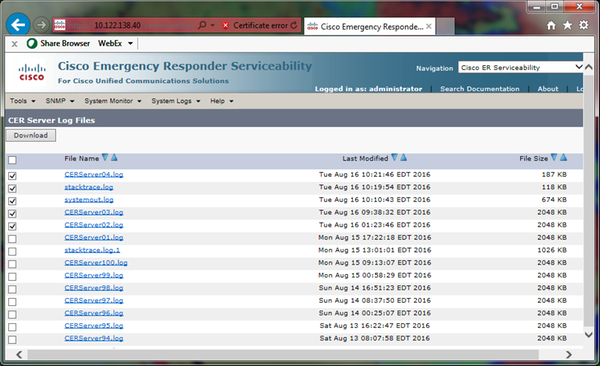
- Click Download. CER packages the selected files as a single CERServerLogs.zip archive file for your browser to download. Save to a new directory to keep your files organized.
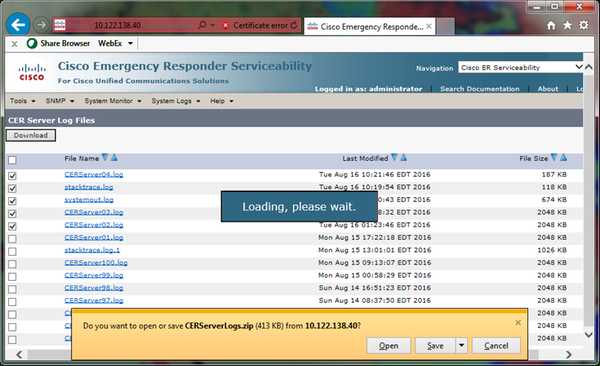
- Select System Logs > CER Logs > JTAPI, and repeat steps 4-6 to download a JTAPILogs.zip file.
- Select System Logs > CER Logs > Event Viewer, and repeat steps 4-6 to download an EventLogs.zip file.
File collection is now complete, as shon in the image:
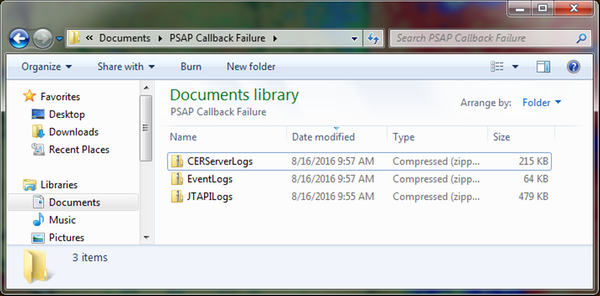
Attach the Log Packages to Your Service Request
Now that you have downloaded the CER Server, JTAPI and Event Viewer log packages, you need to attach those to your Service Request.
While these files might be small enough to travel over email, using the Case File Uploader tool is faster and eliminates guesswork.
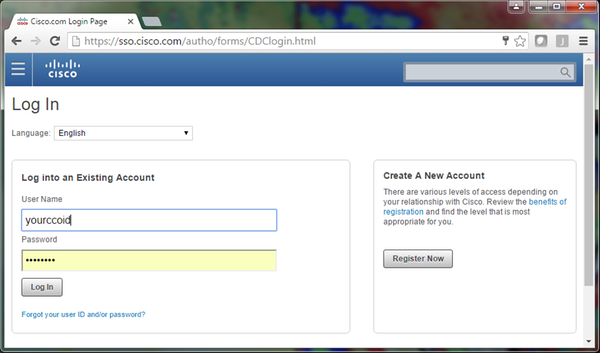
- Browse to https://cway.cisco.com/csc.
- You are redirected to a log in page. Log in with your CCO username and password, as shown in the image:
- This brings you to the Case File Uploader tool, as shown in the image:
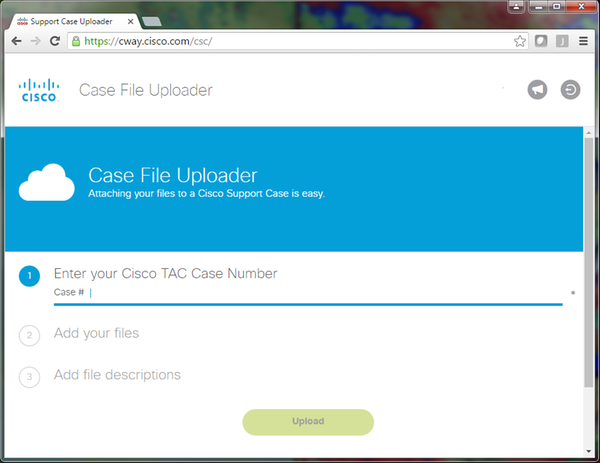
- The Case File Uploader tool displays an upload status. As shown in the image, wait for the upload to complete.
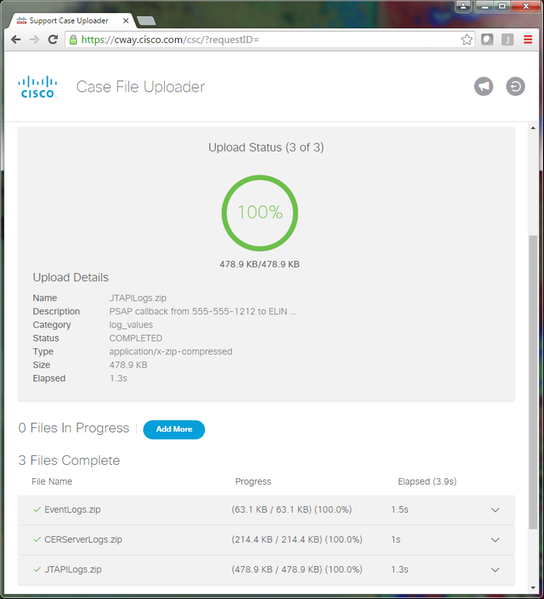
- Close the browser window.
Lastly, ensure that you have given your TAC engineer your issue reproduction notes, whether through the upload tool, via email, or on the phone.
Summary
You have just learned how to collect log files from CER for TAC. We covered enabling debugs and traces, reproducing the issue, gathering log files from the Cisco ER Serviceability web page, efficiently attaching files to your Service Request, and communicating issue reproduction notes with your TAC engineer.


 Feedback