Introduction
This document describes how to configure and troubleshoot Cisco Threat Intelligence Director (TID).
Prerequisites
Requirements
Cisco recommends that you know these topics:
- Firepower Management Center (FMC) administration.
You need to ensure these conditions before you configure the Cisco Threat Intelligence Director feature:
- The Firepower Management Center (FMC):
- Must run on 6.2.2 (or later) version (can be hosted on physical or virtual FMC).
- Must be configured with a minimum of 15 GB of RAM memory.
- Must be configured with REST API access enabled.
- The sensor must run 6.2.2 version (or later).
- In the Advanced Settings tab of the access control policy option, Enable Threat Intelligence Director has to be enabled.
- Add rules to the access control policy if they are not already present.
- If you want SHA-256 observables to generate observations and Firepower Management Center events, create one or more Malware Cloud Lookup or Block Malware file rules and associate the file policy with one or more rules in the access control policy.
- If you want IPv4, IPv6, URL, or Domain Name observations to generate connection and security intelligence events, enable connection and security intelligence logging in the access control policy.
Components Used
The information in this document is based on these software versions:
- Cisco Firepower Threat Defense (FTD) Virtual which runs 6.2.2.81
- Firepower Management Center Virtual (vFMC) which runs 6.2.2.81
Note: The information in this document was created from the devices in a specific lab environment. All of the devices used in this document started with a cleared (default) configuration. If your network is live, ensure that you understand the potential impact of any command.
Background Information
Cisco Threat Intelligence Director (TID) is a system that operationalizes threat intelligence information. The system consumes and normalizes heterogeneous third-party cyber threat intelligence, publishes the intelligence to detection technologies, and correlates the observations from the detection technologies.
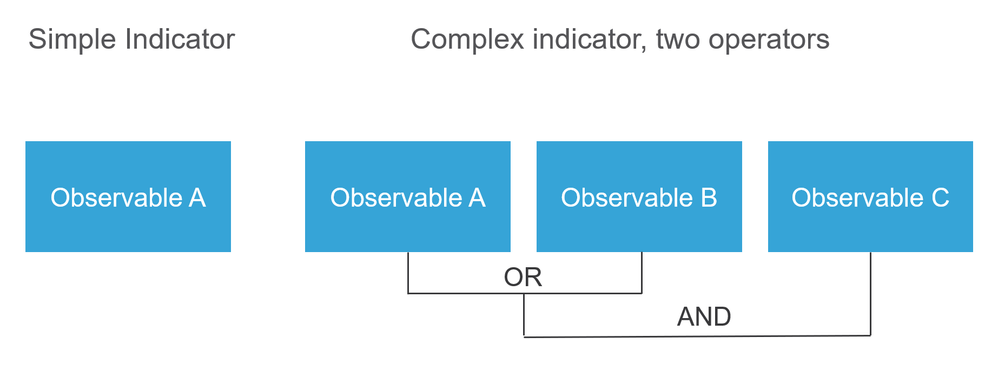
There are three new terms: observables, indicators, and incidents. Observable is just a variable, which can be for example URL, domain, IP address, or SHA256. Indicators are made from observables. There are two types of indicators. A simple indicator contains only one observable. In the case of complex indicators, there are two or more observables that are connected to each other using logical functions like AND and OR. Once the system detects traffic that should be blocked or monitored on the FMC the incident appears.
How does it work?
As shown in the image, on the FMC you have to configure sources from where you would like to download threat intelligence information. The FMC then pushes that information (observables) to sensors. When the traffic matches the observables, the incidents appear in the FMC user interface (GUI).
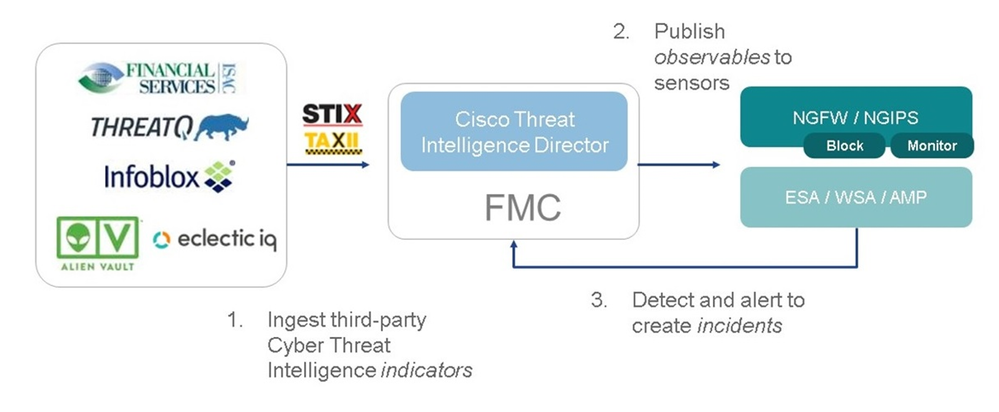
There are two new terms:
- STIX (Structured Threat Intelligence eXpression) is a standard for sharing and using threat intelligence information. There are three key functional elements: Indicators, Observables, and Incidents.
- TAXII (Trusted Automated eXchange of Indicator Information) is a transport mechanism for threat information.
Configure
To complete the configuration take into consideration these sections:
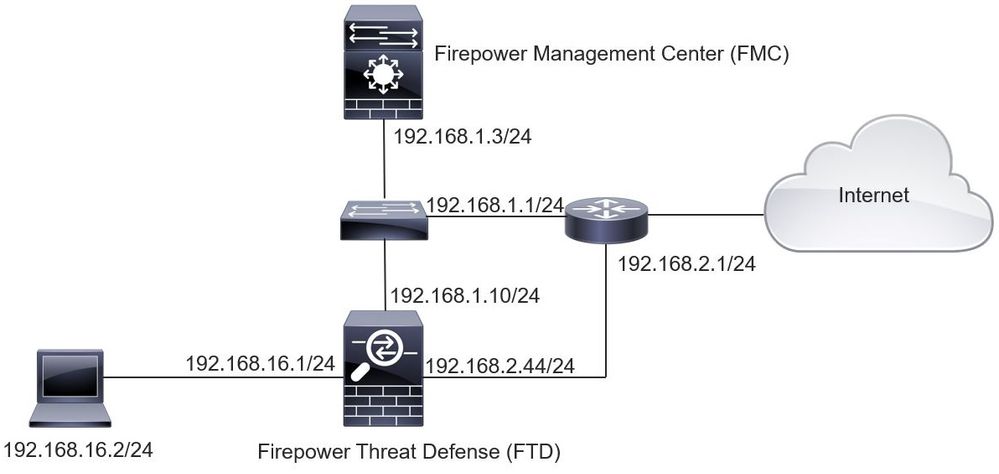
Network Diagram
Configuration
Step 1. To configure TID, you have to navigate to the Intelligence tab, as shown in the image.
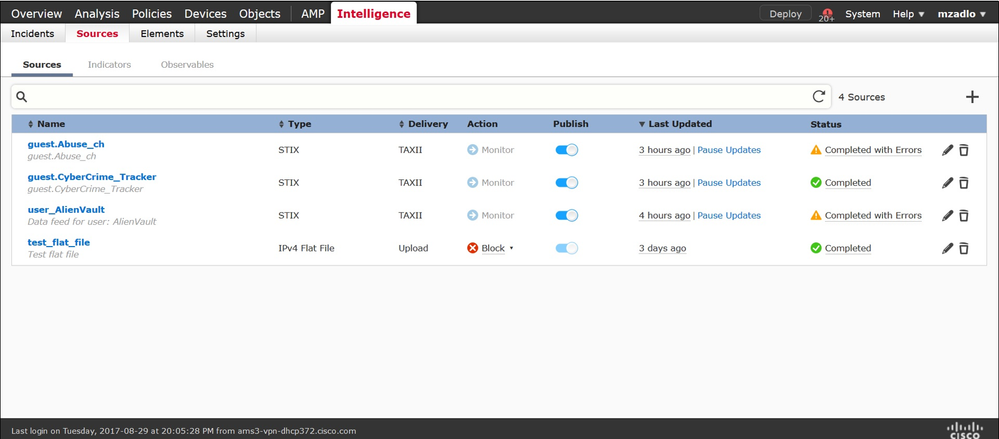
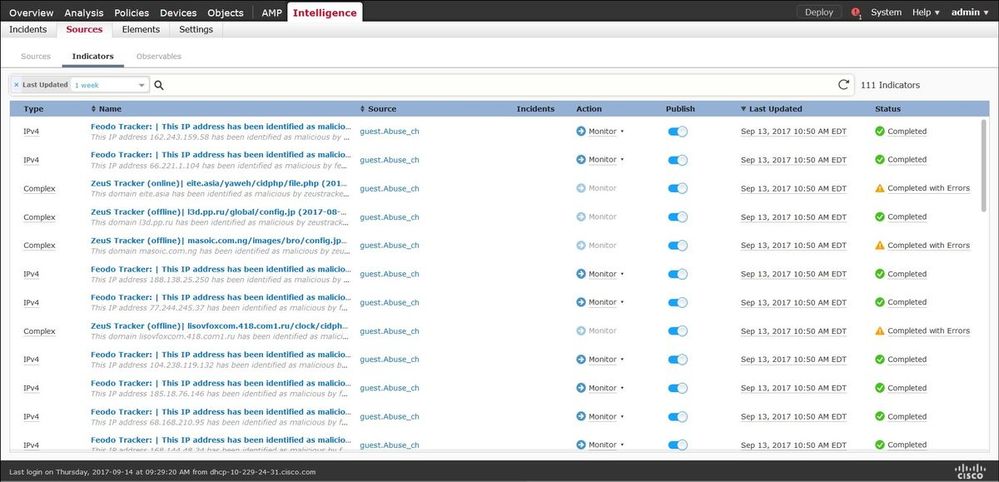
Note: Status 'Completed with Errors' is expected in case a feed contains unsupported observables.
Step 2. You have to add sources of threats. There are three ways to add sources:
- TAXII - When you use this option, you can configure a server where threat information is stored in STIX format.
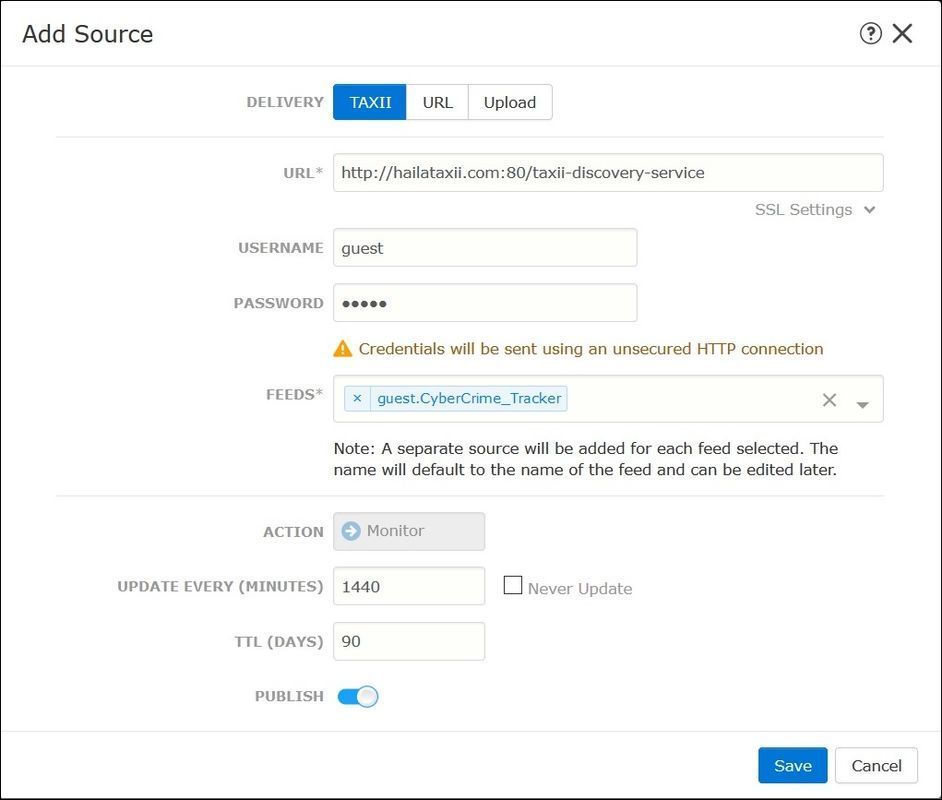
Note: The only Action available is Monitor. You cannot configure the Block Action for threats in STIX format.
- URL - You can configure a link to an HTTP/HTTPS local server where the STIX threat or flat file is located.
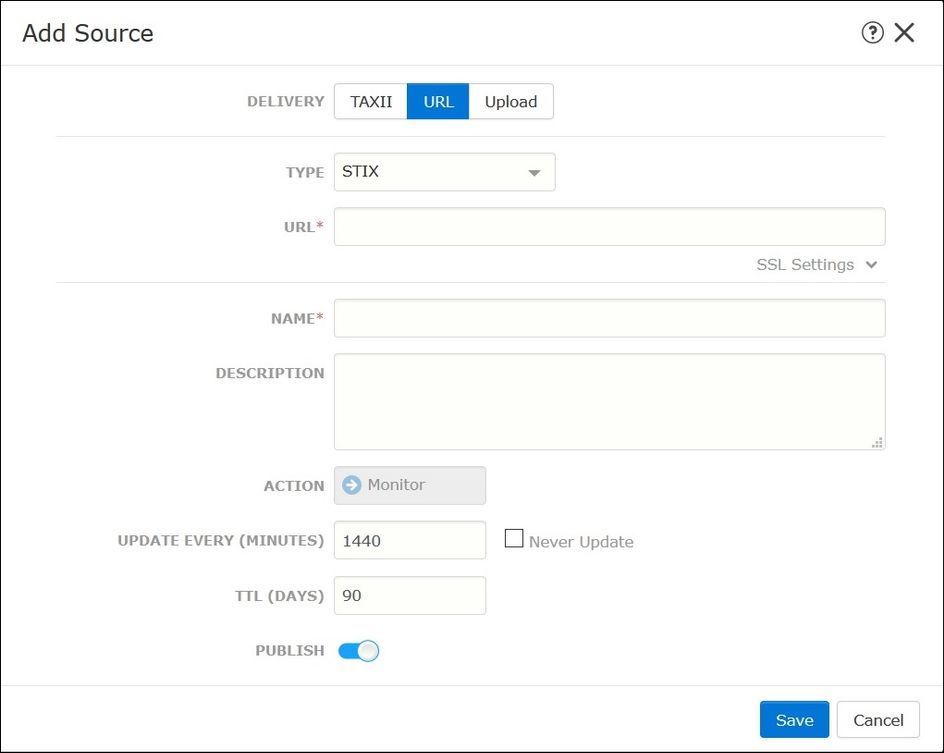
- Flat file - You can upload a file in *.txt format and you have to specify the content of the file. The file must contain one content entry per line.
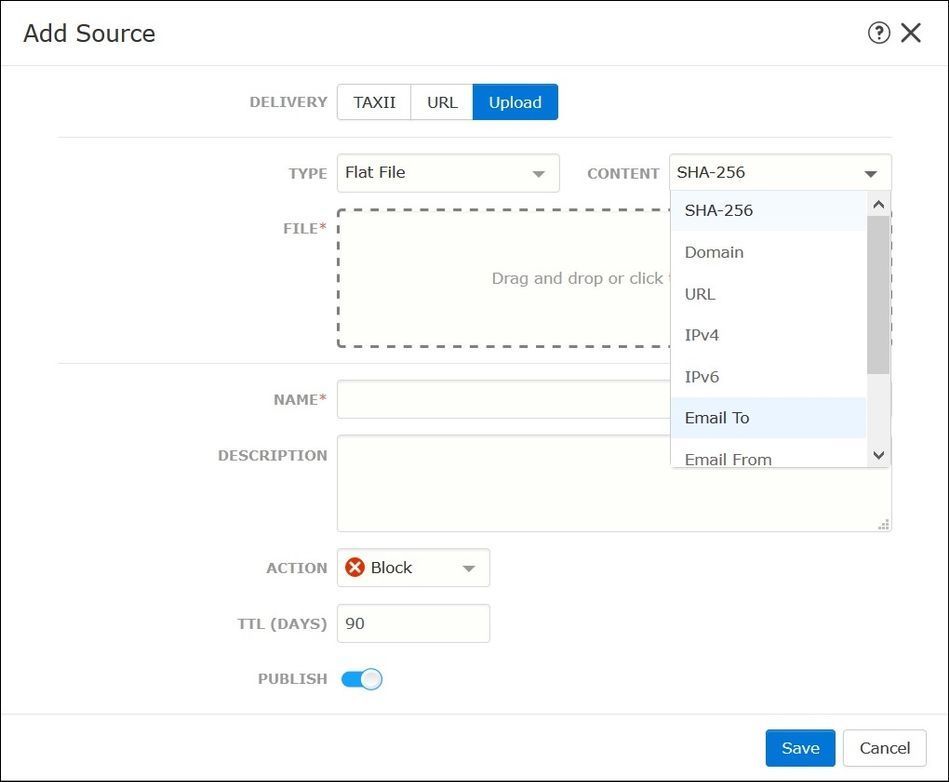
Note: By default, all sources are published, this means that they are pushed to sensors. This process can take up to 20 minutes or more.
Step 3. Under the Indicator tab, you can confirm if indicators were downloaded property from the configured sources:
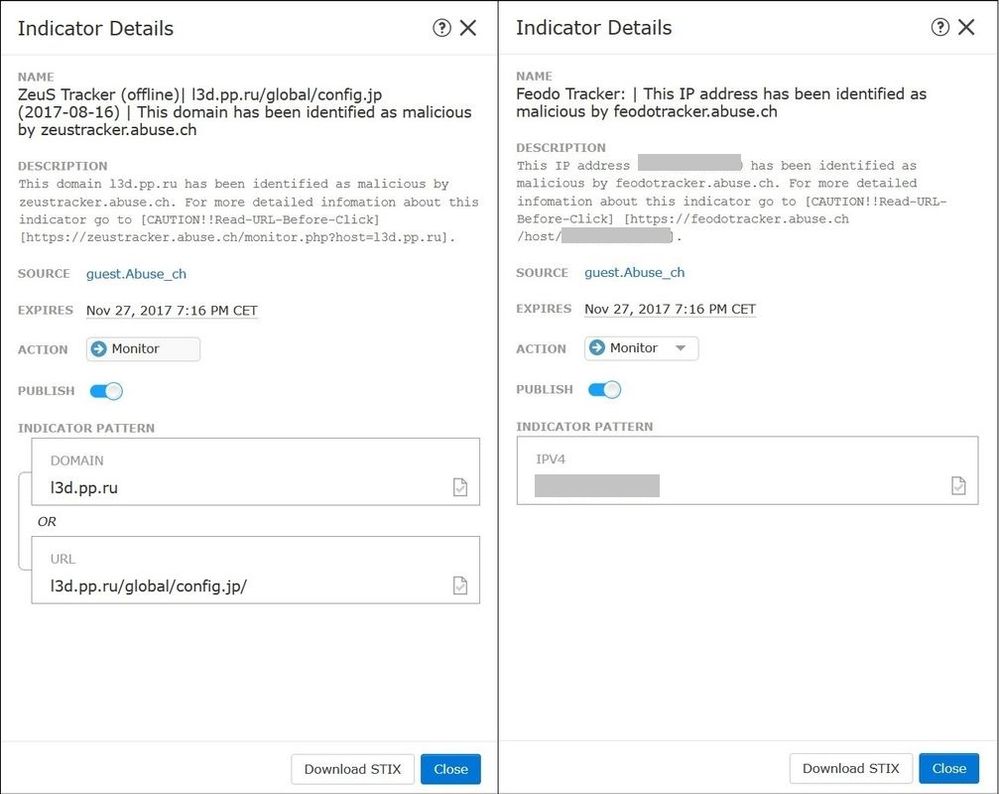
Step 4. Once you select the name of an indicator you can see more details about it. Additionally, you can decide if you want to publish it to the sensor or if you want to change the action (in the case of a simple indicator).
As shown in the image, a complex indicator is listed with two observables that are connected by the OR operator:
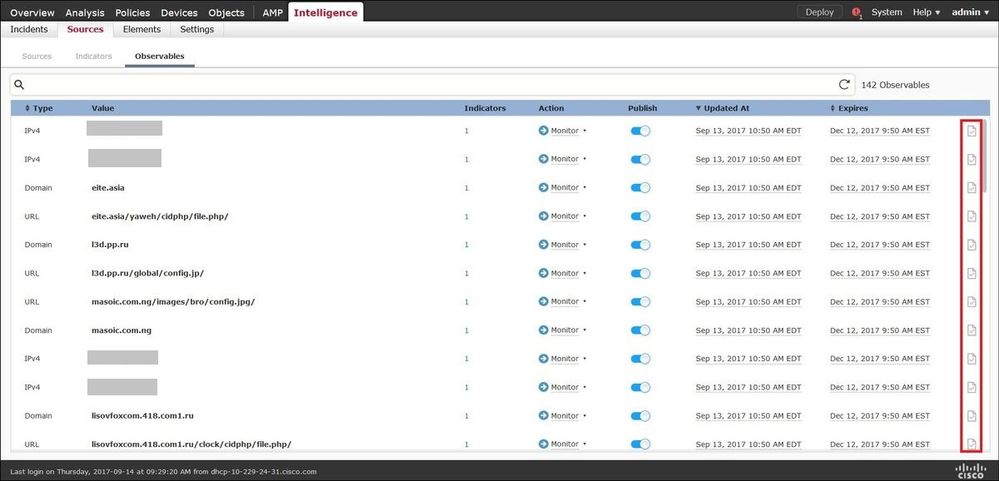
Step 5. Navigate to the Observables tab where you can find URLs, IP addresses, domains, and SHA256 that are included in the indicators. You can decide which observables you would like to push to sensors and optionally change the action for them. In the last column, there is a whitelist button that is equivalent to a publish/not publish option.
Step 6. Navigate to the Elements tab to verify the list of devices where TID is enabled:

Step 7 (Optional). Navigate to the Settings tab and select the Pause button to stop pushing indicators to sensors. This operation can take up to 20 minutes.

Verify
Method 1. To verify if TID acted on the traffic, you need to navigate to the Incidents tab.

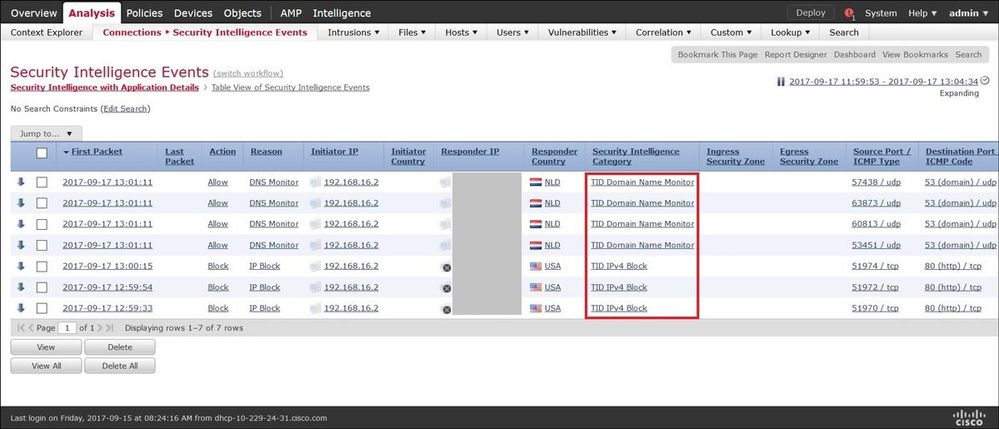
Method 2. The incidents can be found under the Security Intelligence Events tab under a TID tag.
Note: TID has a storage capacity of 1 million incidents.
Method 3. You can confirm if configured sources (feeds) are present on the FMC and a sensor. To do that, you can navigate to these locations on the CLI:
/var/sf/siurl_download/
/var/sf/sidns_download/
/var/sf/iprep_download/
There is a new directory created for SHA256 feeds: /var/sf/sifile_download/
root@ftd622:/var/sf/sifile_download# ls -l
total 32
-rw-r--r-- 1 root root  166 Sep 14 07:13 8ba2b2c4-9275-11e7-8368-f6cc0e401935.lf
-rw-r--r-- 1 root root   38 Sep 14 07:13 8ba40804-9275-11e7-8368-f6cc0e401935.lf
-rw-r--r-- 1 root root   16 Sep 14 07:13 IPRVersion.dat
-rw-rw-r-- 1 root root 1970 Sep 14 07:13 dm_file1.acl
-rw-rw-r-- 1 www  www   167 Sep 14 07:13 file.rules
drwxr-xr-x 2 www  www  4096 Sep  4 16:13 health
drwxr-xr-x 2 www  www  4096 Sep  7 22:06 peers
drwxr-xr-x 2 www  www  4096 Sep 14 07:13 tmp
root@ftd622:/var/sf/sifile_download# cat 8ba2b2c4-9275-11e7-8368-f6cc0e401935.lf
#Cisco TID feed:TID SHA-256 Block:1
7a00ef4b801b2b2acd09b5fc72d7c79d20094ded6360fb936bf2c65a1ff16907
2922f0bb1acf9c221b6cec45d6d10ee9cf12117fa556c304f94122350c2bcbdc
Note: TID is enabled only on the Global Domain on the FMC.
Note: If you host TID on the active Firepower Management Center in a high availability configuration (physical FMC appliances), the system does not synchronize TID configurations and TID data to the standby Firepower Management Center.
Troubleshoot
There is a top-level process which is called tid. This process depends on three processes: mongo, RabbitMQ, and redis. To verify processes run pmtool status | grep 'RabbitMQ\|mongo\|redis\|tid' | grep " - " command.
root@fmc622:/Volume/home/admin# pmtool status | grep 'RabbitMQ\|mongo\|redis\|tid' | grep " - "
RabbitMQ (normal) - Running 4221
mongo (system) - Running 4364
redis (system) - Running 4365
tid (normal) - Running 5128
root@fmc622:/Volume/home/admin#
In order to verify in real-time what action is taken, you can execute system support firewall-engine-debug or system support trace command.
> system support firewall-engine-debug

Please specify an IP protocol:
Please specify a client IP address: 192.168.16.2
Please specify a client port:
Please specify a server IP address:
Please specify a server port:
Monitoring firewall engine debug messages
...
192.168.16.2-59122 > 129.21.1.40-80 6 AS 1 I 1 URL SI: ShmDBLookupURL("http://www.example.com/") returned 1
...
192.168.16.2-59122 > 129.21.1.40-80 6 AS 1 I 1 URL SI: Matched rule order 19, Id 19, si list id 1074790455, action 4
192.168.16.2-59122 > 129.21.1.40-80 6 AS 1 I 1 deny action
There are two possibilities in terms of action:
- URL SI: Matched rule order 19, Id 19, si list id 1074790455, action 4 - traffic was blocked.
- URL SI: Matched rule order 20, Id 20, si list id 1074790456, action 6 - traffic was monitored.


 Feedback