SG500XG-8F8T-K9-NA: Lots of Dropped Packets
Available Languages
Date Identified
June 15, 2017
Date Resolved
July 14, 2017
Products Affected
| Model |
Firmware Version |
|---|---|
| SG500XG-8F8T-K9-NA |
1.4.7.06 |
Problem Description
There are lots of dropped events on the RMON statistics of interfaces in an SG500XG where a UCS220 device is connected.
To view the port statistics if there are dropped packets, follow the steps below:
Step 1. Log in to the switch web-based utility and go to Status and Statistics > RMON > Statistics.

Step 2. In the Interface section, click on the Unit/Slot drop-down menu to choose the specific unit if your switch belongs to a stack.

Note: In this example, 1/1 is chosen indicating that the switch is the first unit in the stack and is on the first slot.
Step 3. Click the Port drop-down menu to choose the specific port that you want to view.

Note: In this example, Port GE3 is chosen.
Step 4. (Optional) Click a radio button to choose the Refresh Rate. This would allow the page to refresh automatically based on the interval you have set.

Note: In this example, 15 sec is chosen indicating that the page will refresh automatically every 15 seconds.
Step 5. Check the statistics displayed to verify if there are dropped events in the chosen interface.

Note: In this example, the statistics show that there are 595 events dropped.
Next Steps
Do a packet capture on the problematic port using Wireshark. Follow the steps below:
Enable Auto Negotiation
Enabling Auto negotiation allows the port to advertise its transmission speed, duplex mode, and Flow control abilities to the port link partner.
Step 1. Log in to the switch web-based utility and go to Port Management > Port Settings.

Step 2. Under the Port Setting Table, click on the radio button of the port where dropped events are found and click Edit.

Note: In this example, Port GE3 is chosen.
Step 3. In the Edit Port Setting window, check the Enable checkbox for Auto Negotiation then click Apply.

Enable Log Settings
Step 1. Go to Administration > System Log > Log Settings.

Step 2. Under Log Settings, check the Logging Enable check box.

Step 3. Set the Originator Identifier to None by clicking on the radio button.

Step 4. Under RAM and Flash Memory Logging, check all the check boxes except for Debug and then click Apply.

Clear Logs on the RAM and Flash
Step 1. Go to Status and Statistics > View Log > RAM Memory.

Step 2. Click the Clear Logs button under the RAM Memory Log Table.

Step 3. Go to Flash Memory.

Step 4. Click the Clear Logs button under the Flash Memory Log Table.

Add Port and VLAN Mirroring
Step 1. Go to Administration > Diagnostics > Port and VLAN Mirroring.

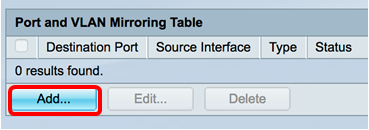
Step 2. Under the Port and VLAN Mirroring Table, click on Add.

Step 3. In the Add Port and VLAN Mirroring window, click on the Destination Port drop-down menu to choose the port where the computer that is running Wireshark is connected.

Note: In this example, Port GE1 is chosen.
Step 4. Click on the Source Port drop-down menu to choose the port where the dropped events are found.

Note: In this example, Port GE3 is chosen.
Step 5. Click on the Tx and Rx radio button to choose the Type and then click Apply.

Step 6. Launch the capture on the computer running Wireshark.
Resolution
Enable Flow Control. To do this, follow the steps below:
Step 1. Log in to the switch web-based utility and go to Port Management > Port Settings.

Step 2. Under the Port Setting Table, click on the radio button of the port where dropped events are found and click Edit.

Note: In this example, Port GE3 is chosen.
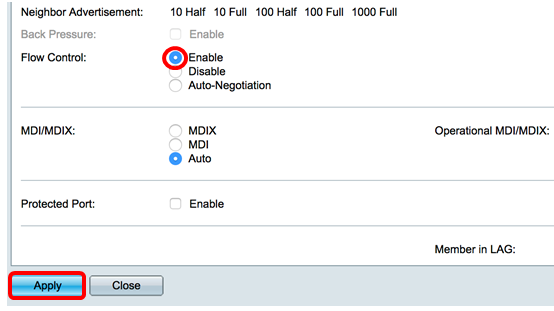
Step 3. In the Edit Port Setting window, check the Enable checkbox for Flow Control then click Apply.

Step 4. Click the blinking  button to permanently save the settings.
Revision History
| Revision | Publish Date | Comments |
|---|---|---|
1.0 |
12-Dec-2018 |
Initial Release |
 Feedback