View Traffic Statistics on RV320 and RV325 VPN Routers
Available Languages
Objective
Traffic statistics provide real-time traffic (number of packets transmitted and received) information for all the interfaces of a network device. Based on the traffic statistics for each interface, you can assess the systems performance.
This article explains the fields on the Traffic Statistics page.
Applicable Devices
• RV320 Dual WAN VPN Router
• RV325 Gigabit Dual WAN VPN Router
Software Version
• v1.1.0.09
Traffic Statistics
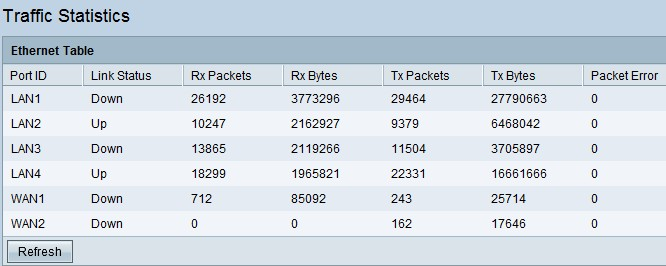
Step 1. Log in to the web configuration utility and choose Port Management > Traffic Statistics. The Traffic Statistics page opens.

The following information is displayed in the Ethernet Table:
• Port ID — Displays the name of all the interfaces available on the device.
Note: The RV325 has 14 LAN ports, while the RV320 only has 4.
• Link Status — Indicates whether the corresponding interface is up or down. When a device is plugged in, it shows the status as Up, and when the device is not plugged in it shows Down.
• Rx Packets — Displays the total number of packets received by the router on the corresponding network interface.
• Rx Bytes — Displays the total number of bytes received by the router on the corresponding network interface.
• Tx Packets — Displays the total number of packets sent by the router that are transmitted through the network interface.
• Tx Bytes — Displays the total number of bytes sent by the router that are transmitted through the network interface.
• Packet Error — Displays the total number of errors when data is sent or received by the router.
Step 2. (optional) To update the statistics, click Refresh.
 Feedback