View the Dashboard on the RV110W
Available Languages
Objectives
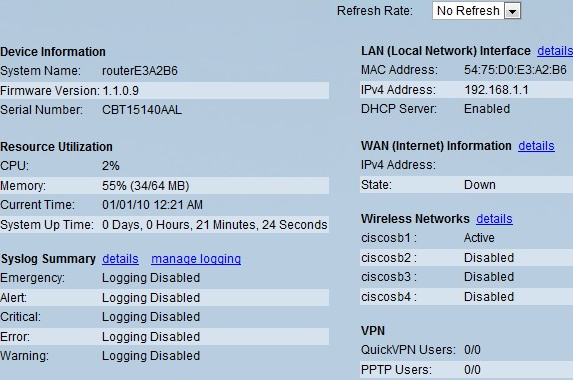
The RV110W Dashboard page displays a wealth of concise information about many features on the device.
This document explains how to view the dashboard on the RV110W.
Applicable Devices
• RV110W
View the Dashboard
Step 1. In the web configuration utility choose Status > Dashboard.

Step 2. To have the dashboard refresh with updated information periodically, choose a time from the Refresh Rate drop-down menu.
Step 3. The dashboard displays the following information:
• Device Information

– System Name — The name of the device.
– Firmware Version — The current software version the device is running.
– Serial Number — The serial number of the device.
• Resource Utilization

– CPU — The amount of CPU being used by the device.
– Memory — The amount of memory that is free or not being used.
– Current Time — The time that which the device is currently set.
– System Time Up — How long the system has been running.
• Syslog Summary

Indicates whether logging is enabled for these event categories:
– Emergency — System is unusable. This is normally broadcast to all processes.
– Alert — Immediate action needed.
– Critical — Critical conditions, such as a hard device error are logged.
– Error — Error conditions are logged.
– Warning — Warning conditions are logged.
• LAN (Local Network) Interface

– MAC Address — The MAC address of the router.
– IPv4 Address — The local IP address of the router.
– DHCP Server — The status of the router IPv4 DHCP server (Enabled or Disabled).
• WAN (Internet) Information

– IPv4 Address — The IP address of the router WAN port.
– State — The state of the Internet connection (Up or Down).
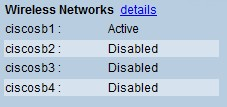
• Wireless Networks

Lists the status of the four wireless network SSIDs.
• VPN

– QuickVPN Users — The number of QuickVPN users that are assigned on the device and in use.
– PPTP Users — The number of Point-to-Point Tunneling Protocol users that are assigned on the device and in use.
 Feedback